| Param | Original file | Final file |
|---|---|---|
| Filename | modeM0/AS1A11_093T01_9000005064_35334cztM0_level2.evt | modeM0/AS1A11_093T01_9000005064_35334cztM0_level2_quad_clean.evt |
| Size (bytes) | 274,547,520 | 37,123,200 |
| Size | 261.8 MB | 35.4 MB |
| Events in quadrant A | 1,455,150 | 247,414 |
| Events in quadrant B | 3,252,586 | 212,146 |
| Events in quadrant C | 1,588,789 | 246,379 |
| Events in quadrant D | 1,839,823 | 231,213 |
| Mode M0 | |||
|---|---|---|---|
| Quadrant | BADHDUFLAG | Total packets | Discarded packets |
| A | 0 | 8080 | 2146 |
| B | 0 | 16864 | 5414 |
| C | 0 | 8463 | 2201 |
| D | 0 | 10078 | 2738 |
| Mode SS | |||
|---|---|---|---|
| Quadrant | BADHDUFLAG | Total packets | Discarded packets |
| A | 0 | 80 | 15 |
| B | 0 | 80 | 21 |
| C | 0 | 80 | 21 |
| D | 0 | -1 | -1 |
| Mode M9 | |||
|---|---|---|---|
| Quadrant | BADHDUFLAG | Total packets | Discarded packets |
| A | 0 | 21 | 0 |
| B | 0 | 21 | 0 |
| C | 0 | 20 | 0 |
| D | 0 | 20 | 0 |
| Quadrant | Total seconds | Saturated seconds | Saturation percentage |
|---|---|---|---|
| A | 2874 | 8 | 0.278358% |
| B | 2596 | 724 | 27.889060% |
| C | 2876 | 29 | 1.008345% |
| D | 2775 | 52 | 1.873874% |
Noise dominated data is calculated using 1-second bins in cleaned event files. If a bin has >2000 counts, and if more than 50% of those come from <1% of pixels, then it is considered to be noise-dominated and hence unusable.
| Quadrant | # 1 sec bins | Bins with >0 counts | Bins with >2000 counts | High rate bins dominated by noise | Noise dominated (total time) | Noise dominated (detector-on time) | Marked lightcurve |
|---|---|---|---|---|---|---|---|
| A | 6198 | 3216 | 4 | 4 | 0.06% | 0.12% |  |
| B | 6197 | 2875 | 495 | 495 | 7.99% | 17.22% | 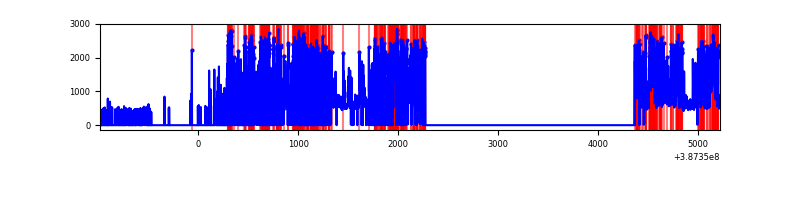 |
| C | 6203 | 3222 | 33 | 33 | 0.53% | 1.02% | 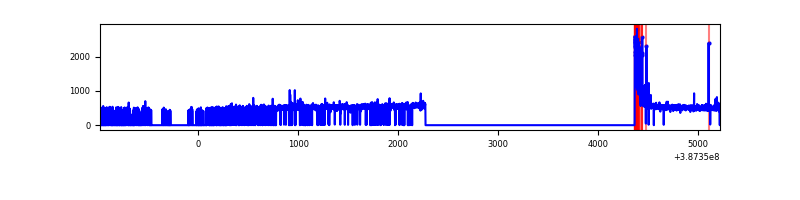 |
| D | 6194 | 3110 | 36 | 36 | 0.58% | 1.16% | 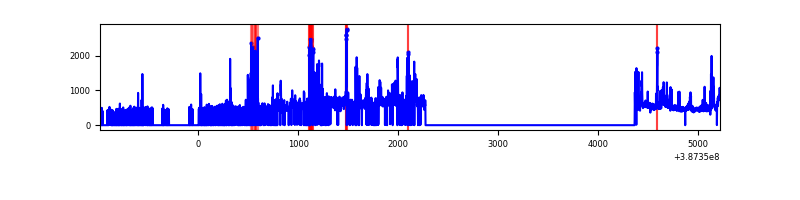 |
Top three noisy pixels from each quadrant. If the there are fewer than three noisy pixels in the level2.evt file, extra rows are filled as -1
| Pixel properties | Quadrant properties | ||||||
|---|---|---|---|---|---|---|---|
| Quadrant | DetID | PixID | Counts | Sigma | Mean | Median | Sigma |
| A | 10 | 83 | 52388 | 712.25 | 356 | 350 | 73.1 |
| A | 8 | 192 | 12179 | 161.91 | 356 | 350 | 73.1 |
| A | 13 | 6 | 9453 | 124.59 | 356 | 350 | 73.1 |
| B | 5 | 236 | 1973008 | 36088.76 | 283 | 276 | 54.7 |
| B | 5 | 172 | 86201 | 1571.89 | 283 | 276 | 54.7 |
| B | 4 | 232 | 72483 | 1320.94 | 283 | 276 | 54.7 |
| C | 0 | 10 | 120525 | 1518.23 | 341 | 343 | 79.2 |
| C | 15 | 214 | 118739 | 1495.67 | 341 | 343 | 79.2 |
| C | 14 | 67 | 8069 | 97.6 | 341 | 343 | 79.2 |
| D | 8 | 195 | 166281 | 2073.97 | 331 | 322 | 80.0 |
| D | 2 | 153 | 83967 | 1045.3 | 331 | 322 | 80.0 |
| D | 10 | 204 | 83812 | 1043.36 | 331 | 322 | 80.0 |
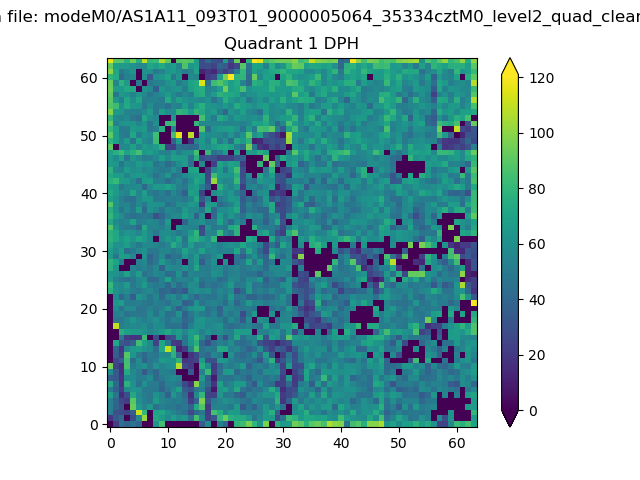
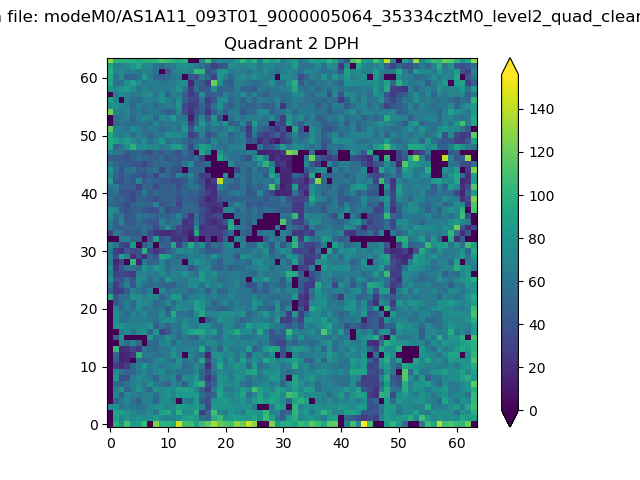
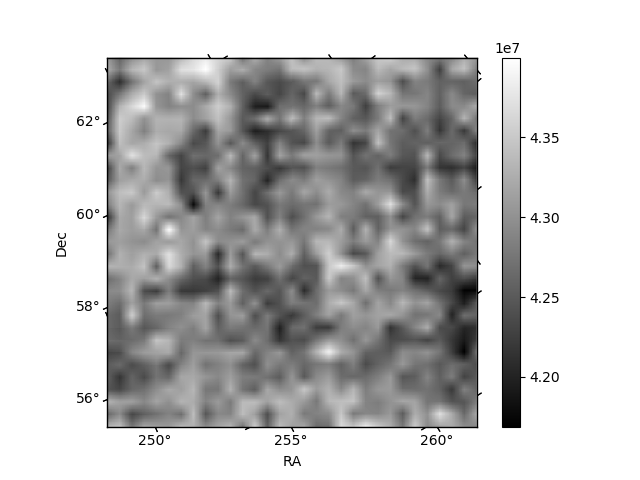
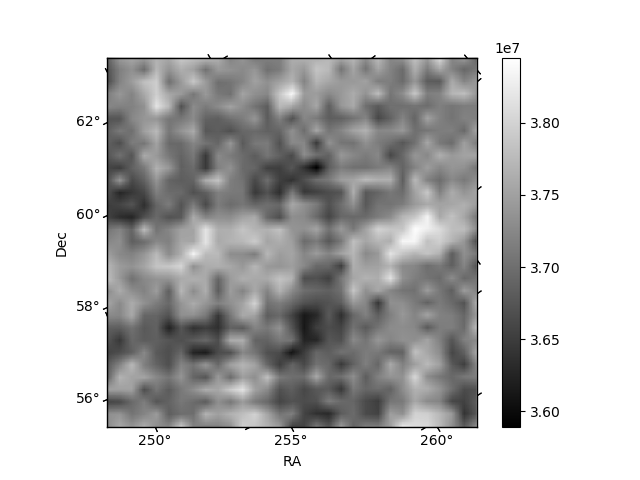
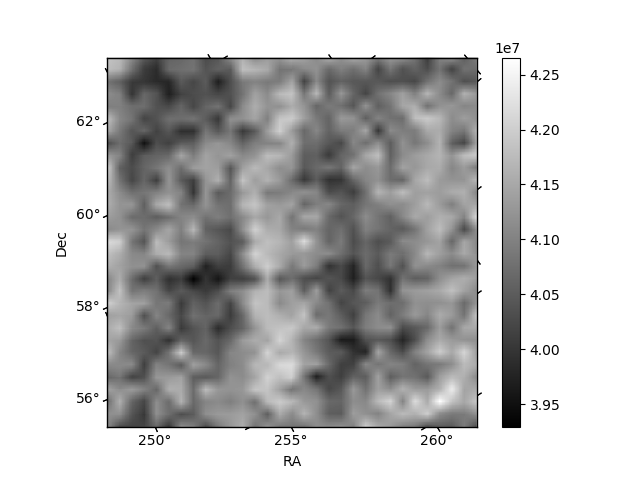
Histogram calculated using DETX and DETY for each event in the final _common_clean file
| Quadrant A | 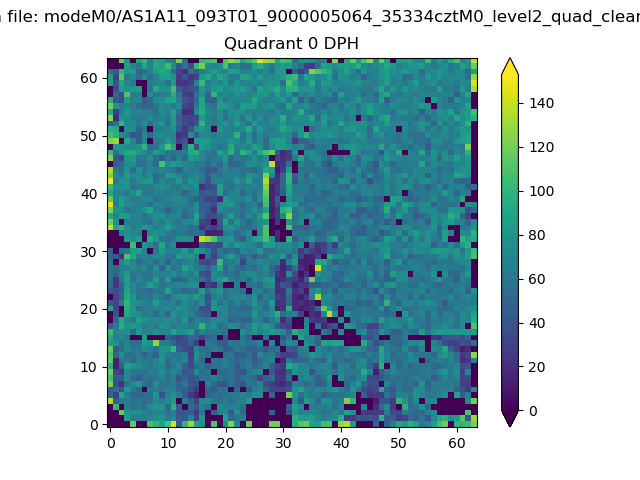 |
 |
Quadrant B |
|---|---|---|---|
| Quadrant D | 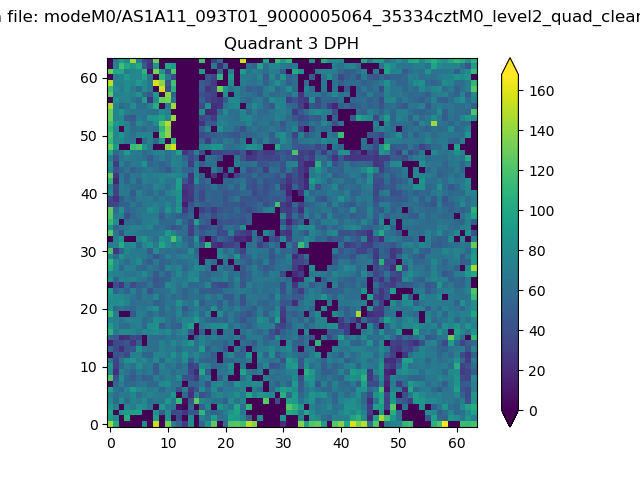 |
 |
Quadrant C |
| Plot type | Count rate plots | Images |
|---|---|---|
| Comparison with Poisson distribution Blue bars denote a histogram of data divided into 1 sec bins. Red curve is a Poisson curve with rate = median count rate of data. |
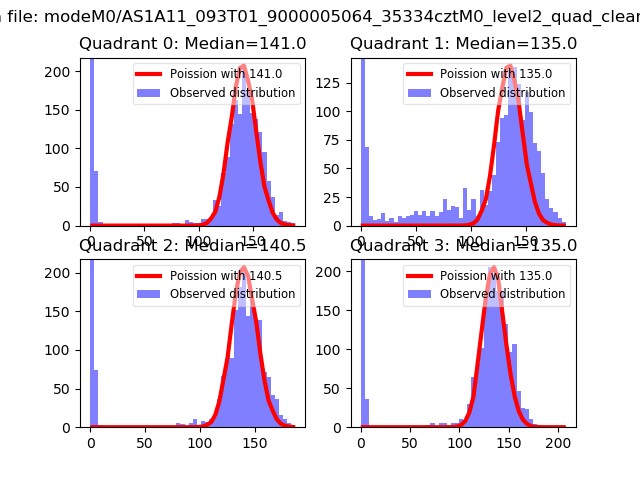 |
 |
| Quadrant-wise count rates Data is divided into 100 sec bins |
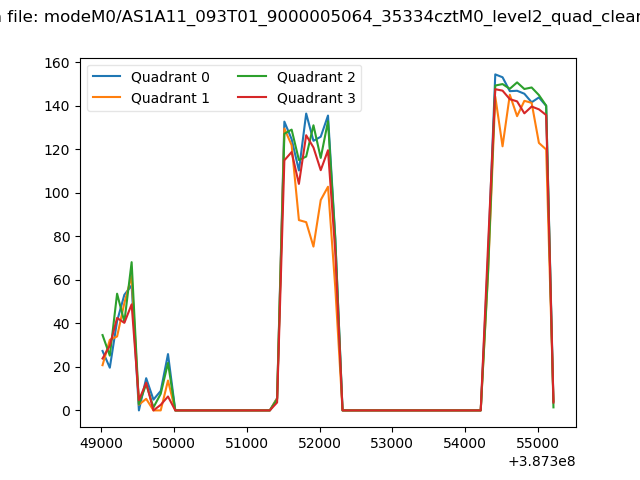 |
|
| Module-wise count rates for Quadrant A Data is divided into 100 sec bins |
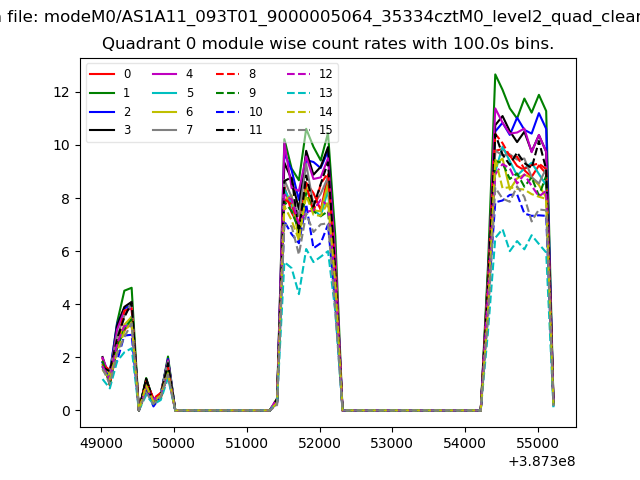 |
 |
| Module-wise count rates for Quadrant B Data is divided into 100 sec bins |
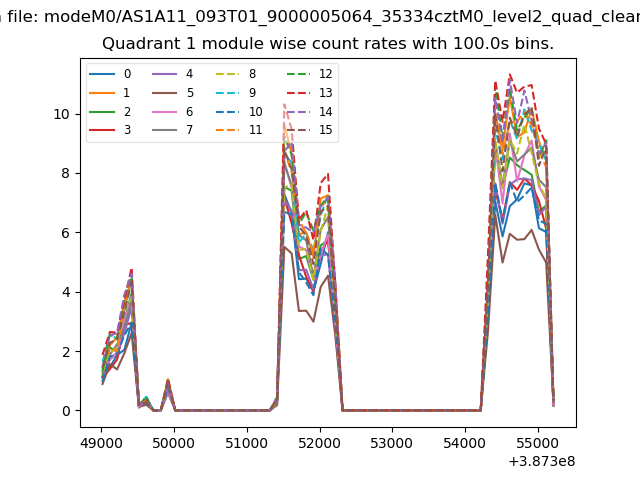 |
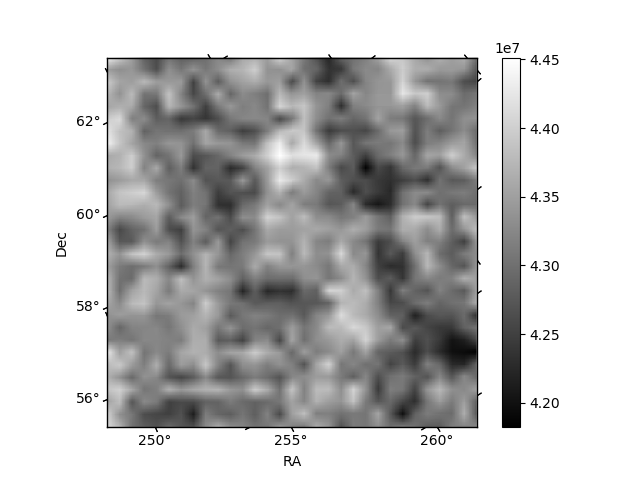 |
| Module-wise count rates for Quadrant C Data is divided into 100 sec bins |
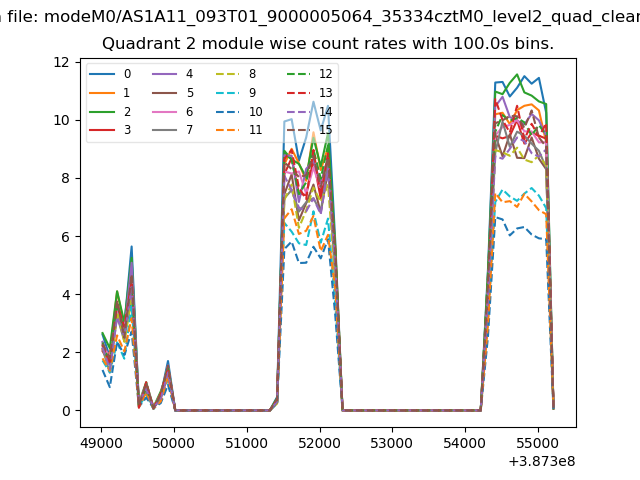 |
 |
| Module-wise count rates for Quadrant D Data is divided into 100 sec bins |
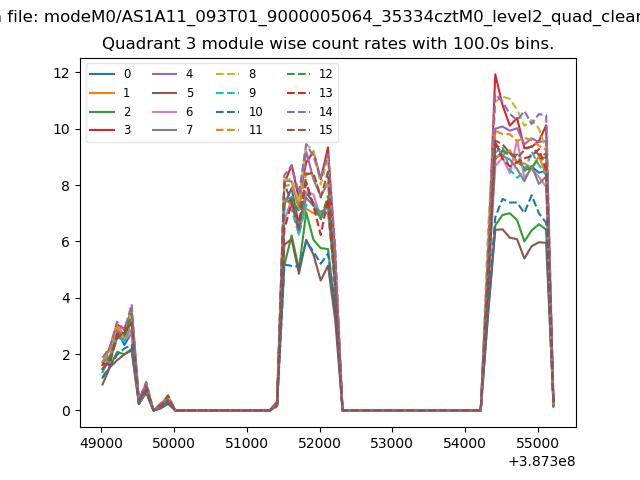 |
 |
| Parameter | Plot |
|---|---|
| CZT HV Monitor | 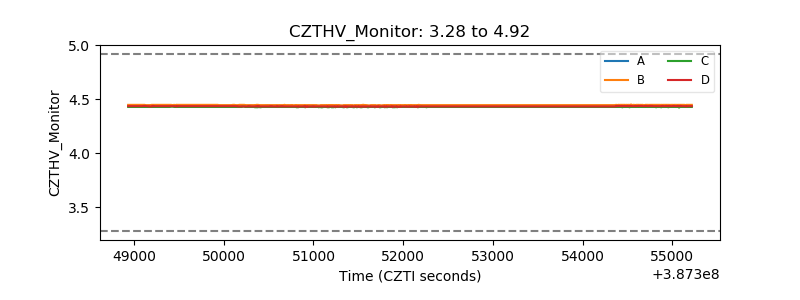 |
| D_VDD | 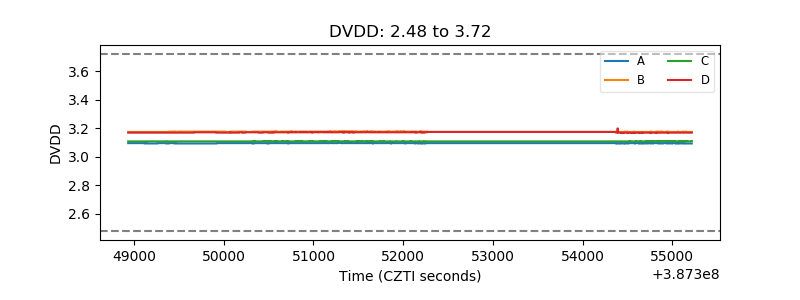 |
| Temperature 1 | 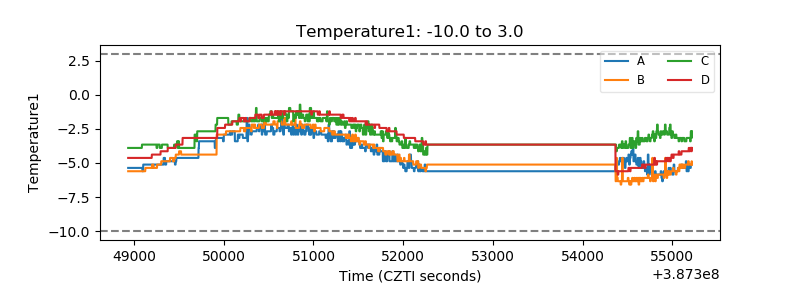 |
| Veto HV Monitor | 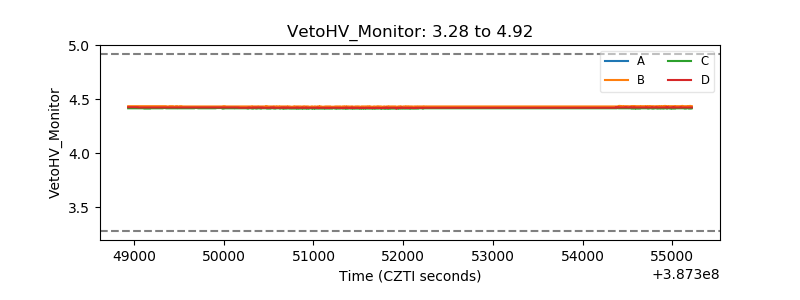 |
| Veto LLD | 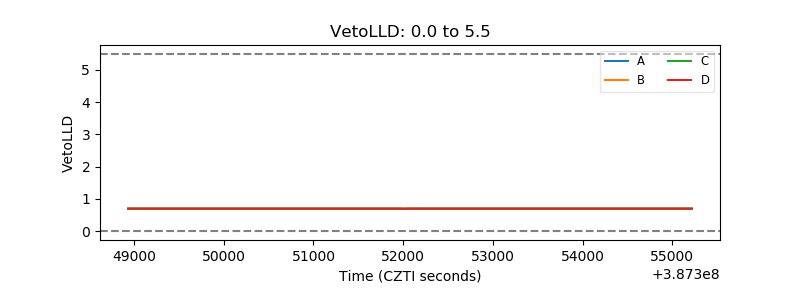 |
| Alpha Counter | 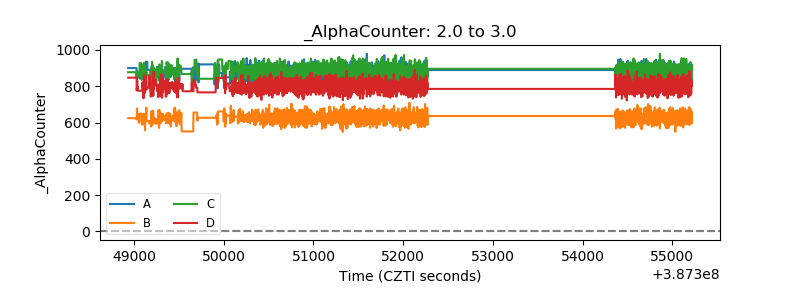 |
| _CPM_Rate | 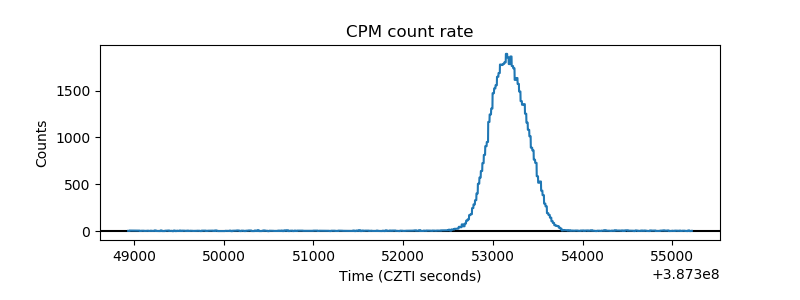 |
| CZT Counter | 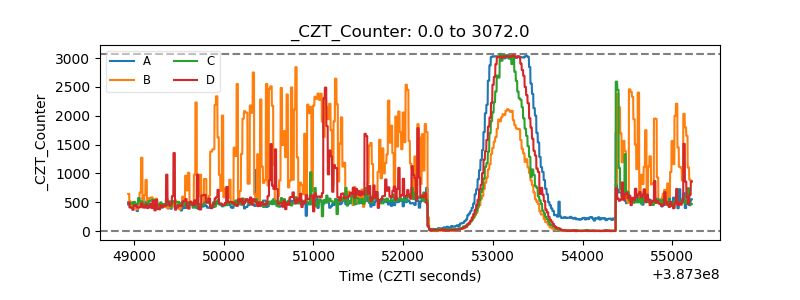 |
| +2.5 Volts monitor | 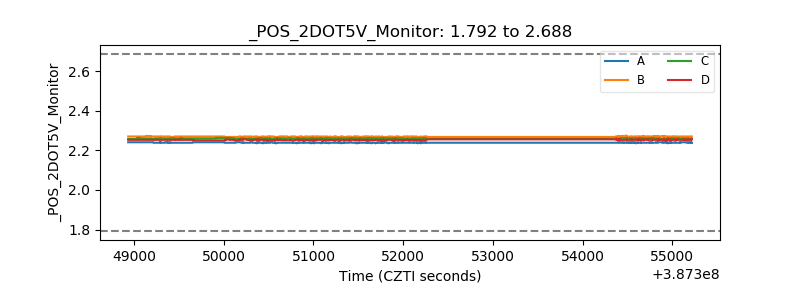 |
| +5 Volts monitor | 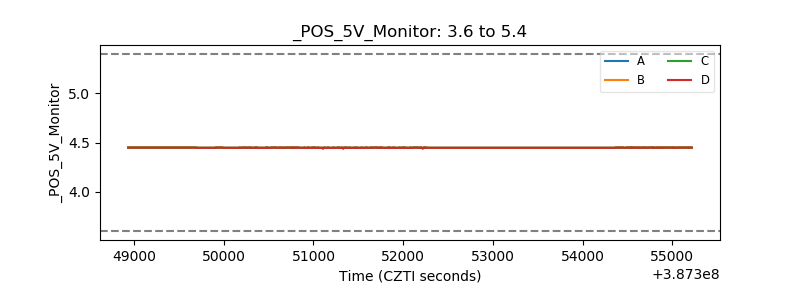 |
| _ROLL_ROT | 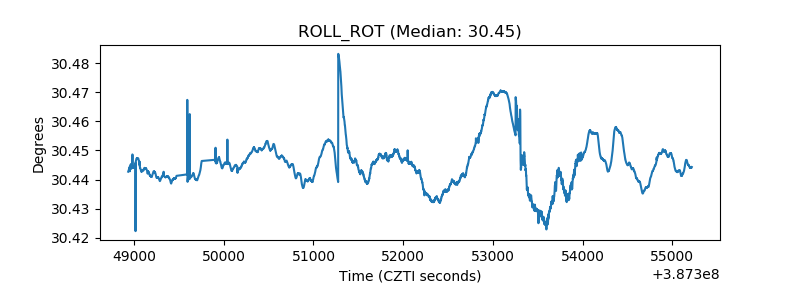 |
| _Roll_DEC | 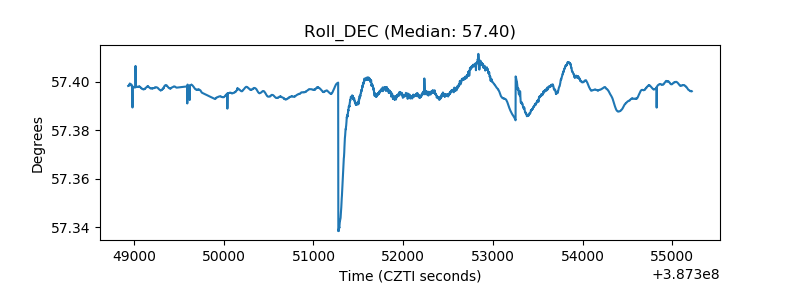 |
| _Roll_RA | 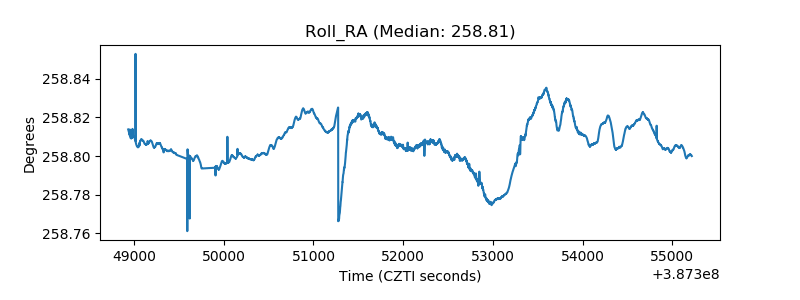 |
| Veto Counter | 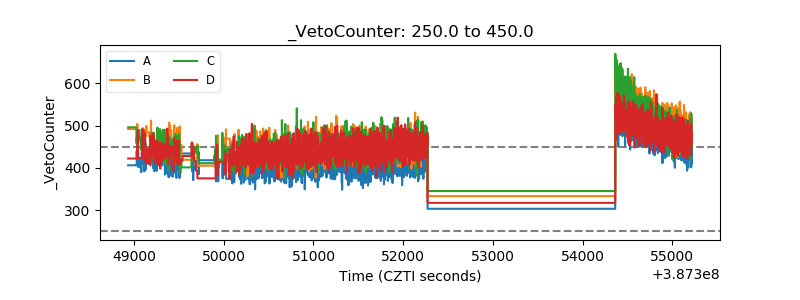 |