| Param | Original file | Final file |
|---|---|---|
| Filename | modeM0/AS1A11_093T01_9000005064_35331cztM0_level2.evt | modeM0/AS1A11_093T01_9000005064_35331cztM0_level2_quad_clean.evt |
| Size (bytes) | 539,153,280 | 77,267,520 |
| Size | 514.2 MB | 73.7 MB |
| Events in quadrant A | 2,529,591 | 501,626 |
| Events in quadrant B | 6,797,142 | 453,078 |
| Events in quadrant C | 2,841,382 | 523,280 |
| Events in quadrant D | 3,794,785 | 484,078 |
| Mode M0 | |||
|---|---|---|---|
| Quadrant | BADHDUFLAG | Total packets | Discarded packets |
| A | 0 | 11167 | 3 |
| B | 0 | 23925 | 2 |
| C | 0 | 11760 | 2 |
| D | 0 | 14790 | 2 |
| Mode SS | |||
|---|---|---|---|
| Quadrant | BADHDUFLAG | Total packets | Discarded packets |
| A | 0 | 108 | 0 |
| B | 0 | 108 | 0 |
| C | 0 | 108 | 0 |
| D | 0 | 108 | 0 |
| Mode M9 | |||
|---|---|---|---|
| Quadrant | BADHDUFLAG | Total packets | Discarded packets |
| A | 0 | 26 | 0 |
| B | 0 | 26 | 0 |
| C | 0 | 26 | 0 |
| D | 0 | 27 | 0 |
| Quadrant | Total seconds | Saturated seconds | Saturation percentage |
|---|---|---|---|
| A | 5389 | 23 | 0.426795% |
| B | 5389 | 1445 | 26.813880% |
| C | 5389 | 82 | 1.521618% |
| D | 5389 | 293 | 5.437001% |
Noise dominated data is calculated using 1-second bins in cleaned event files. If a bin has >2000 counts, and if more than 50% of those come from <1% of pixels, then it is considered to be noise-dominated and hence unusable.
| Quadrant | # 1 sec bins | Bins with >0 counts | Bins with >2000 counts | High rate bins dominated by noise | Noise dominated (total time) | Noise dominated (detector-on time) | Marked lightcurve |
|---|---|---|---|---|---|---|---|
| A | 7122 | 5390 | 16 | 16 | 0.22% | 0.30% | 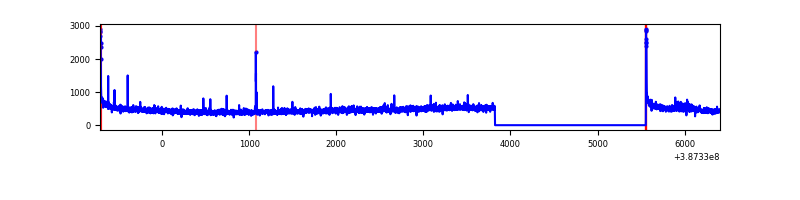 |
| B | 7122 | 5389 | 1070 | 1070 | 15.02% | 19.86% | 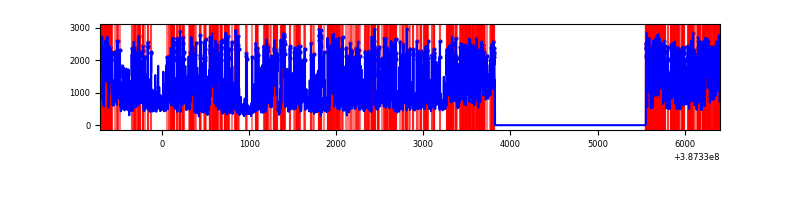 |
| C | 7122 | 5390 | 55 | 55 | 0.77% | 1.02% | 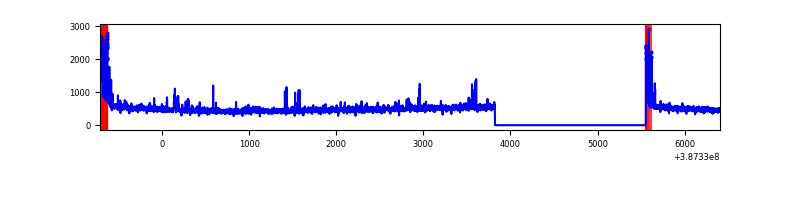 |
| D | 7122 | 5389 | 241 | 241 | 3.38% | 4.47% | 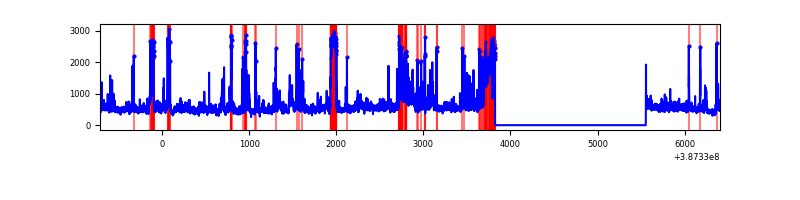 |
Top three noisy pixels from each quadrant. If the there are fewer than three noisy pixels in the level2.evt file, extra rows are filled as -1
| Pixel properties | Quadrant properties | ||||||
|---|---|---|---|---|---|---|---|
| Quadrant | DetID | PixID | Counts | Sigma | Mean | Median | Sigma |
| A | 10 | 83 | 96531 | 780.38 | 606 | 594 | 122.9 |
| A | 8 | 192 | 35750 | 285.97 | 606 | 594 | 122.9 |
| A | 13 | 6 | 14469 | 112.86 | 606 | 594 | 122.9 |
| B | 5 | 236 | 3667319 | 35169.02 | 547 | 532 | 104.3 |
| B | 5 | 172 | 910858 | 8731.15 | 547 | 532 | 104.3 |
| B | 4 | 232 | 32447 | 306.1 | 547 | 532 | 104.3 |
| C | 0 | 10 | 291781 | 2122.43 | 593 | 596 | 137.2 |
| C | 15 | 214 | 223506 | 1624.78 | 593 | 596 | 137.2 |
| C | 14 | 67 | 8230 | 55.64 | 593 | 596 | 137.2 |
| D | 7 | 223 | 579459 | 4212.69 | 571 | 556 | 137.4 |
| D | 8 | 195 | 365739 | 2657.45 | 571 | 556 | 137.4 |
| D | 10 | 118 | 218329 | 1584.74 | 571 | 556 | 137.4 |
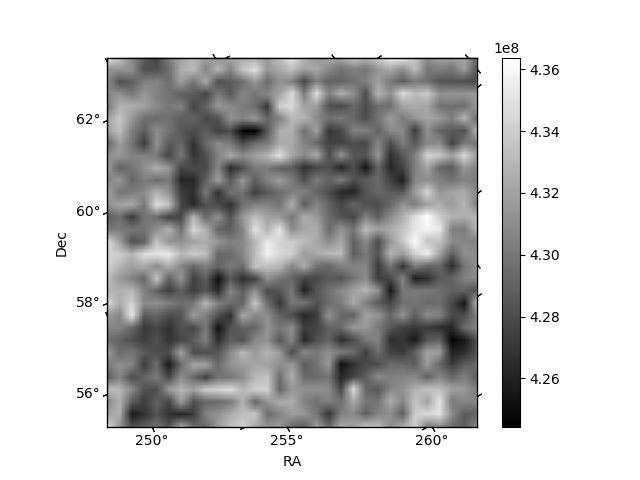
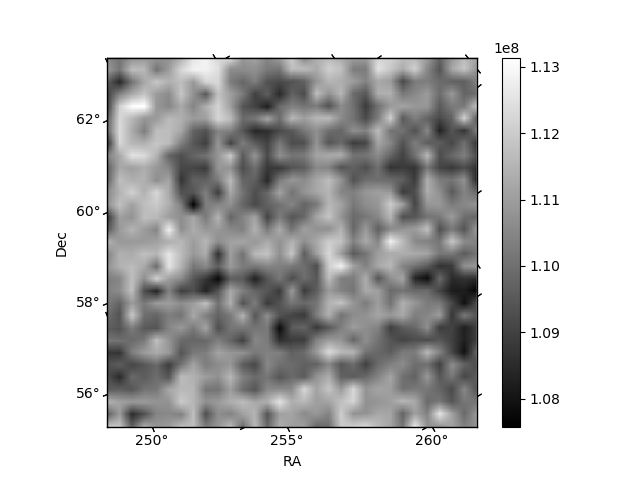
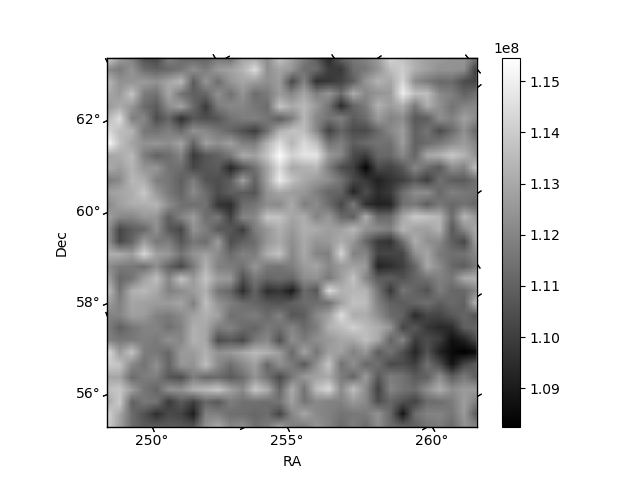
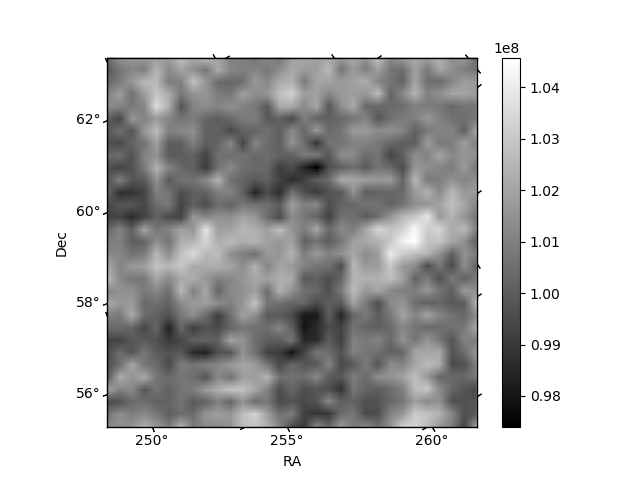
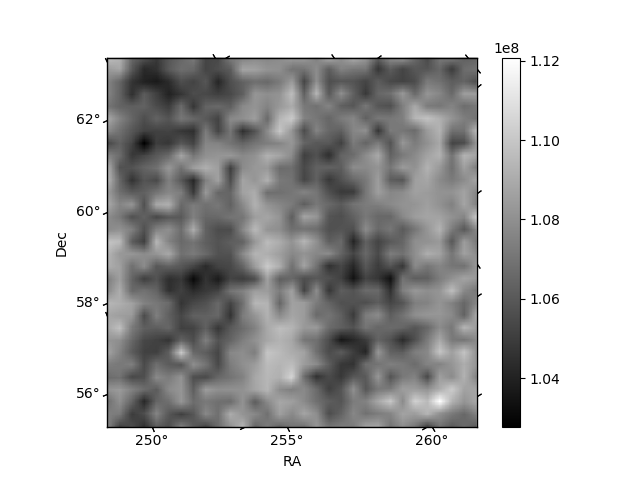
Histogram calculated using DETX and DETY for each event in the final _common_clean file
| Quadrant A | 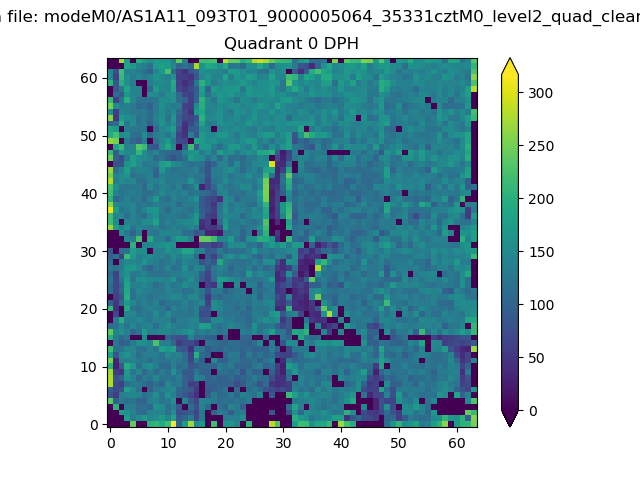 |
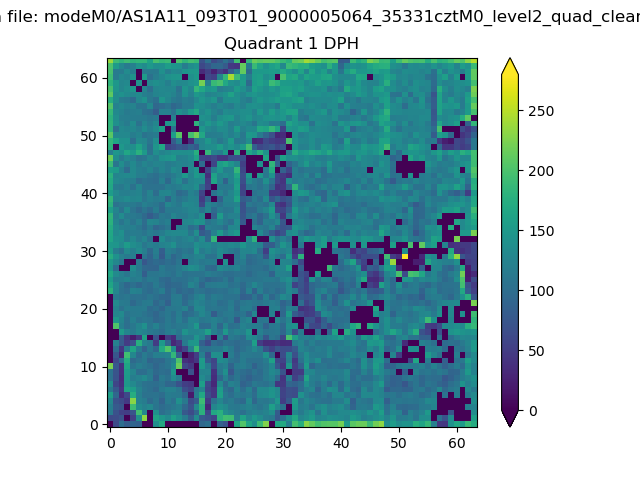 |
Quadrant B |
|---|---|---|---|
| Quadrant D | 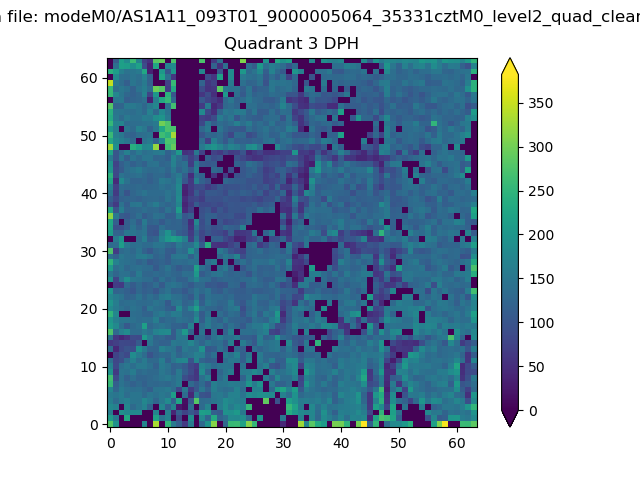 |
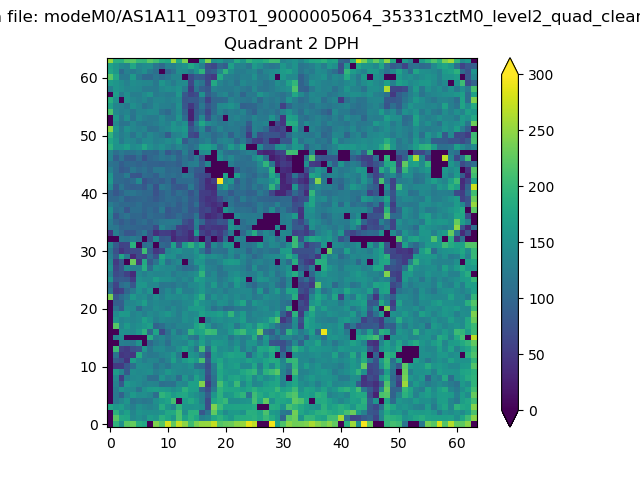 |
Quadrant C |
| Plot type | Count rate plots | Images |
|---|---|---|
| Comparison with Poisson distribution Blue bars denote a histogram of data divided into 1 sec bins. Red curve is a Poisson curve with rate = median count rate of data. |
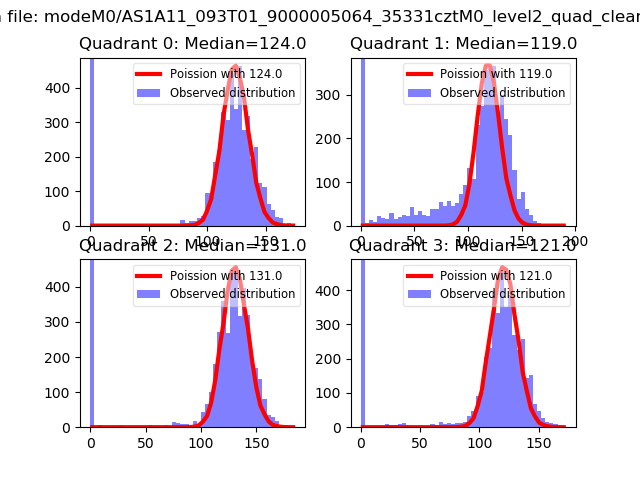 |
 |
| Quadrant-wise count rates Data is divided into 100 sec bins |
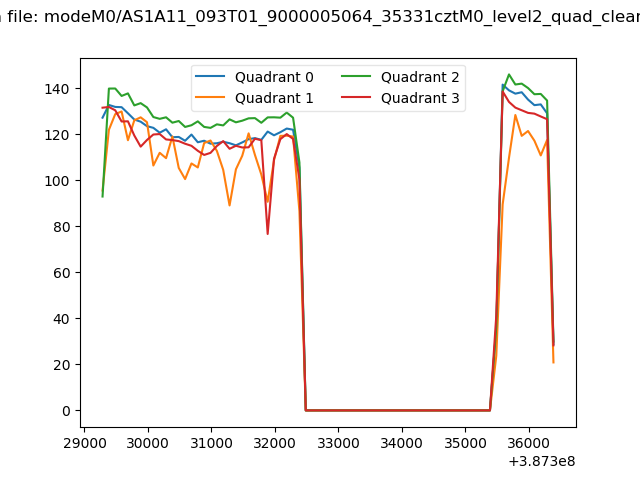 |
|
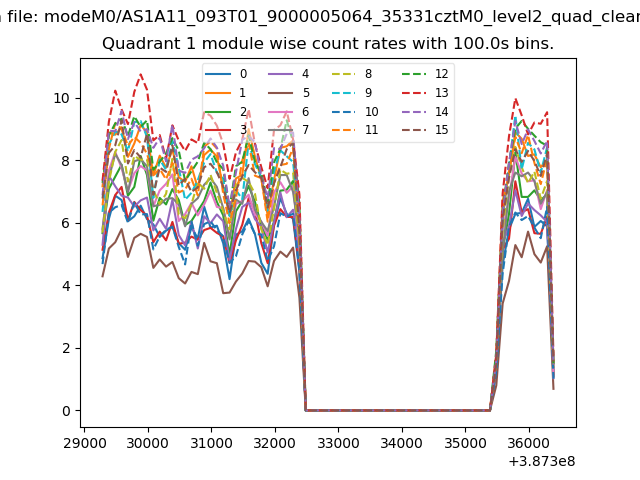
| Module-wise count rates for Quadrant A Data is divided into 100 sec bins |
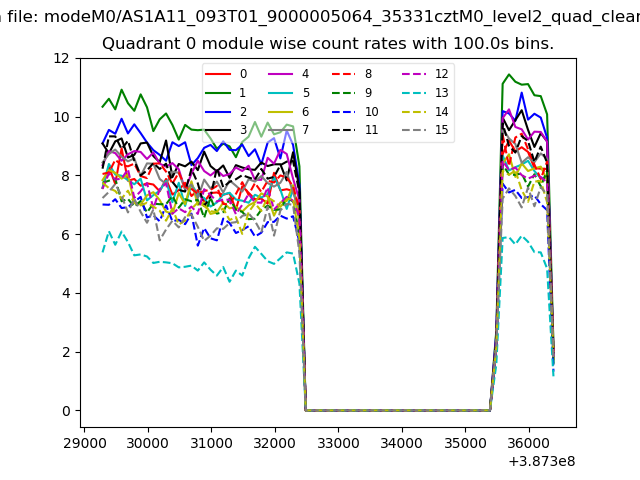 |
 |
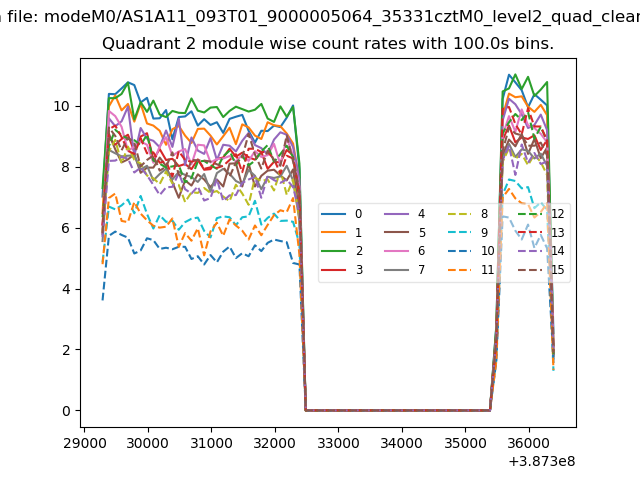
| Module-wise count rates for Quadrant B Data is divided into 100 sec bins |
 |
 |
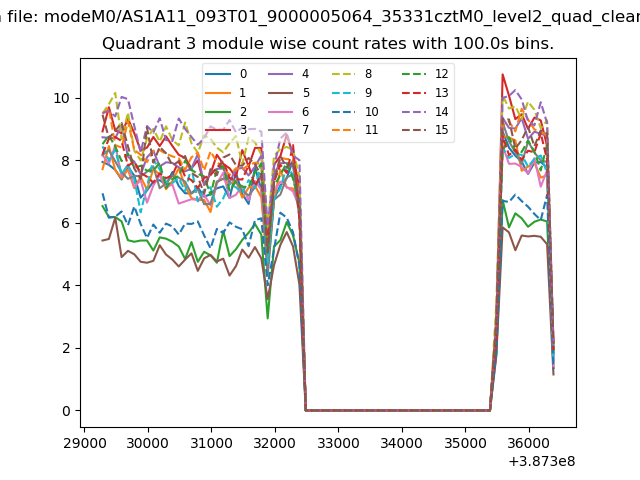
| Module-wise count rates for Quadrant C Data is divided into 100 sec bins |
 |
 |
| Module-wise count rates for Quadrant D Data is divided into 100 sec bins |
 |
 |
| Parameter | Plot |
|---|---|
| CZT HV Monitor | 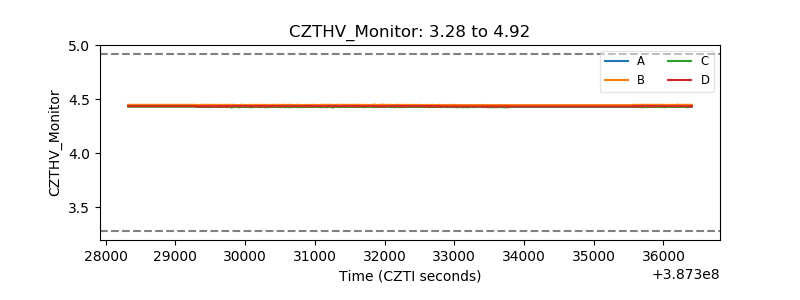 |
| D_VDD | 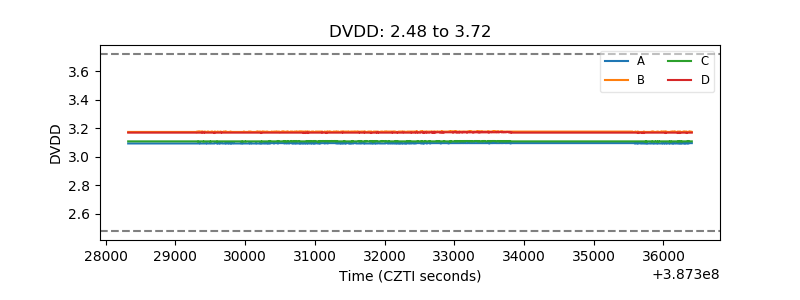 |
| Temperature 1 | 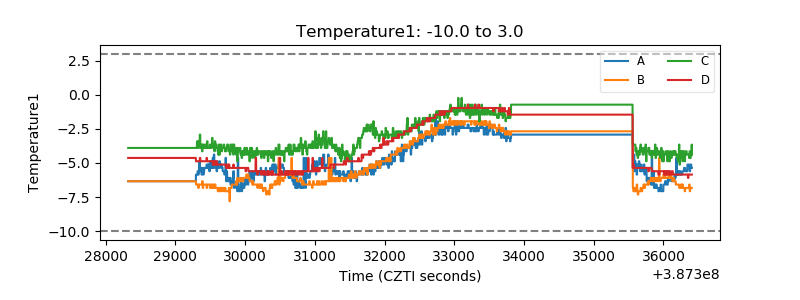 |
| Veto HV Monitor | 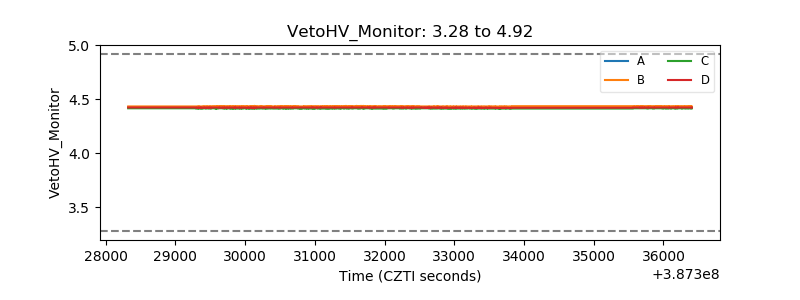 |
| Veto LLD | 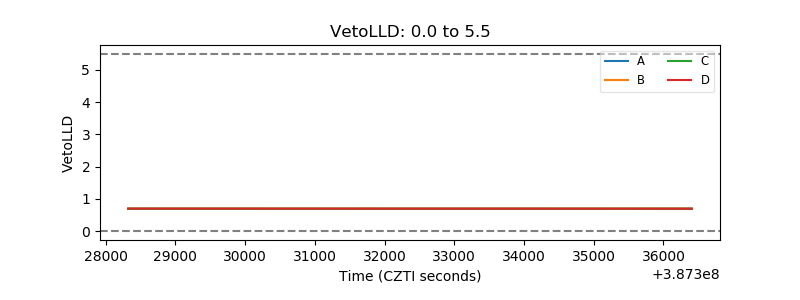 |
| Alpha Counter | 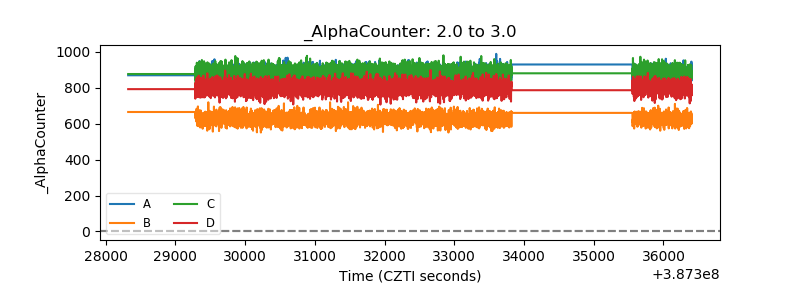 |
| _CPM_Rate | 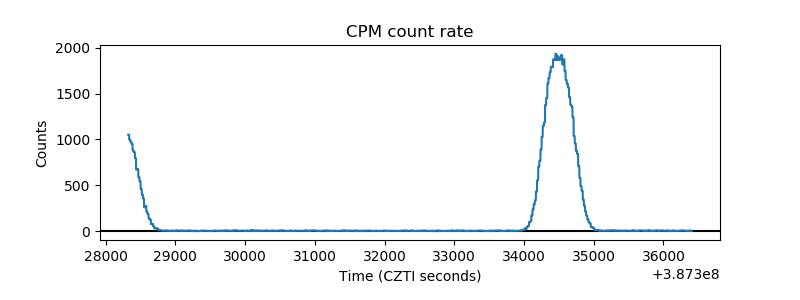 |
| CZT Counter | 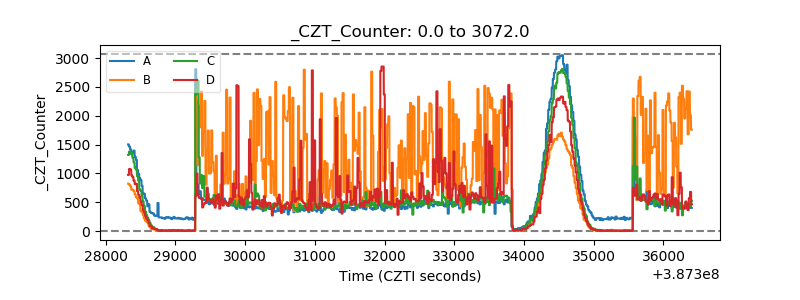 |
| +2.5 Volts monitor | 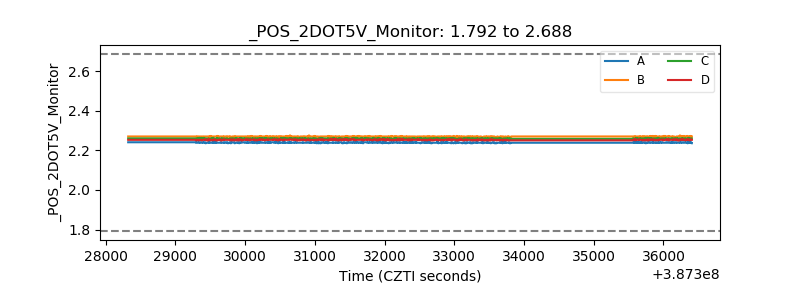 |
| +5 Volts monitor | 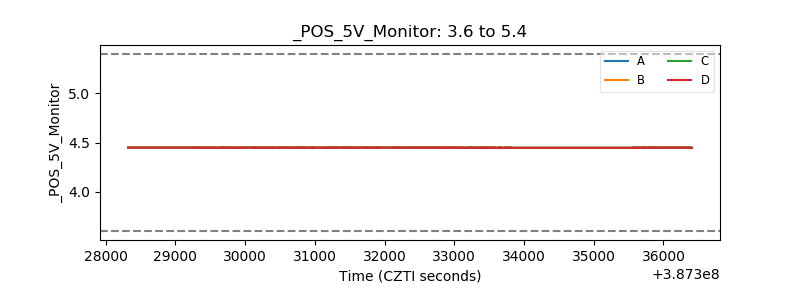 |
| _ROLL_ROT | 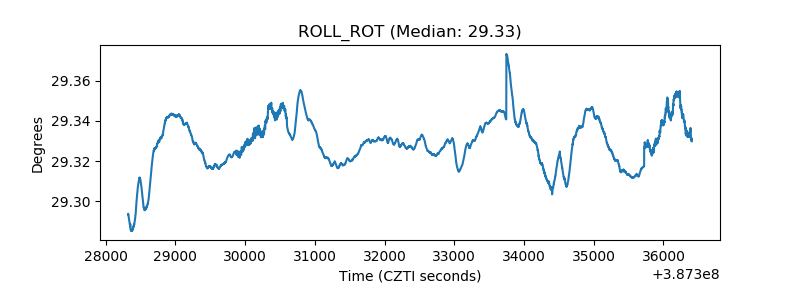 |
| _Roll_DEC | 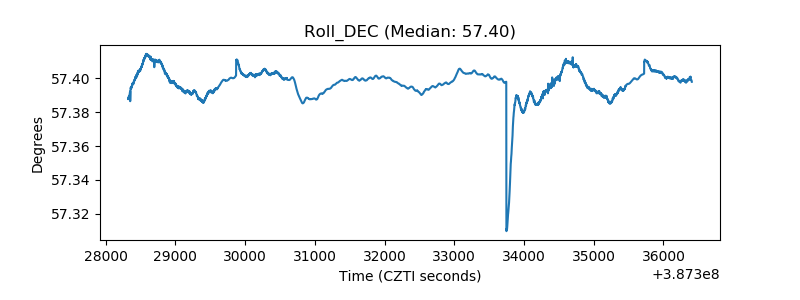 |
| _Roll_RA | 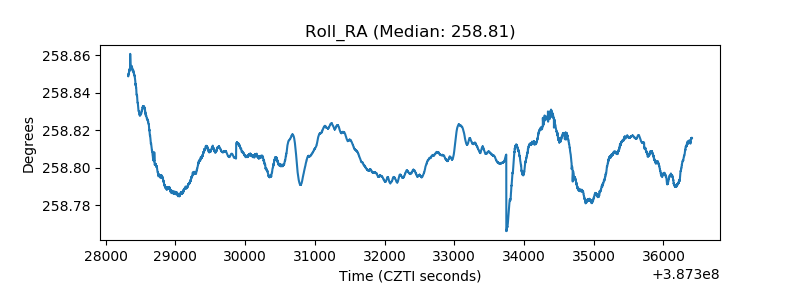 |
| Veto Counter | 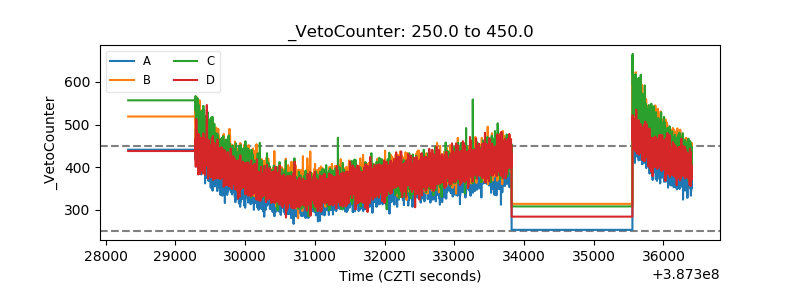 |