| Param | Original file | Final file |
|---|---|---|
| Filename | modeM0/AS1A11_088T02_9000005060_35320cztM0_level2.evt | modeM0/AS1A11_088T02_9000005060_35320cztM0_level2_quad_clean.evt |
| Size (bytes) | 82,690,560 | 3,893,760 |
| Size | 78.9 MB | 3.7 MB |
| Events in quadrant A | 564,514 | 12,981 |
| Events in quadrant B | 647,311 | 13,319 |
| Events in quadrant C | 726,164 | 12,765 |
| Events in quadrant D | 506,394 | 12,167 |
| Mode M0 | |||
|---|---|---|---|
| Quadrant | BADHDUFLAG | Total packets | Discarded packets |
| A | 0 | 2206 | 2 |
| B | 0 | 2474 | 1 |
| C | 0 | 2669 | 1 |
| D | 0 | 2024 | 1 |
| Mode SS | |||
|---|---|---|---|
| Quadrant | BADHDUFLAG | Total packets | Discarded packets |
| A | 0 | 16 | 0 |
| B | 0 | 16 | 0 |
| C | 0 | 16 | 0 |
| D | 0 | 16 | 0 |
| Mode M9 | |||
|---|---|---|---|
| Quadrant | BADHDUFLAG | Total packets | Discarded packets |
| A | 0 | 17 | 0 |
| B | 0 | 17 | 0 |
| C | 0 | 17 | 0 |
| D | 0 | 17 | 0 |
| Quadrant | Total seconds | Saturated seconds | Saturation percentage |
|---|---|---|---|
| A | 841 | 31 | 3.686088% |
| B | 841 | 38 | 4.518430% |
| C | 841 | 105 | 12.485137% |
| D | 841 | 3 | 0.356718% |
Noise dominated data is calculated using 1-second bins in cleaned event files. If a bin has >2000 counts, and if more than 50% of those come from <1% of pixels, then it is considered to be noise-dominated and hence unusable.
| Quadrant | # 1 sec bins | Bins with >0 counts | Bins with >2000 counts | High rate bins dominated by noise | Noise dominated (total time) | Noise dominated (detector-on time) | Marked lightcurve |
|---|---|---|---|---|---|---|---|
| A | 841 | 841 | 27 | 27 | 3.21% | 3.21% | 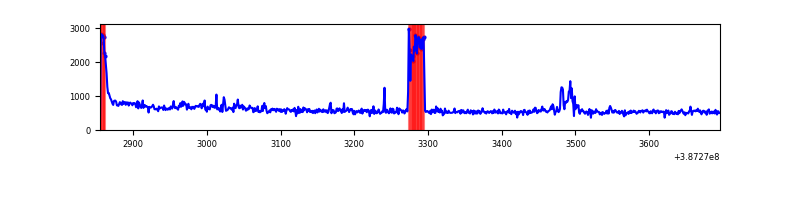 |
| B | 841 | 841 | 17 | 17 | 2.02% | 2.02% | 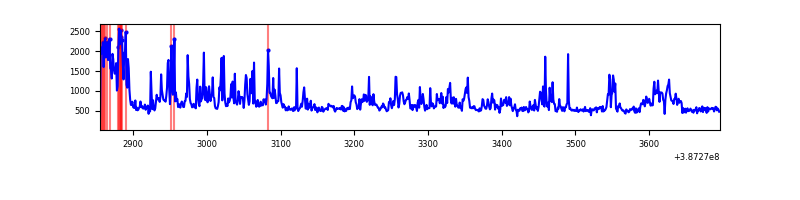 |
| C | 841 | 841 | 103 | 103 | 12.25% | 12.25% | 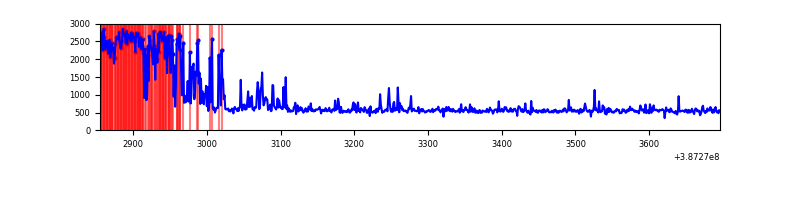 |
| D | 841 | 841 | 2 | 2 | 0.24% | 0.24% | 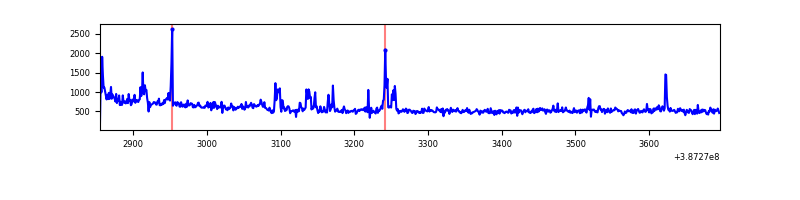 |
Top three noisy pixels from each quadrant. If the there are fewer than three noisy pixels in the level2.evt file, extra rows are filled as -1
| Pixel properties | Quadrant properties | ||||||
|---|---|---|---|---|---|---|---|
| Quadrant | DetID | PixID | Counts | Sigma | Mean | Median | Sigma |
| A | 9 | 143 | 63472 | 2599.44 | 112 | 110 | 24.4 |
| A | 10 | 83 | 35221 | 1440.43 | 112 | 110 | 24.4 |
| A | 8 | 192 | 16835 | 686.15 | 112 | 110 | 24.4 |
| B | 5 | 236 | 153257 | 6553.78 | 111 | 109 | 23.4 |
| B | 5 | 172 | 35510 | 1514.94 | 111 | 109 | 23.4 |
| B | 4 | 232 | 15902 | 675.84 | 111 | 109 | 23.4 |
| C | 0 | 10 | 290307 | 11712.47 | 100 | 100 | 24.8 |
| C | 15 | 214 | 37351 | 1503.41 | 100 | 100 | 24.8 |
| C | 15 | 159 | 3861 | 151.79 | 100 | 100 | 24.8 |
| D | 2 | 249 | 30088 | 1087.3 | 107 | 104 | 27.6 |
| D | 12 | 128 | 28962 | 1046.46 | 107 | 104 | 27.6 |
| D | 8 | 195 | 18415 | 664.0 | 107 | 104 | 27.6 |
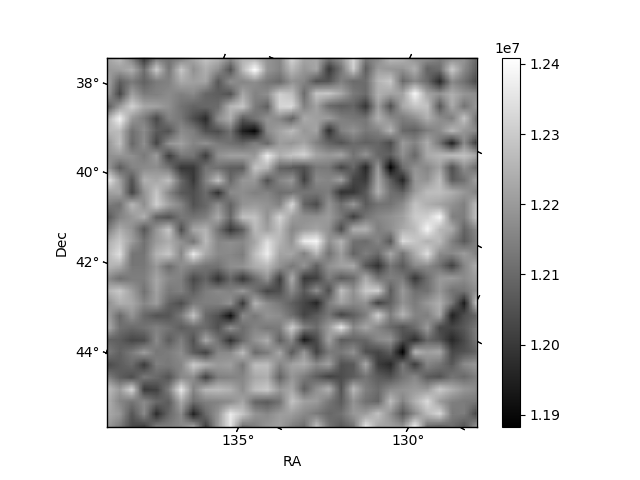
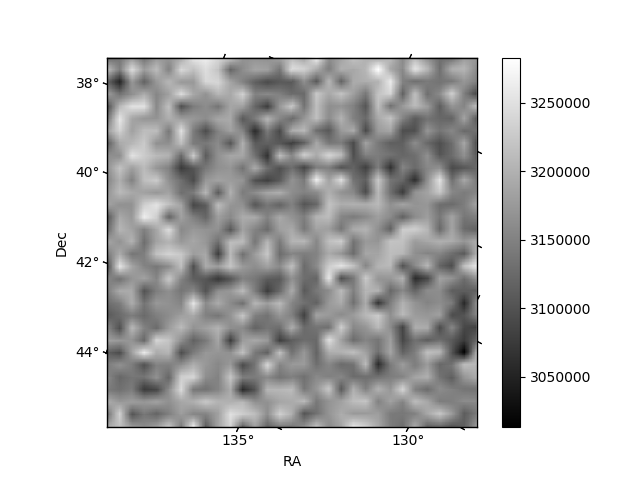
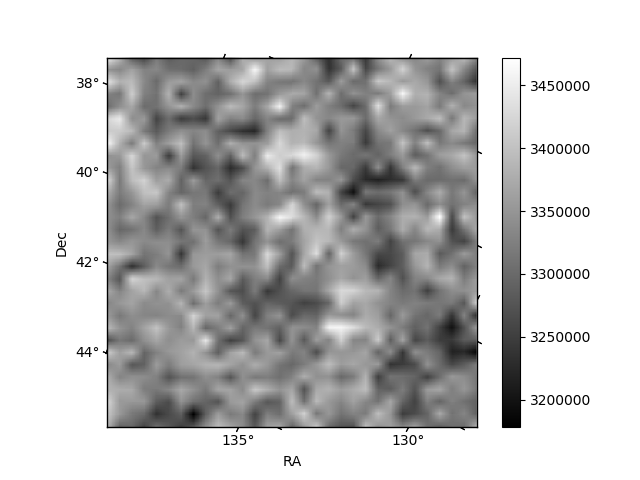
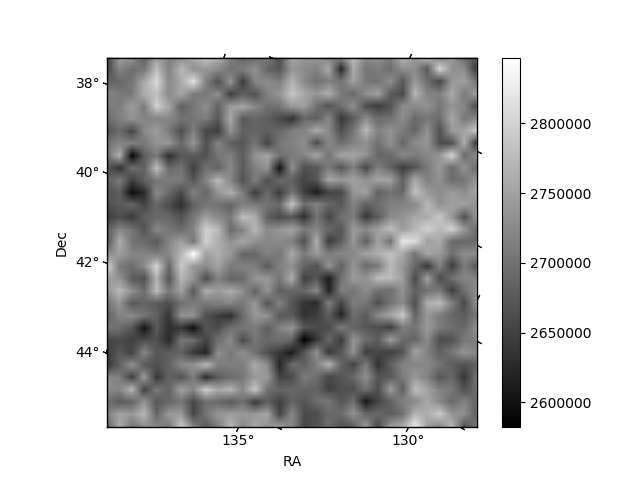
Histogram calculated using DETX and DETY for each event in the final _common_clean file
| Quadrant A | 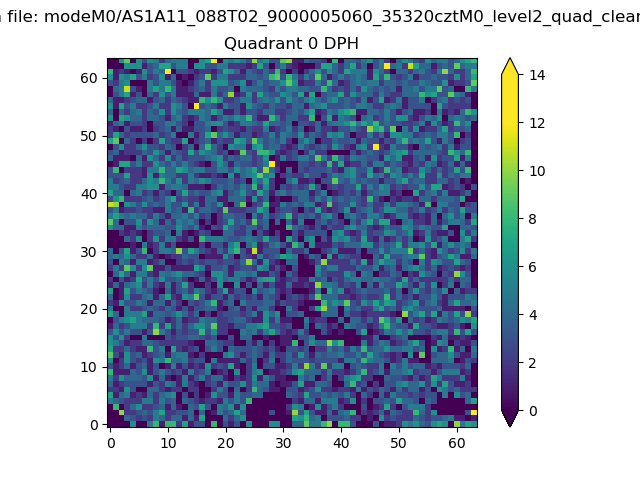 |
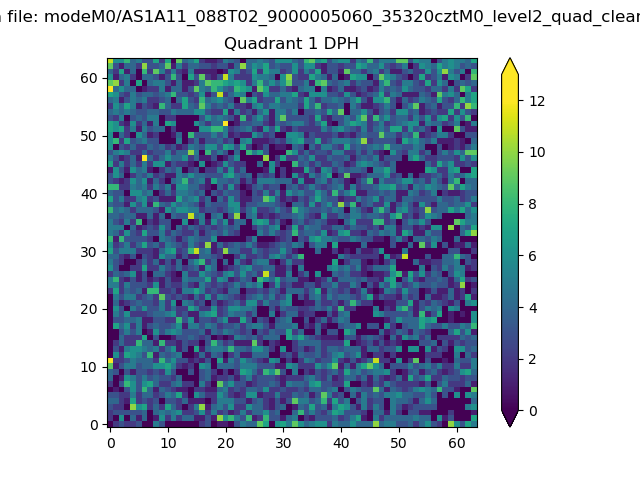 |
Quadrant B |
|---|---|---|---|
| Quadrant D | 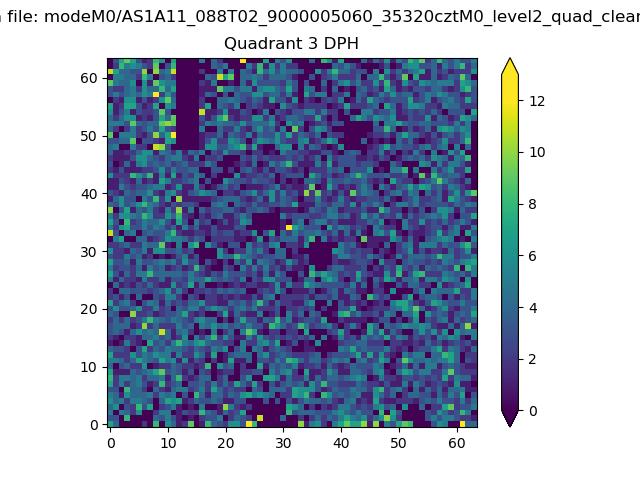 |
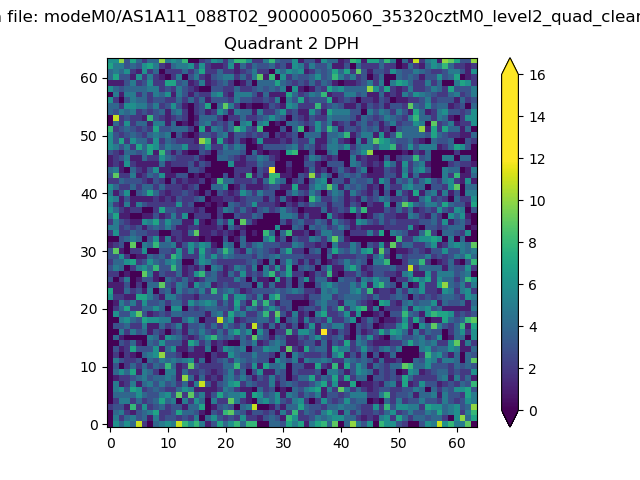 |
Quadrant C |
| Plot type | Count rate plots | Images |
|---|---|---|
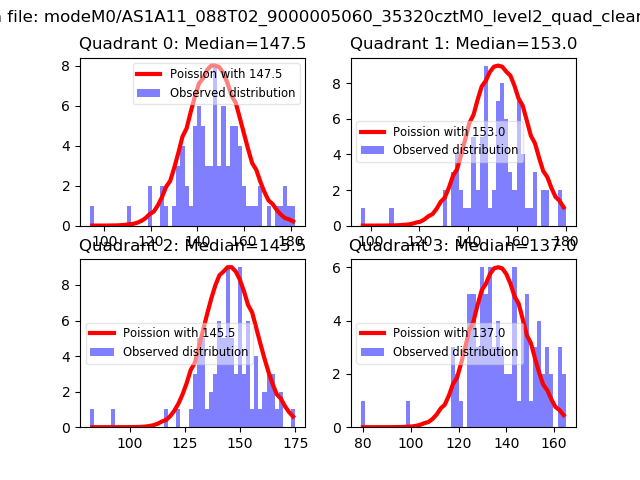
| Comparison with Poisson distribution Blue bars denote a histogram of data divided into 1 sec bins. Red curve is a Poisson curve with rate = median count rate of data. |
 |
 |
| Quadrant-wise count rates Data is divided into 100 sec bins |
 |
|
| Module-wise count rates for Quadrant A Data is divided into 100 sec bins |
 |
 |
| Module-wise count rates for Quadrant B Data is divided into 100 sec bins |
 |
 |
| Module-wise count rates for Quadrant C Data is divided into 100 sec bins |
 |
 |
| Module-wise count rates for Quadrant D Data is divided into 100 sec bins |
 |
 |
| Parameter | Plot |
|---|---|
| CZT HV Monitor | 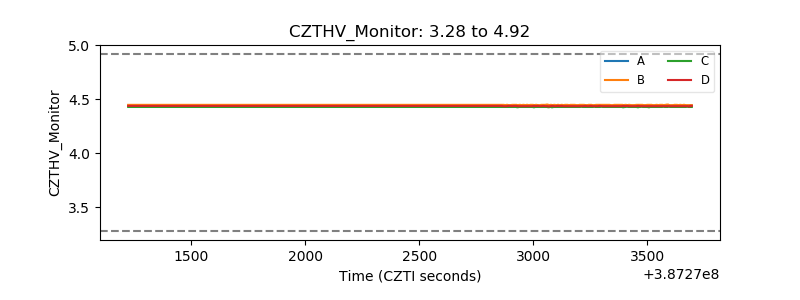 |
| D_VDD | 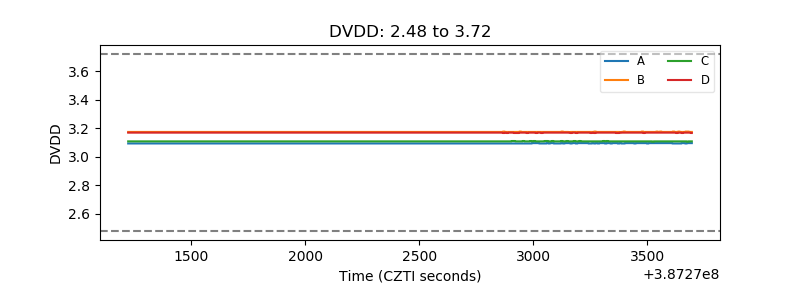 |
| Temperature 1 | 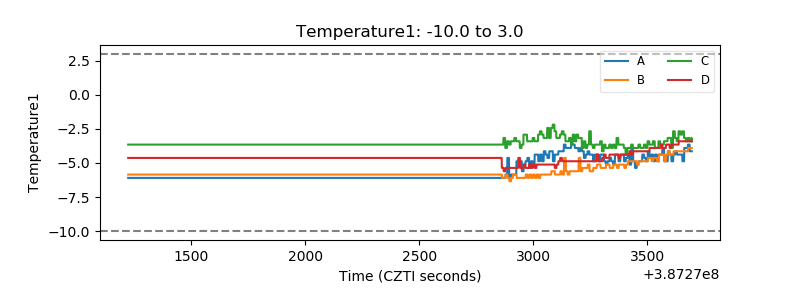 |
| Veto HV Monitor | 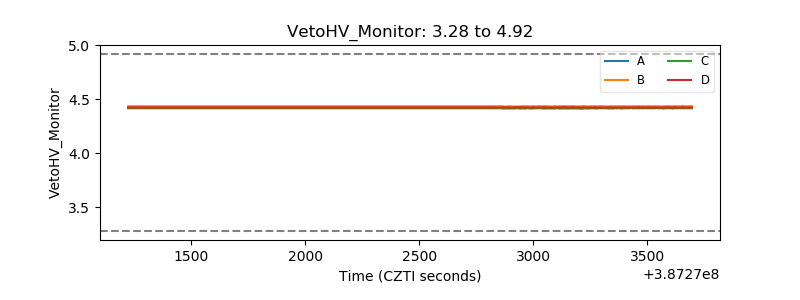 |
| Veto LLD | 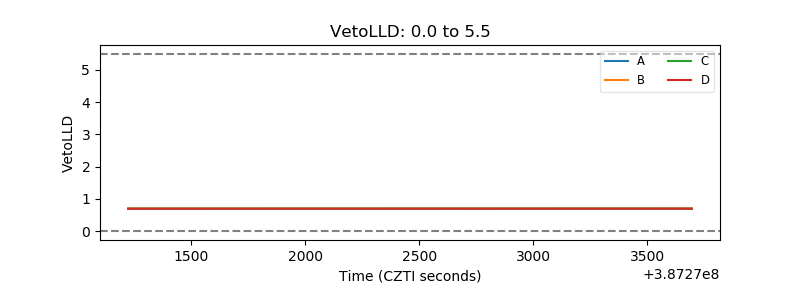 |
| Alpha Counter | 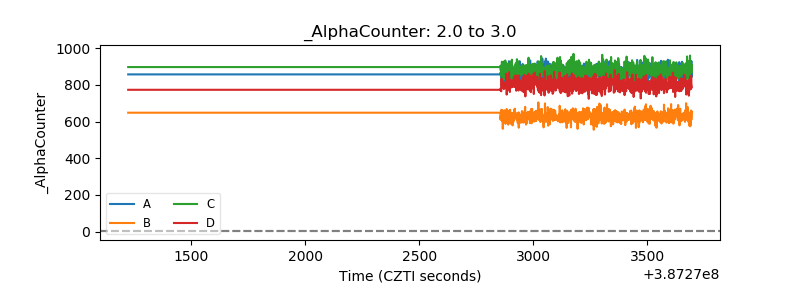 |
| _CPM_Rate | 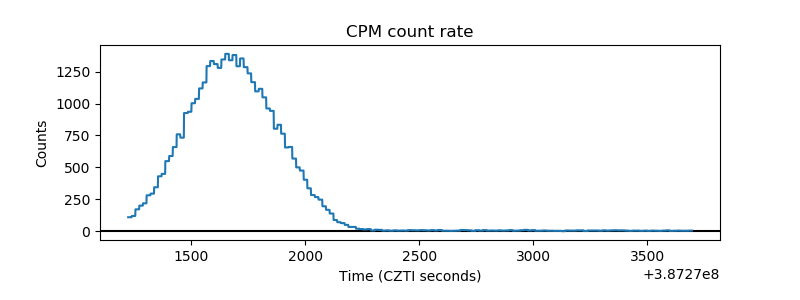 |
| CZT Counter | 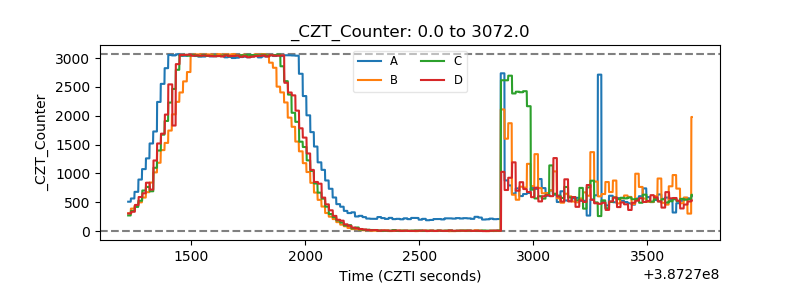 |
| +2.5 Volts monitor | 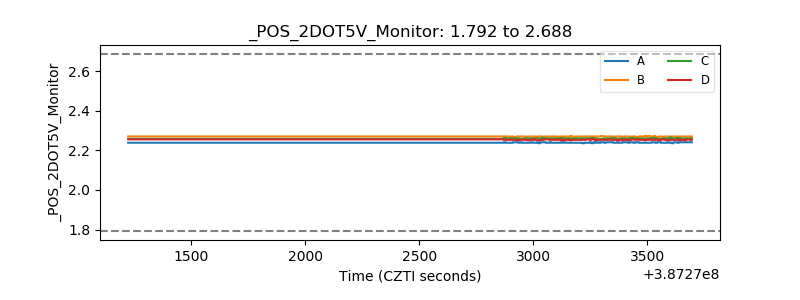 |
| +5 Volts monitor | 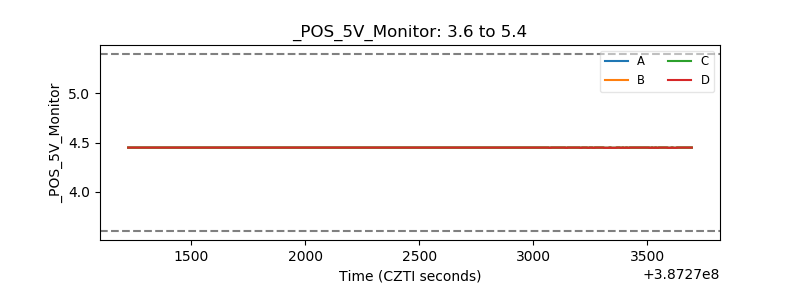 |
| _ROLL_ROT | 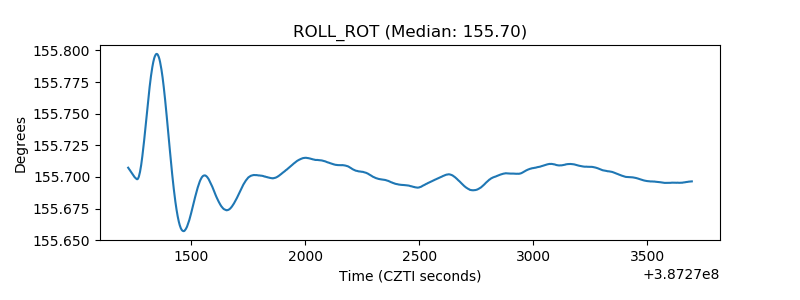 |
| _Roll_DEC | 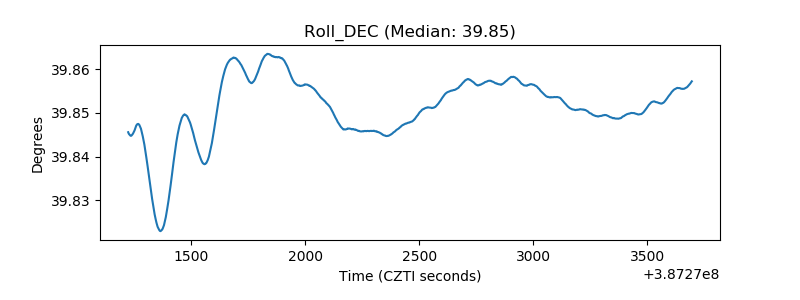 |
| _Roll_RA | 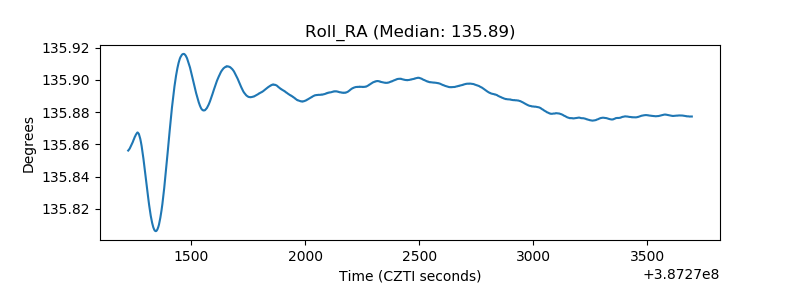 |
| Veto Counter | 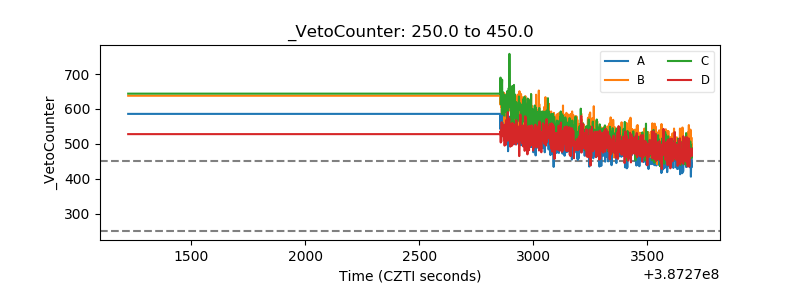 |