| Param | Original file | Final file |
|---|---|---|
| Filename | modeM0/AS1A11_088T02_9000005060cztM0_level2_bc.evt | modeM0/AS1A11_088T02_9000005060cztM0_level2_quad_clean.evt |
| Size (bytes) | 47,171,520 | 3,890,880 |
| Size | 45.0 MB | 3.7 MB |
| Events in quadrant A | 315,995 | 12,981 |
| Events in quadrant B | 355,763 | 13,319 |
| Events in quadrant C | 407,854 | 12,765 |
| Events in quadrant D | 283,710 | 12,167 |
| Mode M0 | |||
|---|---|---|---|
| Quadrant | BADHDUFLAG | Total packets | Discarded packets |
| A | 0 | 2204 | 0 |
| B | 0 | 2473 | 0 |
| C | 0 | 2668 | 0 |
| D | 0 | 2023 | 0 |
| Mode SS | |||
|---|---|---|---|
| Quadrant | BADHDUFLAG | Total packets | Discarded packets |
| A | 0 | 16 | 0 |
| B | 0 | 16 | 0 |
| C | 0 | 16 | 0 |
| D | 0 | 16 | 0 |
| Mode M9 | |||
|---|---|---|---|
| Quadrant | BADHDUFLAG | Total packets | Discarded packets |
| A | 0 | 17 | 0 |
| B | 0 | 17 | 0 |
| C | 0 | 17 | 0 |
| D | 0 | 17 | 0 |
| Quadrant | Total seconds | Saturated seconds | Saturation percentage |
|---|---|---|---|
| A | 841 | 31 | 3.686088% |
| B | 841 | 38 | 4.518430% |
| C | 841 | 105 | 12.485137% |
| D | 841 | 3 | 0.356718% |
Noise dominated data is calculated using 1-second bins in cleaned event files. If a bin has >2000 counts, and if more than 50% of those come from <1% of pixels, then it is considered to be noise-dominated and hence unusable.
| Quadrant | # 1 sec bins | Bins with >0 counts | Bins with >2000 counts | High rate bins dominated by noise | Noise dominated (total time) | Noise dominated (detector-on time) | Marked lightcurve |
|---|---|---|---|---|---|---|---|
| A | 841 | 841 | 13 | 13 | 1.55% | 1.55% | 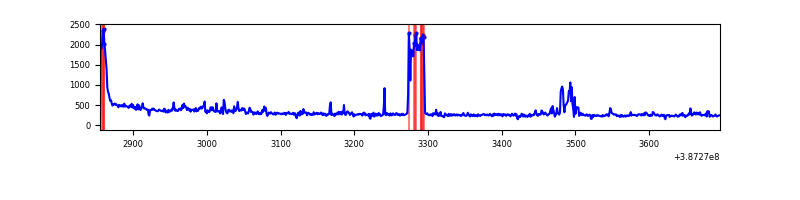 |
| B | 840 | 840 | 0 | 0 | 0.00% | 0.00% | 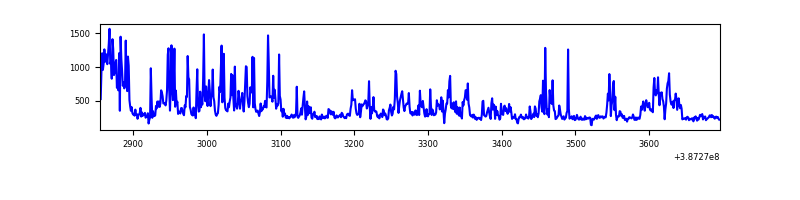 |
| C | 840 | 840 | 12 | 12 | 1.43% | 1.43% | 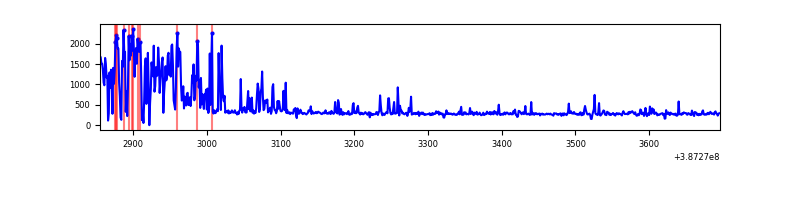 |
| D | 840 | 840 | 1 | 1 | 0.12% | 0.12% | 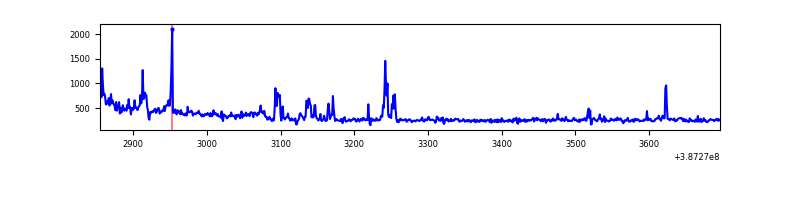 |
Top three noisy pixels from each quadrant. If the there are fewer than three noisy pixels in the level2.evt file, extra rows are filled as -1
| Pixel properties | Quadrant properties | ||||||
|---|---|---|---|---|---|---|---|
| Quadrant | DetID | PixID | Counts | Sigma | Mean | Median | Sigma |
| A | 9 | 143 | 55605 | 4315.05 | 51 | 50 | 12.9 |
| A | 10 | 83 | 33840 | 2624.52 | 51 | 50 | 12.9 |
| A | 8 | 192 | 14282 | 1105.42 | 51 | 50 | 12.9 |
| B | 5 | 236 | 119707 | 9929.68 | 51 | 50 | 12.1 |
| B | 5 | 172 | 22507 | 1863.58 | 51 | 50 | 12.1 |
| B | 4 | 232 | 11044 | 912.33 | 51 | 50 | 12.1 |
| C | 0 | 10 | 185886 | 15283.01 | 46 | 45 | 12.2 |
| C | 15 | 214 | 35385 | 2906.26 | 46 | 45 | 12.2 |
| C | 15 | 159 | 3614 | 293.5 | 46 | 45 | 12.2 |
| D | 12 | 128 | 28049 | 2062.91 | 50 | 48 | 13.6 |
| D | 2 | 249 | 25203 | 1853.24 | 50 | 48 | 13.6 |
| D | 8 | 195 | 17851 | 1311.59 | 50 | 48 | 13.6 |
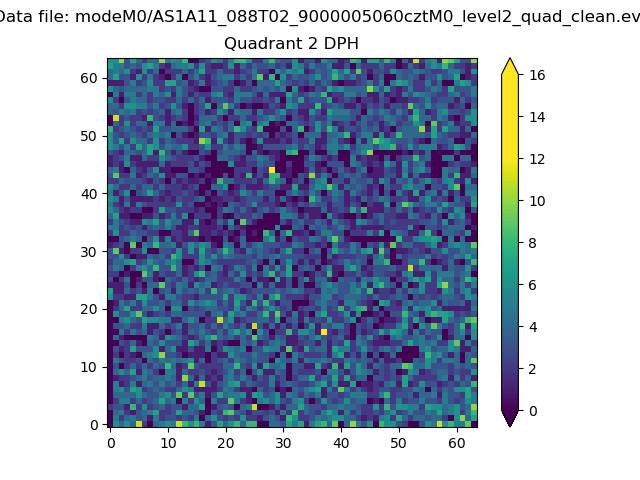
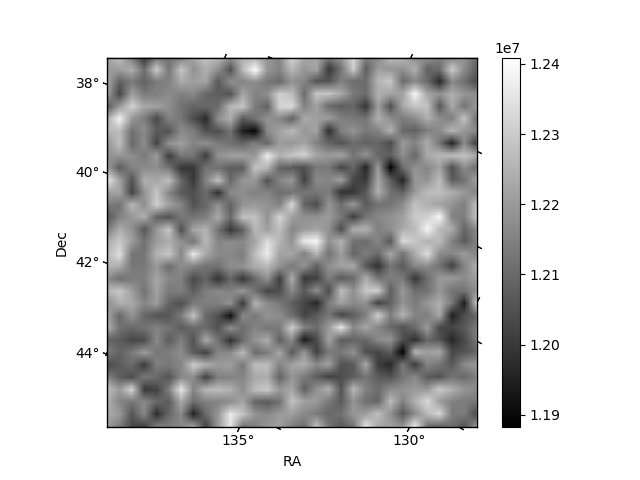
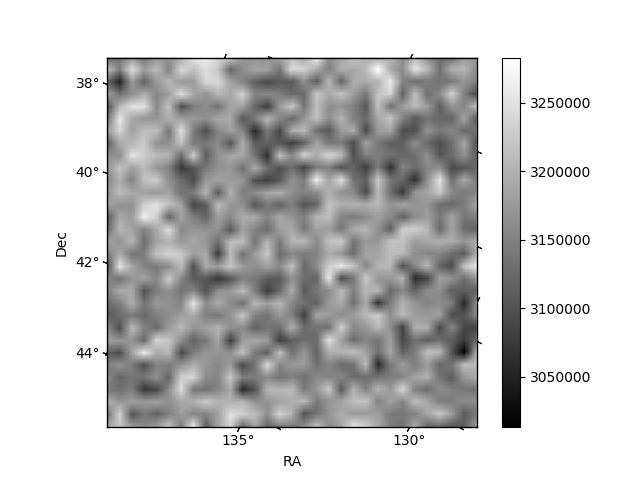
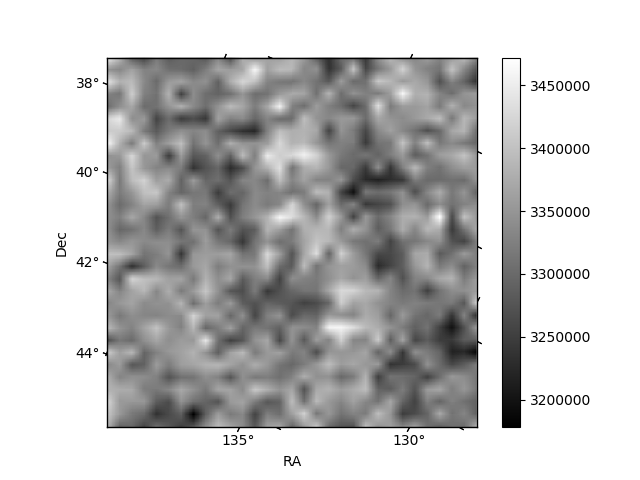
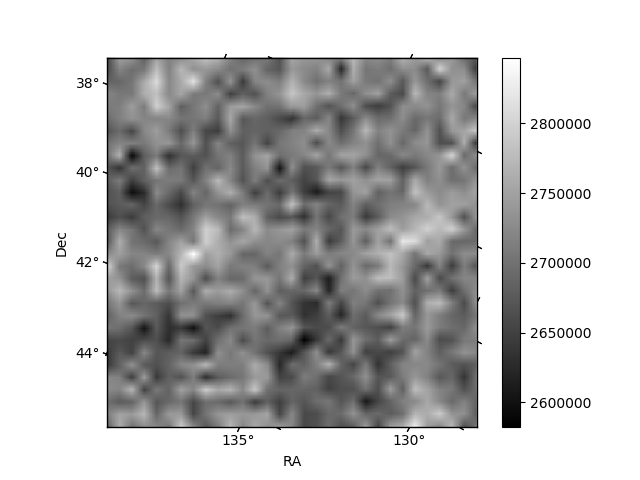
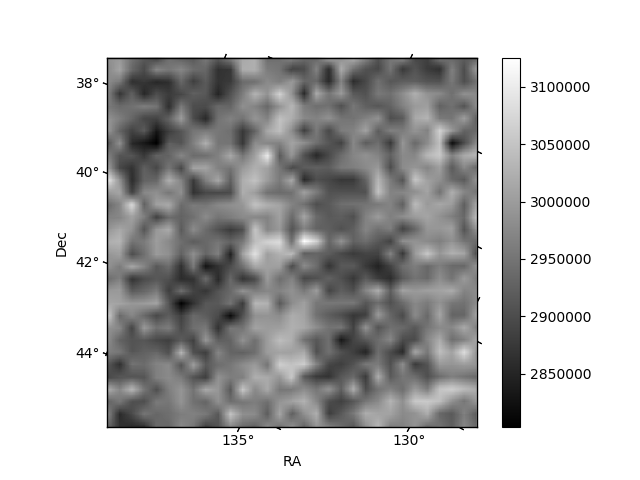
Histogram calculated using DETX and DETY for each event in the final _common_clean file
| Quadrant A | 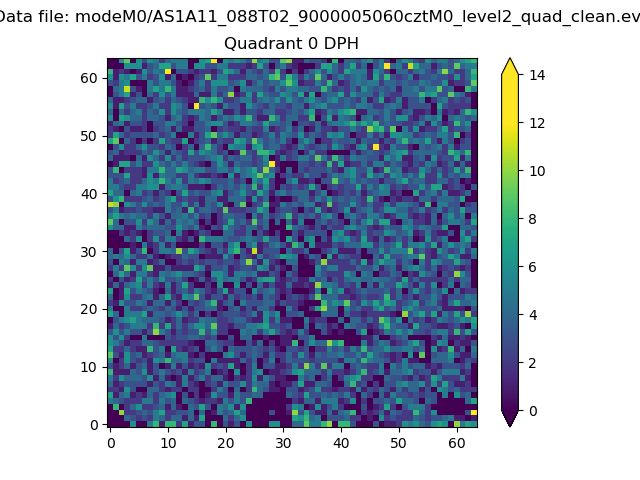 |
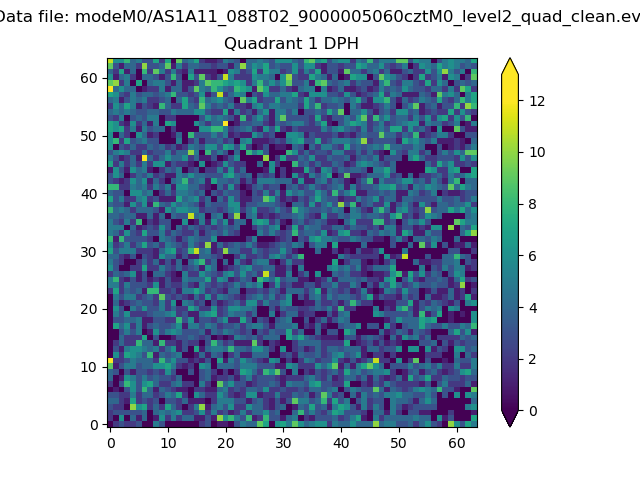 |
Quadrant B |
|---|---|---|---|
| Quadrant D | 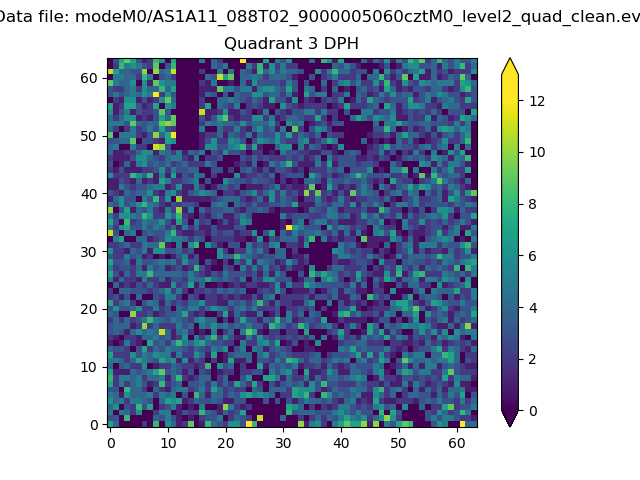 |
 |
Quadrant C |
| Plot type | Count rate plots | Images |
|---|---|---|
| Comparison with Poisson distribution Blue bars denote a histogram of data divided into 1 sec bins. Red curve is a Poisson curve with rate = median count rate of data. |
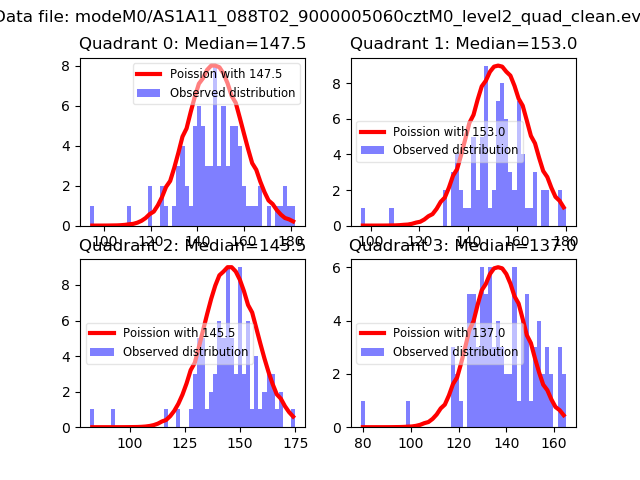 |
 |
| Quadrant-wise count rates Data is divided into 100 sec bins |
 |
|
| Module-wise count rates for Quadrant A Data is divided into 100 sec bins |
 |
 |
| Module-wise count rates for Quadrant B Data is divided into 100 sec bins |
 |
 |
| Module-wise count rates for Quadrant C Data is divided into 100 sec bins |
 |
 |
| Module-wise count rates for Quadrant D Data is divided into 100 sec bins |
 |
 |
| Parameter | Plot |
|---|---|
| CZT HV Monitor | 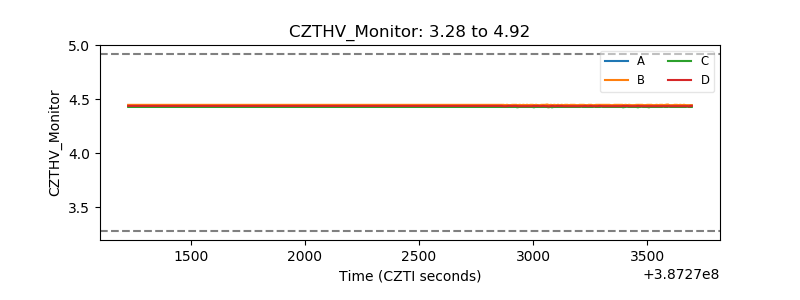 |
| D_VDD | 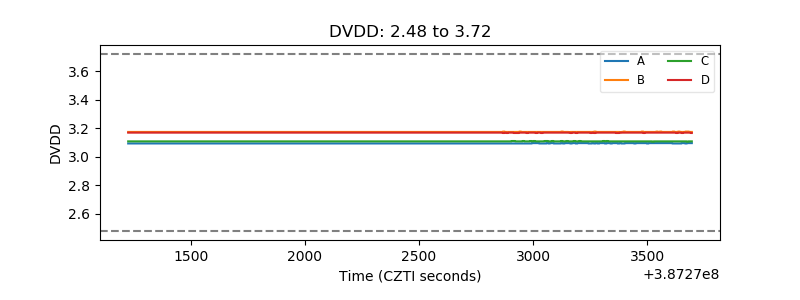 |
| Temperature 1 | 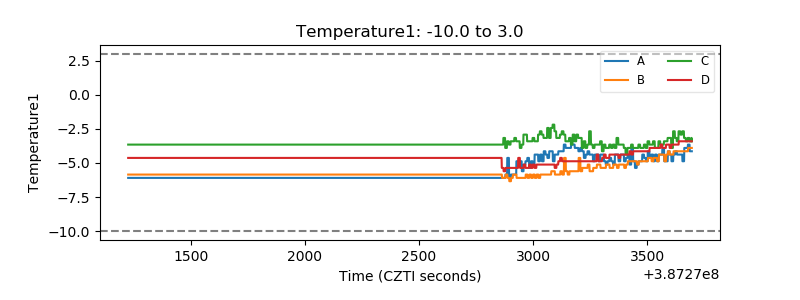 |
| Veto HV Monitor | 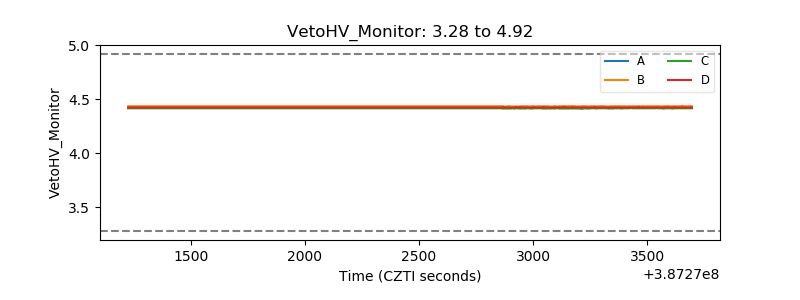 |
| Veto LLD | 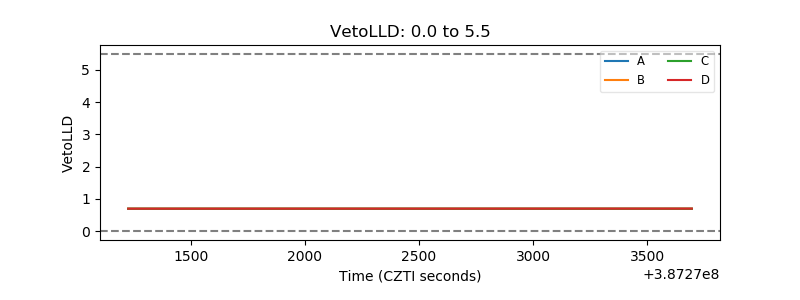 |
| Alpha Counter | 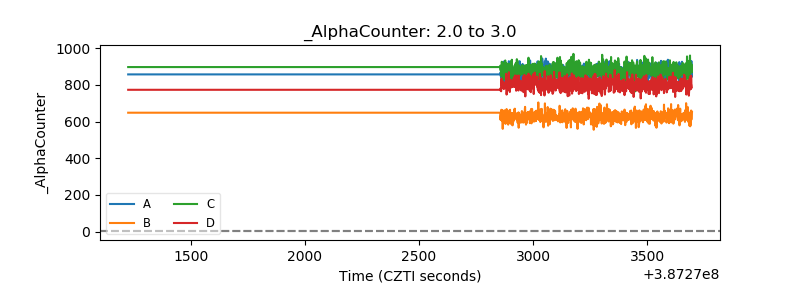 |
| _CPM_Rate | 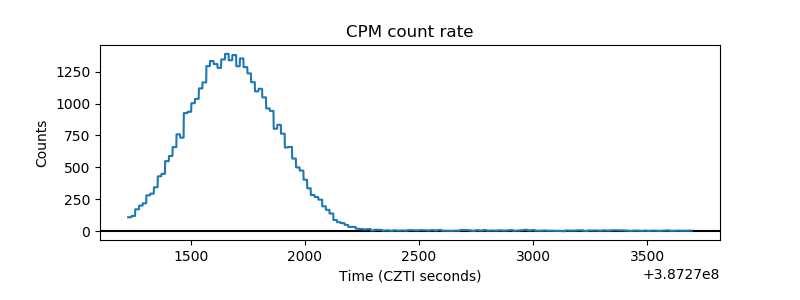 |
| CZT Counter | 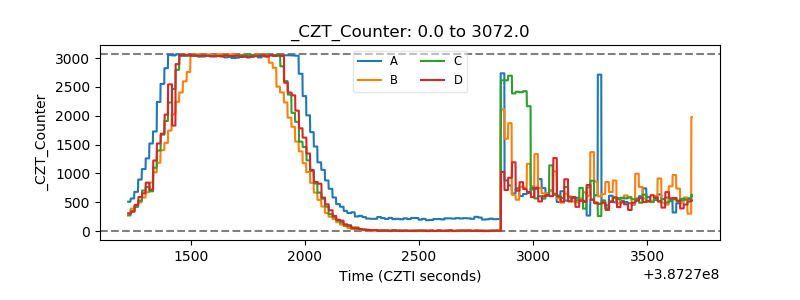 |
| +2.5 Volts monitor | 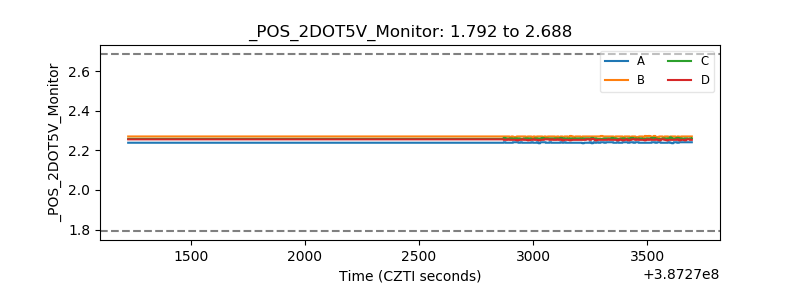 |
| +5 Volts monitor | 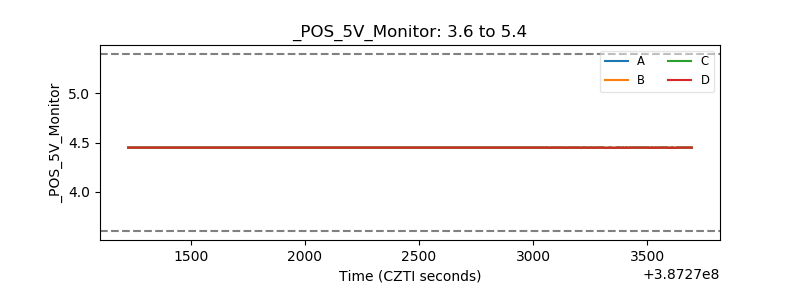 |
| _ROLL_ROT | 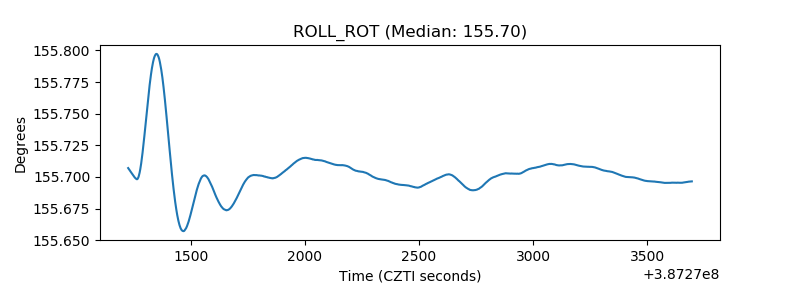 |
| _Roll_DEC | 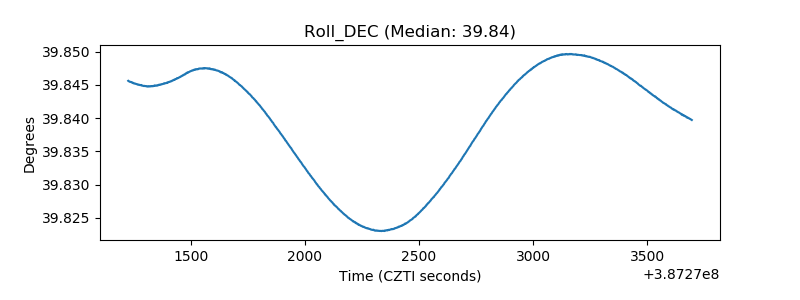 |
| _Roll_RA | 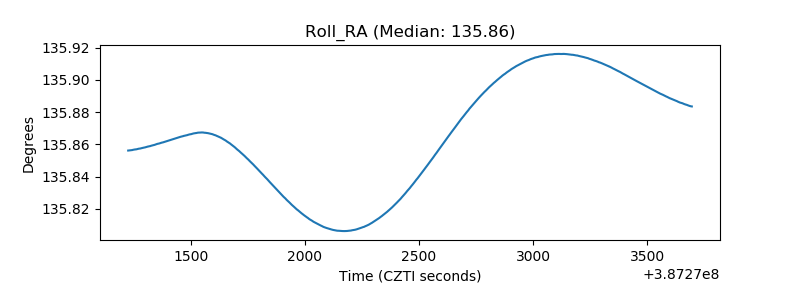 |
| Veto Counter | 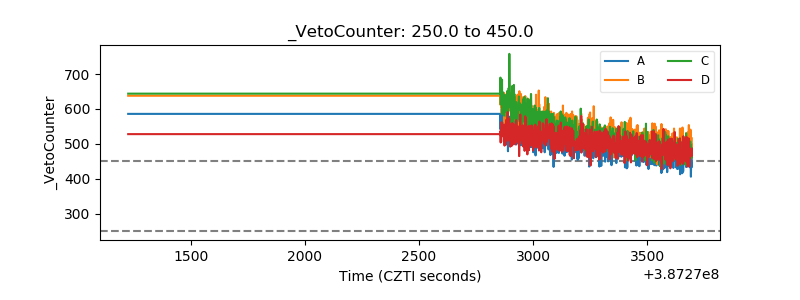 |