| Param | Original file | Final file |
|---|---|---|
| Filename | modeM0/AS1A11_046T08_9000005062cztM0_level2_bc.evt | modeM0/AS1A11_046T08_9000005062cztM0_level2_quad_clean.evt |
| Size (bytes) | 2,213,464,320 | 322,220,160 |
| Size | 2.1 GB | 307.3 MB |
| Events in quadrant A | 33,230,445 | 1,325,557 |
| Events in quadrant B | 16,805,828 | 2,062,582 |
| Events in quadrant C | 7,699,058 | 2,535,507 |
| Events in quadrant D | 7,915,983 | 2,425,567 |
| Mode SS | |||
|---|---|---|---|
| Quadrant | BADHDUFLAG | Total packets | Discarded packets |
| A | 0 | 412 | 0 |
| B | 0 | 412 | 0 |
| C | 0 | 412 | 0 |
| D | 0 | 412 | 0 |
| Mode M0 | |||
|---|---|---|---|
| Quadrant | BADHDUFLAG | Total packets | Discarded packets |
| A | 0 | 155948 | 0 |
| B | 0 | 104612 | 0 |
| C | 0 | 52298 | 0 |
| D | 0 | 54228 | 0 |
| Mode M9 | |||
|---|---|---|---|
| Quadrant | BADHDUFLAG | Total packets | Discarded packets |
| A | 0 | 67 | 0 |
| B | 0 | 67 | 0 |
| C | 0 | 67 | 0 |
| D | 0 | 68 | 0 |
| Quadrant | Total seconds | Saturated seconds | Saturation percentage |
|---|---|---|---|
| A | 20315 | 17342 | 85.365493% |
| B | 20315 | 8278 | 40.748216% |
| C | 20315 | 584 | 2.874723% |
| D | 20315 | 755 | 3.716466% |
Noise dominated data is calculated using 1-second bins in cleaned event files. If a bin has >2000 counts, and if more than 50% of those come from <1% of pixels, then it is considered to be noise-dominated and hence unusable.
| Quadrant | # 1 sec bins | Bins with >0 counts | Bins with >2000 counts | High rate bins dominated by noise | Noise dominated (total time) | Noise dominated (detector-on time) | Marked lightcurve |
|---|---|---|---|---|---|---|---|
| A | 26855 | 20276 | 3202 | 3202 | 11.92% | 15.79% | 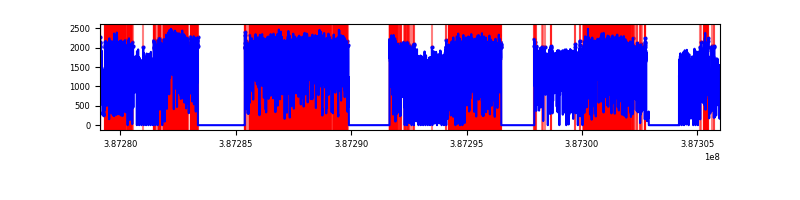 |
| B | 26854 | 20291 | 67 | 67 | 0.25% | 0.33% | 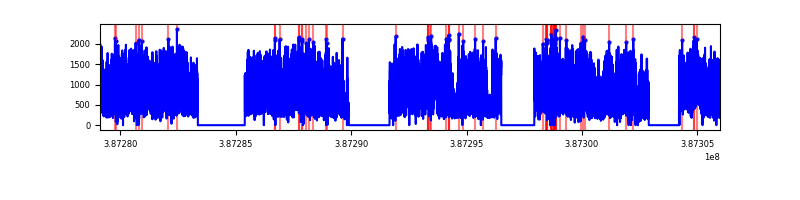 |
| C | 26854 | 20312 | 93 | 93 | 0.35% | 0.46% | 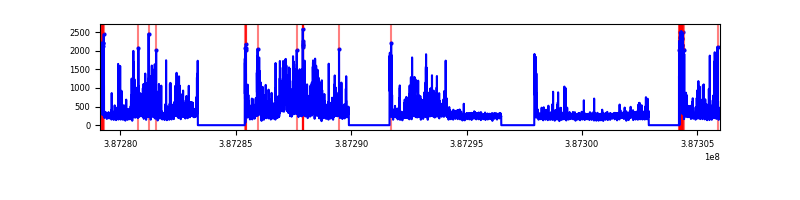 |
| D | 26853 | 20312 | 33 | 33 | 0.12% | 0.16% | 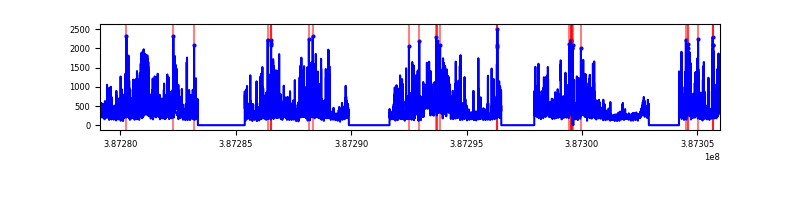 |
Top three noisy pixels from each quadrant. If the there are fewer than three noisy pixels in the level2.evt file, extra rows are filled as -1
| Pixel properties | Quadrant properties | ||||||
|---|---|---|---|---|---|---|---|
| Quadrant | DetID | PixID | Counts | Sigma | Mean | Median | Sigma |
| A | 15 | 169 | 30642358 | 234360.87 | 575 | 568 | 130.7 |
| A | 10 | 83 | 184691 | 1408.25 | 575 | 568 | 130.7 |
| A | 8 | 192 | 47841 | 361.56 | 575 | 568 | 130.7 |
| B | 5 | 236 | 8921352 | 52402.61 | 836 | 819 | 170.2 |
| B | 5 | 172 | 3966718 | 23297.2 | 836 | 819 | 170.2 |
| B | 5 | 200 | 339181 | 1987.67 | 836 | 819 | 170.2 |
| C | 0 | 10 | 1481149 | 6409.72 | 999 | 993 | 230.9 |
| C | 3 | 233 | 1478357 | 6397.62 | 999 | 993 | 230.9 |
| C | 15 | 214 | 789788 | 3415.82 | 999 | 993 | 230.9 |
| D | 8 | 195 | 846221 | 3513.63 | 1008 | 980 | 240.6 |
| D | 10 | 118 | 716605 | 2974.82 | 1008 | 980 | 240.6 |
| D | 12 | 233 | 598730 | 2484.82 | 1008 | 980 | 240.6 |
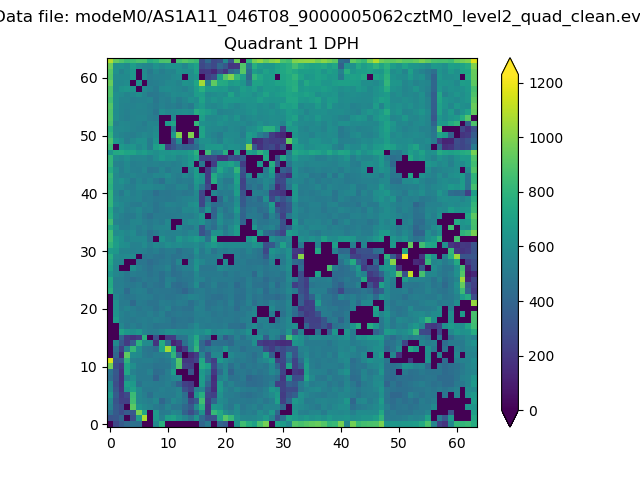
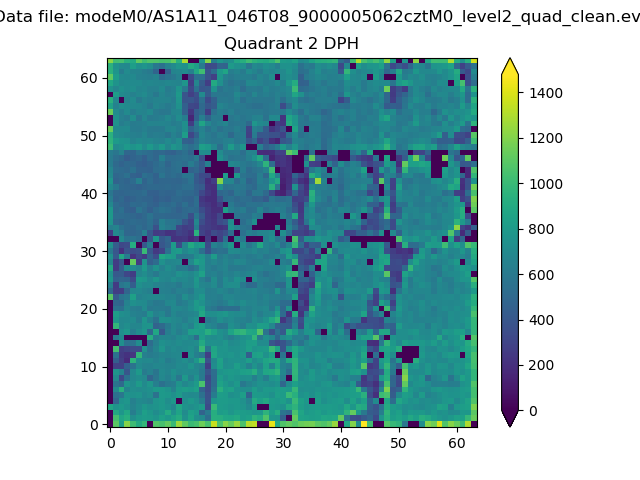
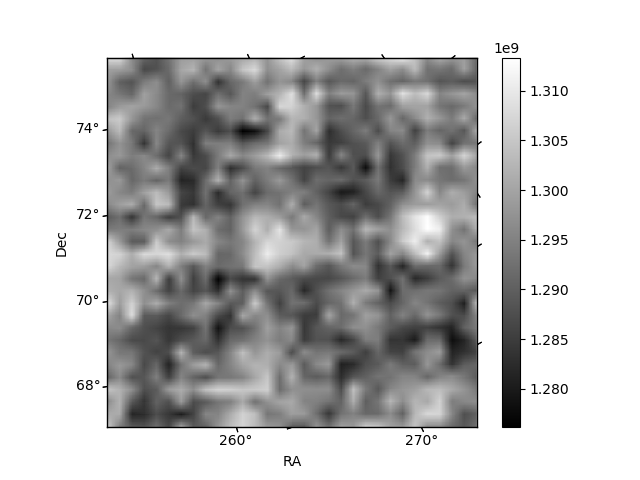
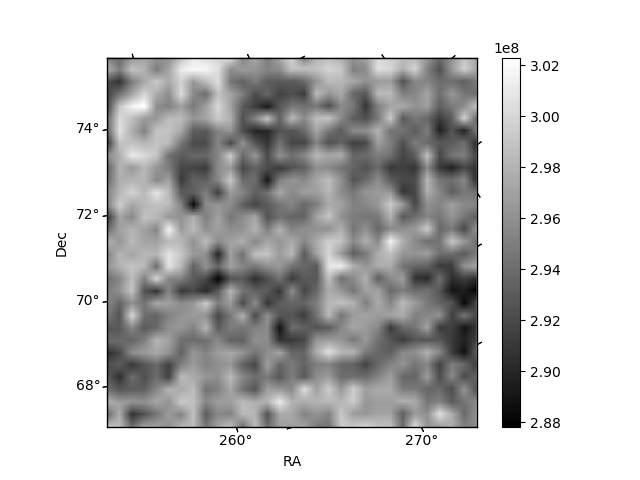
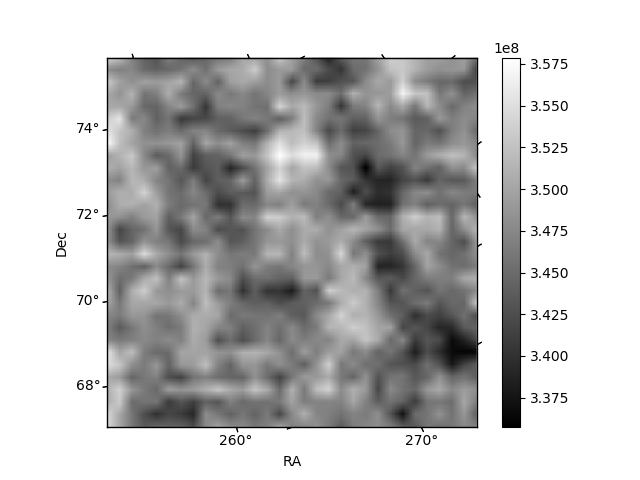
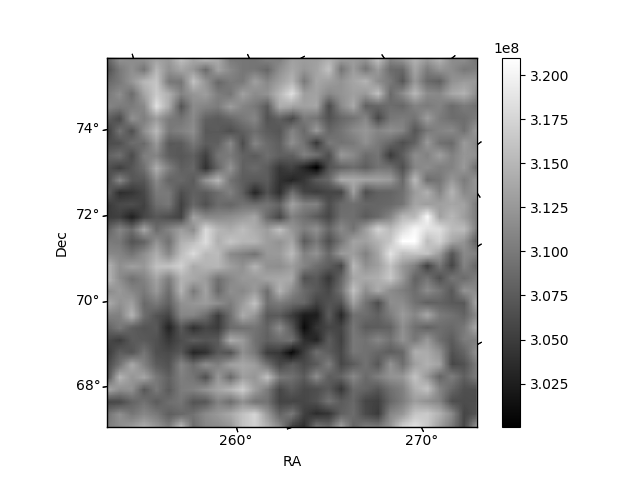
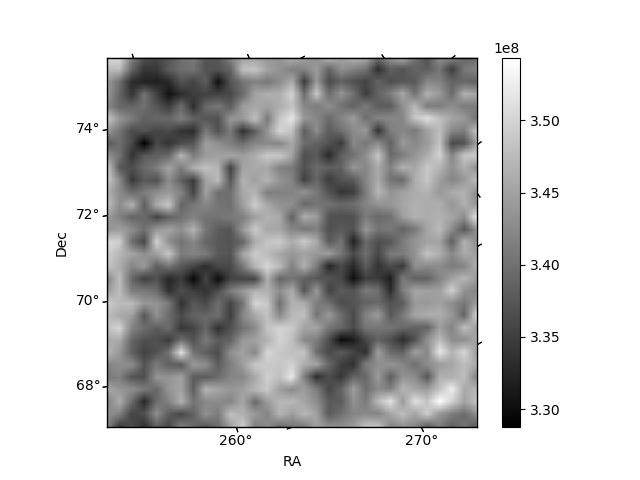
Histogram calculated using DETX and DETY for each event in the final _common_clean file
| Quadrant A |  |
 |
Quadrant B |
|---|---|---|---|
| Quadrant D | 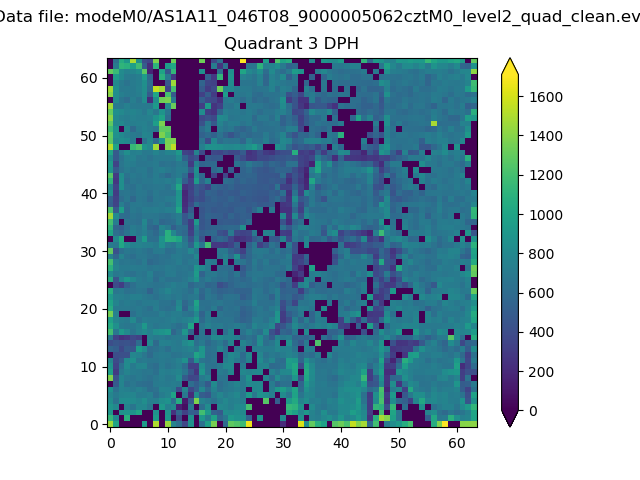 |
 |
Quadrant C |
| Plot type | Count rate plots | Images |
|---|---|---|
| Comparison with Poisson distribution Blue bars denote a histogram of data divided into 1 sec bins. Red curve is a Poisson curve with rate = median count rate of data. |
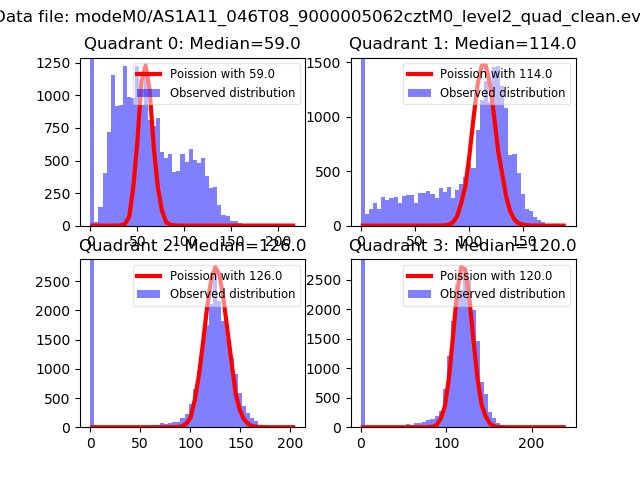 |
 |
| Quadrant-wise count rates Data is divided into 100 sec bins |
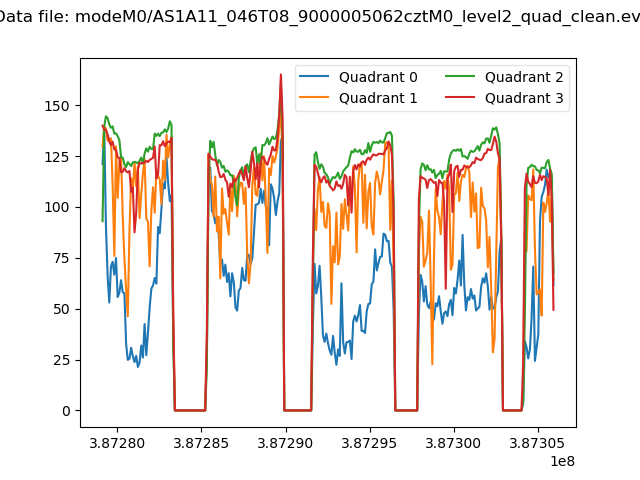 |
|
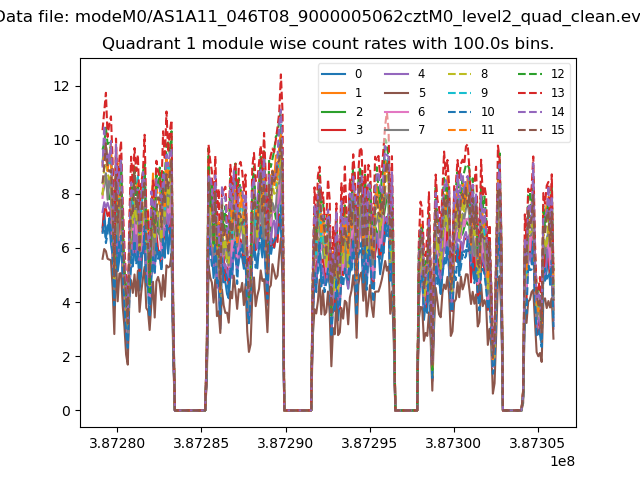
| Module-wise count rates for Quadrant A Data is divided into 100 sec bins |
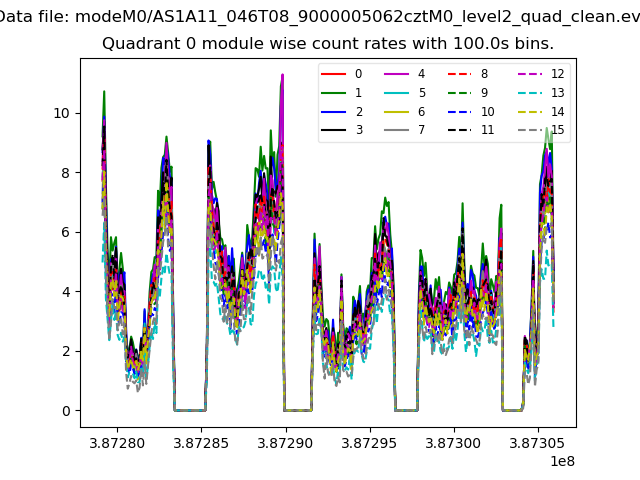 |
 |
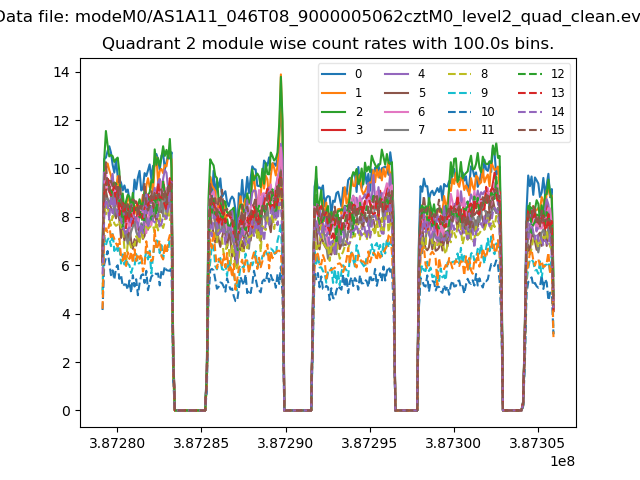
| Module-wise count rates for Quadrant B Data is divided into 100 sec bins |
 |
 |
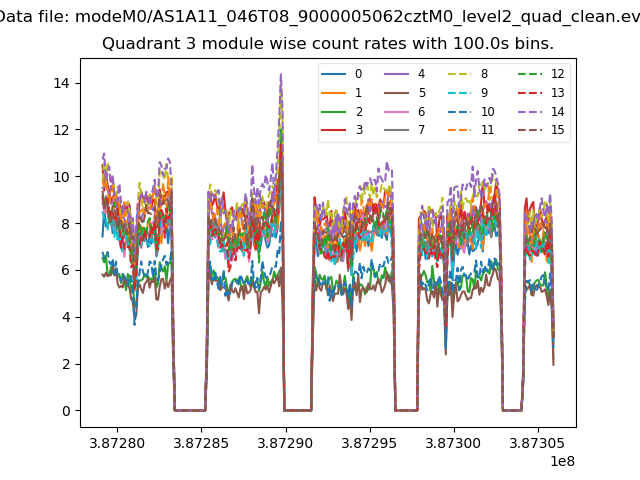
| Module-wise count rates for Quadrant C Data is divided into 100 sec bins |
 |
 |
| Module-wise count rates for Quadrant D Data is divided into 100 sec bins |
 |
 |
| Parameter | Plot |
|---|---|
| CZT HV Monitor | 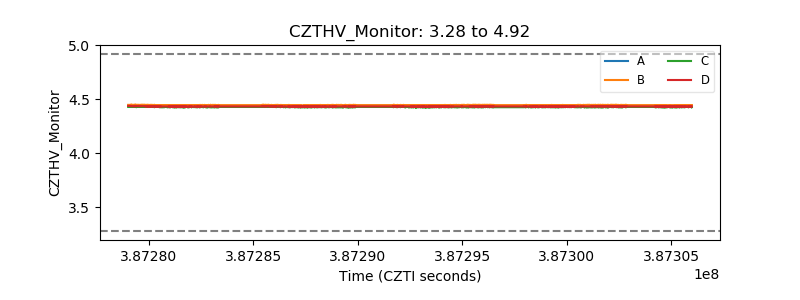 |
| D_VDD | 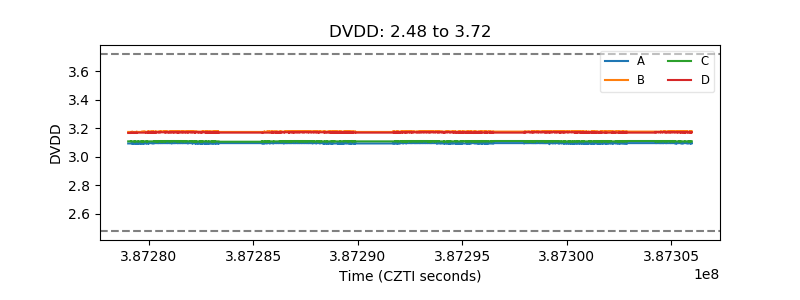 |
| Temperature 1 | 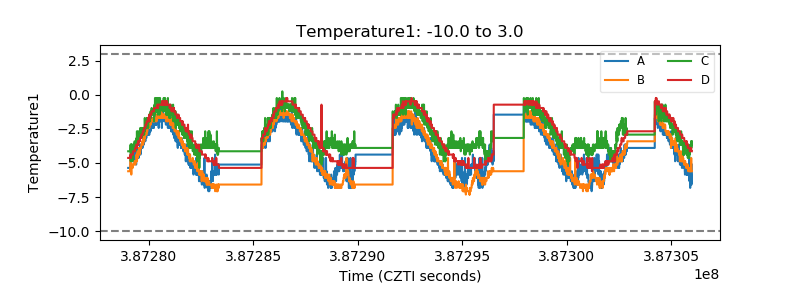 |
| Veto HV Monitor | 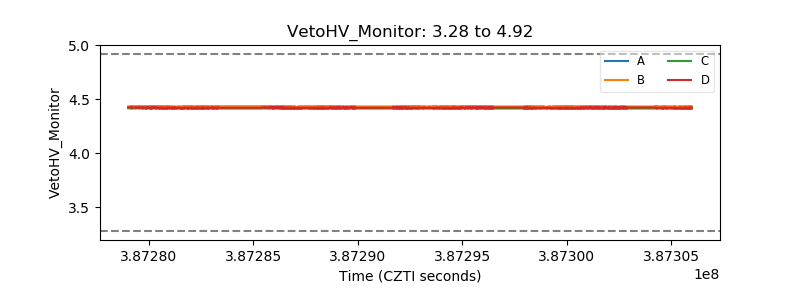 |
| Veto LLD | 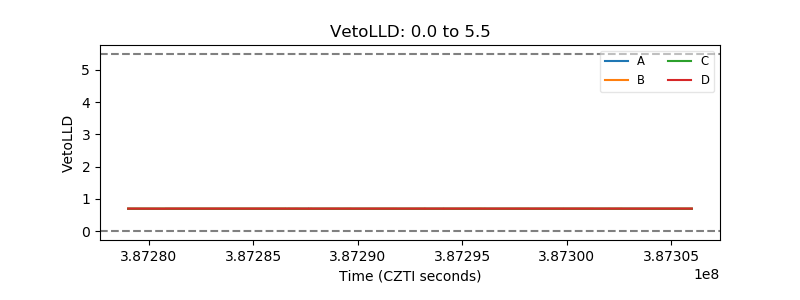 |
| Alpha Counter | 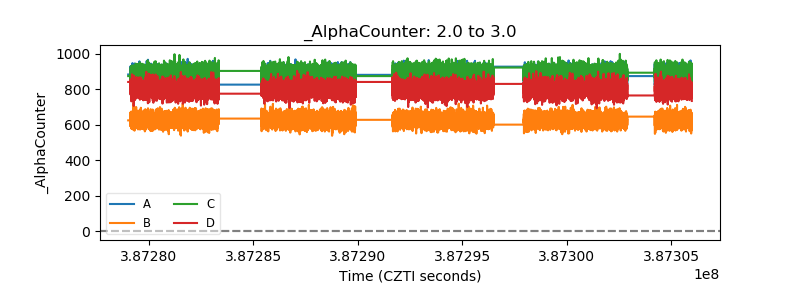 |
| _CPM_Rate | 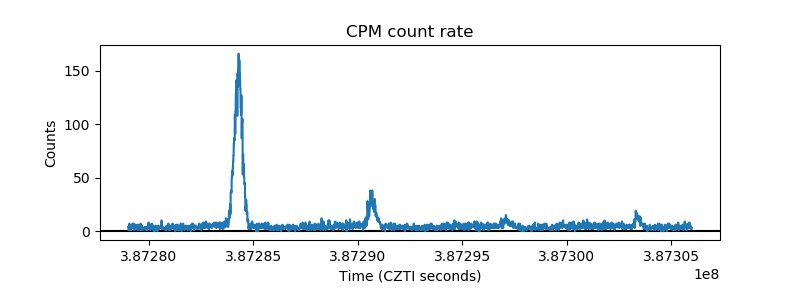 |
| CZT Counter | 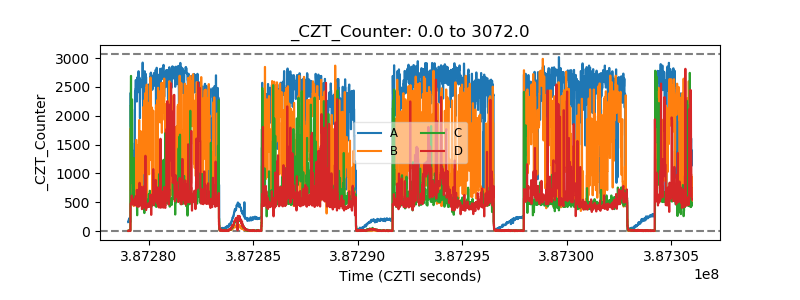 |
| +2.5 Volts monitor | 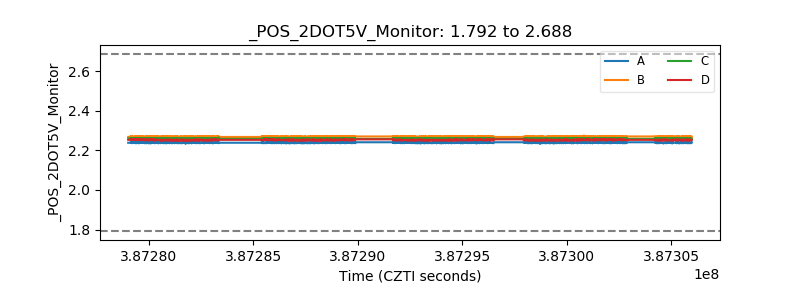 |
| +5 Volts monitor | 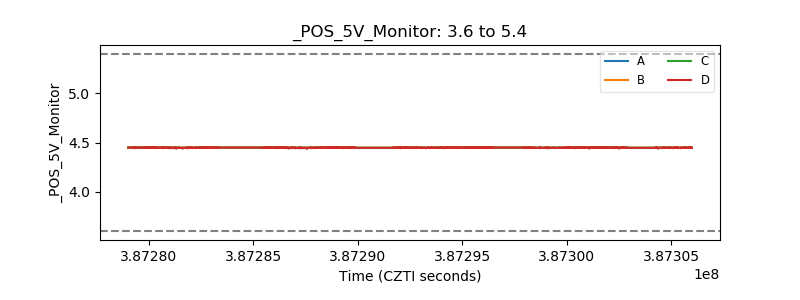 |
| _ROLL_ROT | 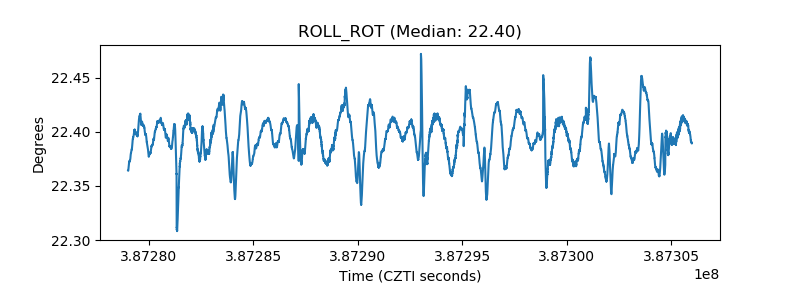 |
| _Roll_DEC | 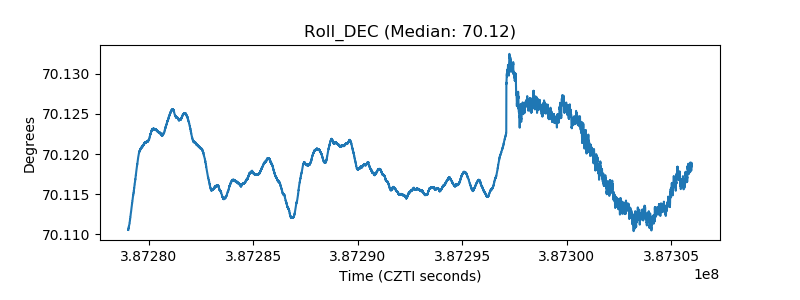 |
| _Roll_RA | 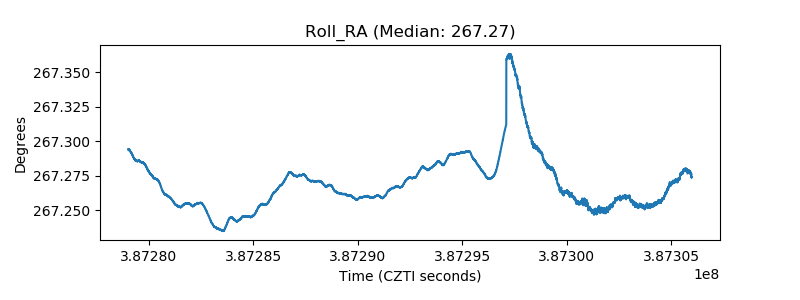 |
| Veto Counter | 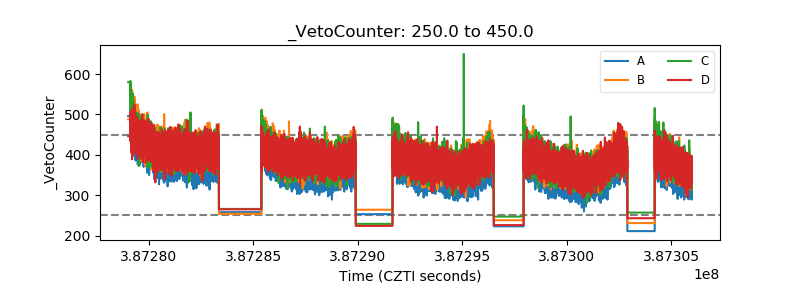 |