| Param | Original file | Final file |
|---|---|---|
| Filename | modeM0/AS1T05_023T01_9000005058_35320cztM0_level2.evt | modeM0/AS1T05_023T01_9000005058_35320cztM0_level2_quad_clean.evt |
| Size (bytes) | 1,207,791,360 | 140,532,480 |
| Size | 1.1 GB | 134.0 MB |
| Events in quadrant A | 6,209,353 | 910,689 |
| Events in quadrant B | 12,348,795 | 819,521 |
| Events in quadrant C | 6,741,298 | 876,991 |
| Events in quadrant D | 10,472,133 | 819,518 |
| Mode M0 | |||
|---|---|---|---|
| Quadrant | BADHDUFLAG | Total packets | Discarded packets |
| A | 0 | 25453 | 2 |
| B | 0 | 44753 | 2 |
| C | 0 | 26861 | 2 |
| D | 0 | 39700 | 2 |
| Mode M9 | |||
|---|---|---|---|
| Quadrant | BADHDUFLAG | Total packets | Discarded packets |
| A | 0 | 39 | 0 |
| B | 0 | 39 | 0 |
| C | 0 | 39 | 0 |
| D | 0 | 39 | 0 |
| Mode SS | |||
|---|---|---|---|
| Quadrant | BADHDUFLAG | Total packets | Discarded packets |
| A | 0 | 244 | 0 |
| B | 0 | 244 | 0 |
| C | 0 | 244 | 0 |
| D | 0 | 244 | 0 |
| Quadrant | Total seconds | Saturated seconds | Saturation percentage |
|---|---|---|---|
| A | 11977 | 38 | 0.317275% |
| B | 11977 | 2140 | 17.867580% |
| C | 11977 | 175 | 1.461134% |
| D | 11977 | 536 | 4.475244% |
Noise dominated data is calculated using 1-second bins in cleaned event files. If a bin has >2000 counts, and if more than 50% of those come from <1% of pixels, then it is considered to be noise-dominated and hence unusable.
| Quadrant | # 1 sec bins | Bins with >0 counts | Bins with >2000 counts | High rate bins dominated by noise | Noise dominated (total time) | Noise dominated (detector-on time) | Marked lightcurve |
|---|---|---|---|---|---|---|---|
| A | 15923 | 11979 | 19 | 19 | 0.12% | 0.16% | 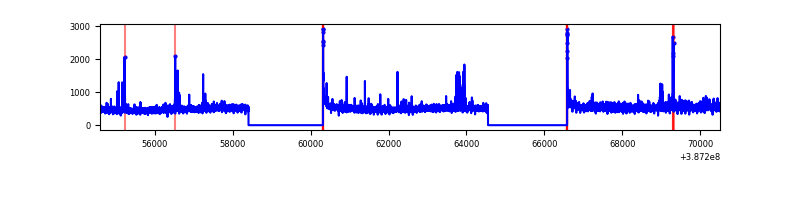 |
| B | 15923 | 11979 | 1541 | 1541 | 9.68% | 12.86% | 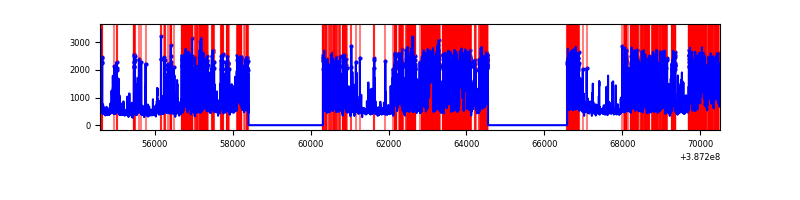 |
| C | 15923 | 11979 | 137 | 137 | 0.86% | 1.14% | 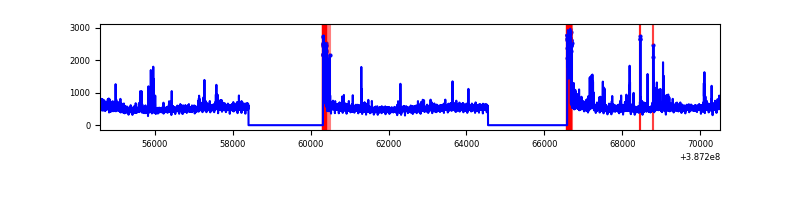 |
| D | 15923 | 11979 | 514 | 514 | 3.23% | 4.29% | 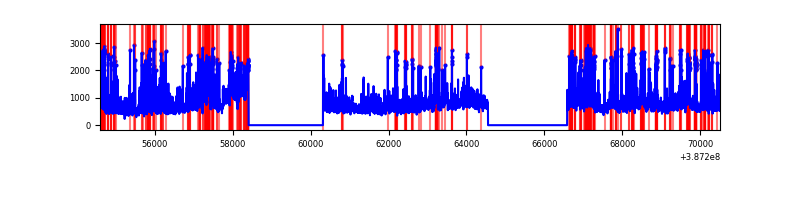 |
Top three noisy pixels from each quadrant. If the there are fewer than three noisy pixels in the level2.evt file, extra rows are filled as -1
| Pixel properties | Quadrant properties | ||||||
|---|---|---|---|---|---|---|---|
| Quadrant | DetID | PixID | Counts | Sigma | Mean | Median | Sigma |
| A | 15 | 169 | 206455 | 701.88 | 1474 | 1449 | 292.1 |
| A | 10 | 83 | 143161 | 485.18 | 1474 | 1449 | 292.1 |
| A | 9 | 143 | 62049 | 207.48 | 1474 | 1449 | 292.1 |
| B | 5 | 236 | 5083007 | 19850.19 | 1364 | 1330 | 256.0 |
| B | 5 | 172 | 1871730 | 7306.21 | 1364 | 1330 | 256.0 |
| B | 12 | 111 | 31154 | 116.5 | 1364 | 1330 | 256.0 |
| C | 0 | 10 | 557536 | 1746.2 | 1401 | 1413 | 318.5 |
| C | 15 | 214 | 483622 | 1514.11 | 1401 | 1413 | 318.5 |
| C | 3 | 233 | 76408 | 235.48 | 1401 | 1413 | 318.5 |
| D | 8 | 195 | 1453798 | 4324.85 | 1395 | 1359 | 335.8 |
| D | 12 | 235 | 1389807 | 4134.3 | 1395 | 1359 | 335.8 |
| D | 7 | 80 | 828346 | 2462.47 | 1395 | 1359 | 335.8 |
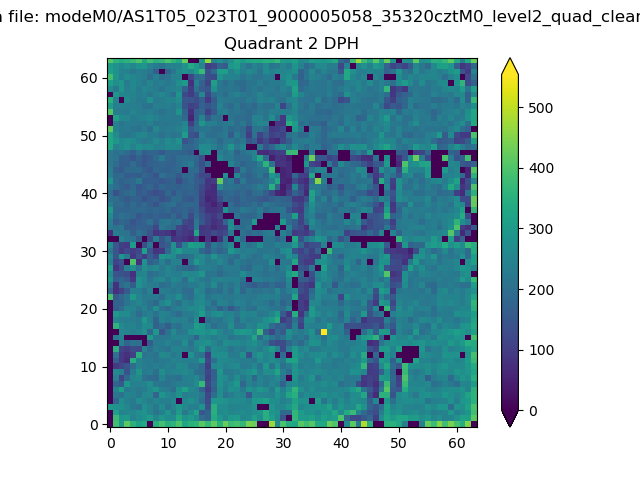
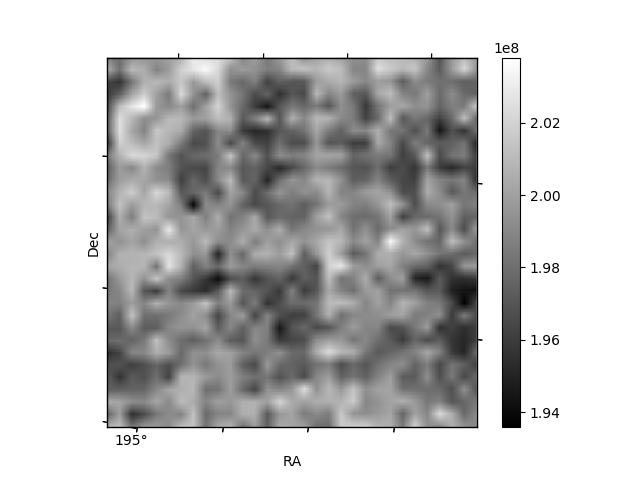
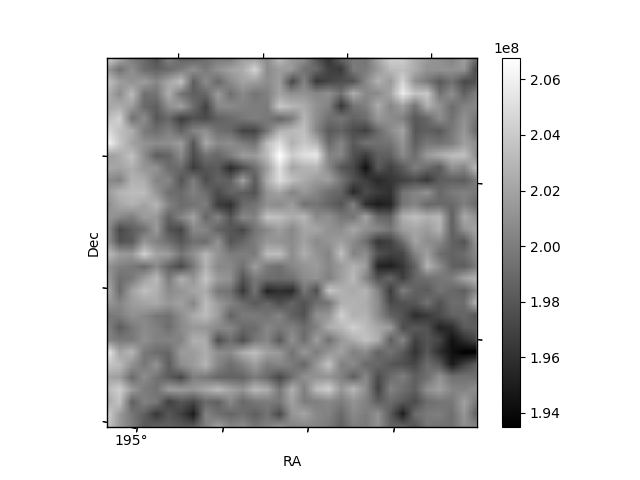
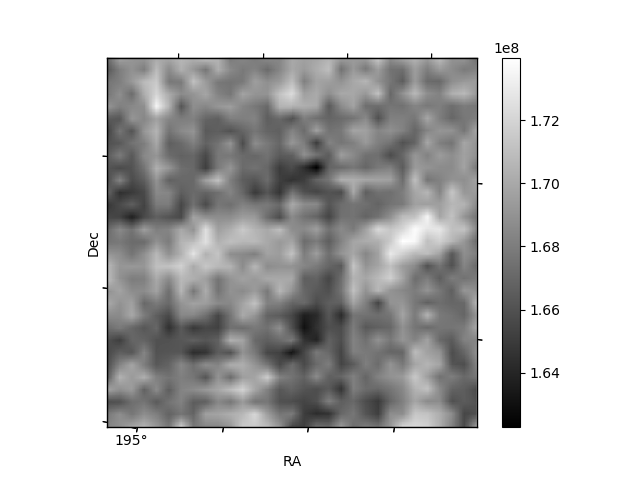
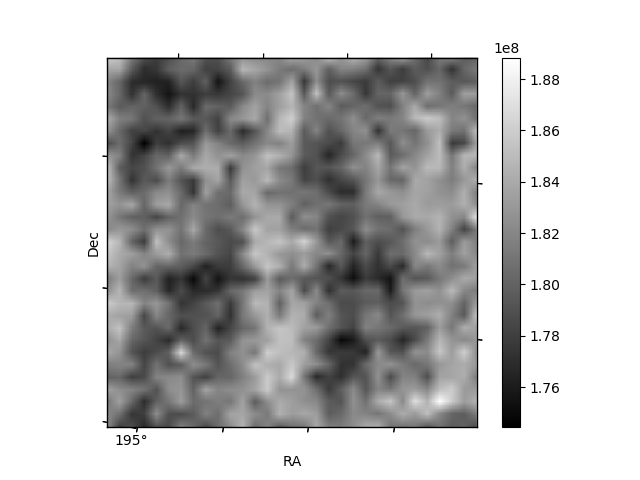
Histogram calculated using DETX and DETY for each event in the final _common_clean file
| Quadrant A | 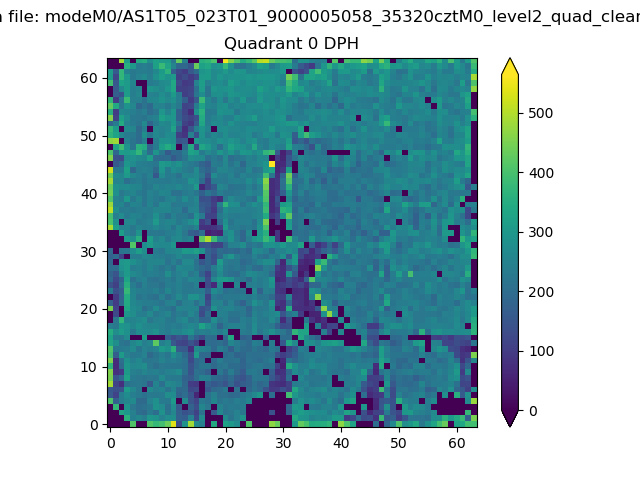 |
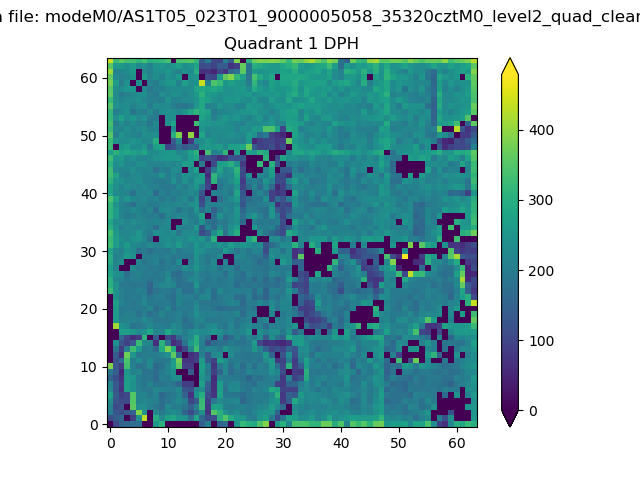 |
Quadrant B |
|---|---|---|---|
| Quadrant D | 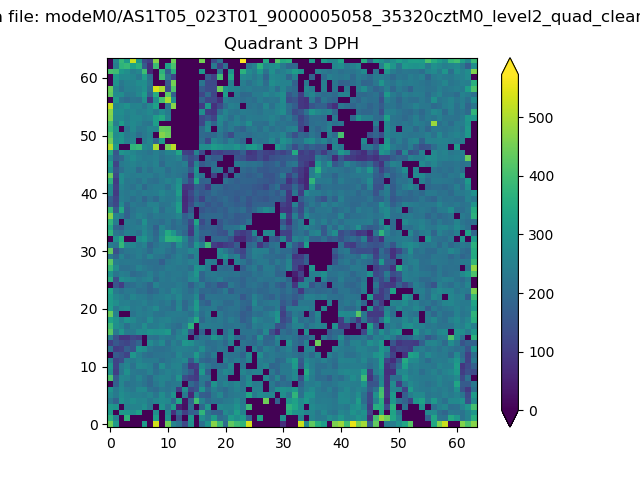 |
 |
Quadrant C |
| Plot type | Count rate plots | Images |
|---|---|---|
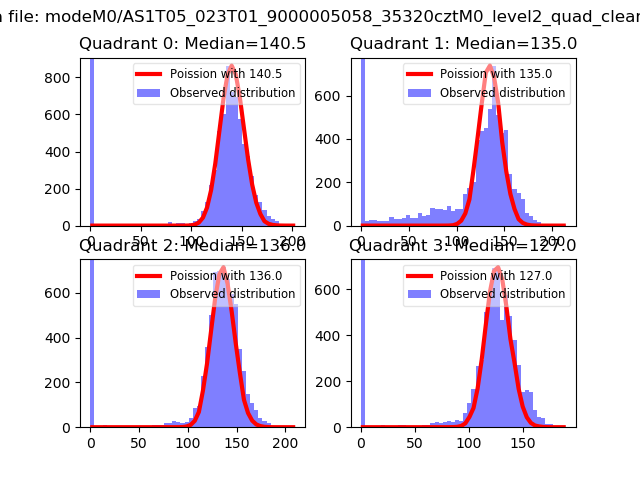
| Comparison with Poisson distribution Blue bars denote a histogram of data divided into 1 sec bins. Red curve is a Poisson curve with rate = median count rate of data. |
 |
 |
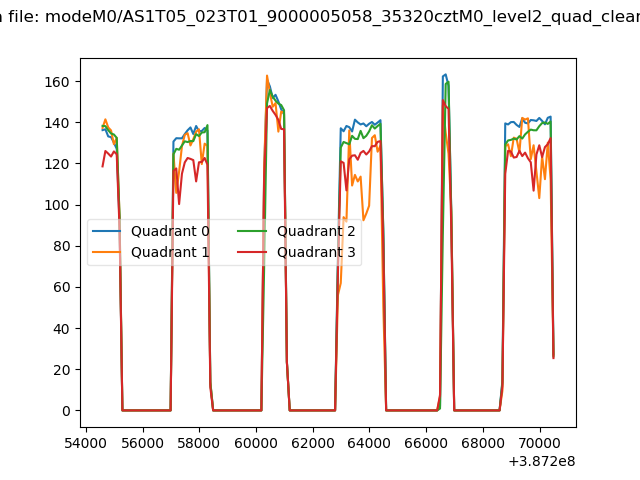
| Quadrant-wise count rates Data is divided into 100 sec bins |
 |
|
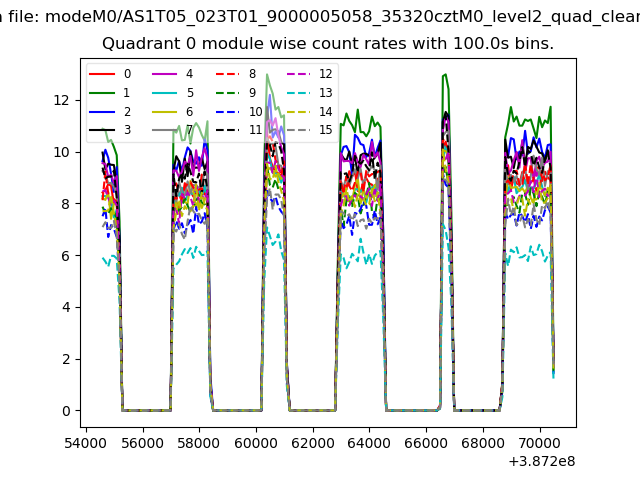
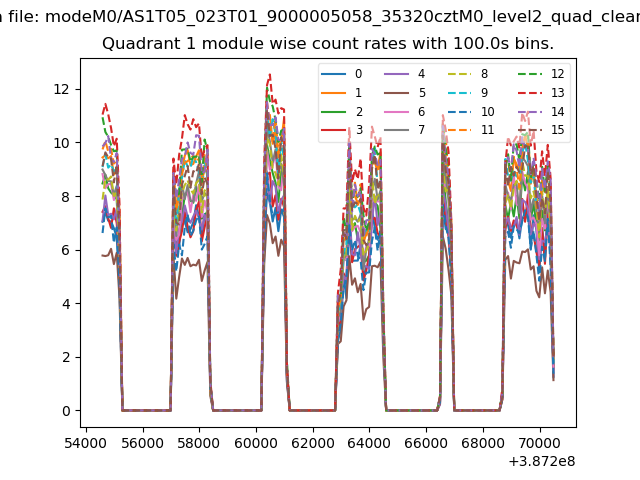
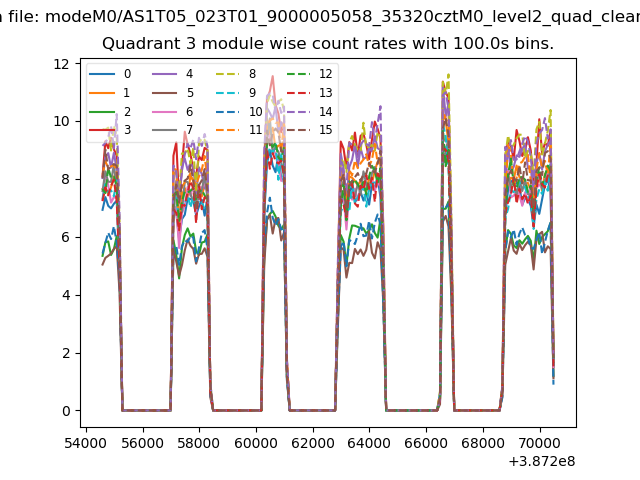
| Module-wise count rates for Quadrant A Data is divided into 100 sec bins |
 |
 |
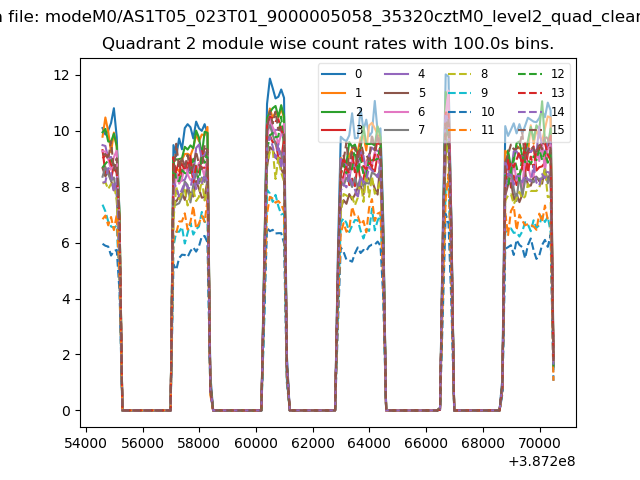
| Module-wise count rates for Quadrant B Data is divided into 100 sec bins |
 |
 |
| Module-wise count rates for Quadrant C Data is divided into 100 sec bins |
 |
 |
| Module-wise count rates for Quadrant D Data is divided into 100 sec bins |
 |
 |
| Parameter | Plot |
|---|---|
| CZT HV Monitor | 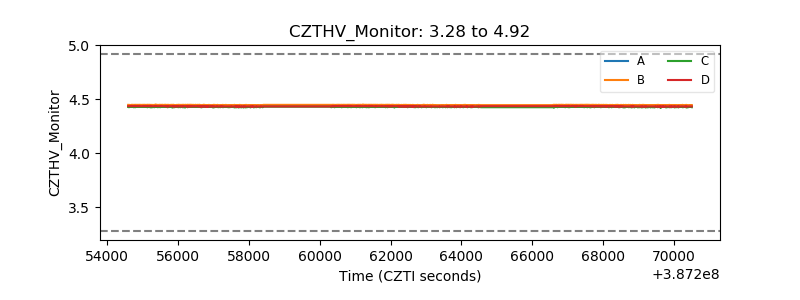 |
| D_VDD | 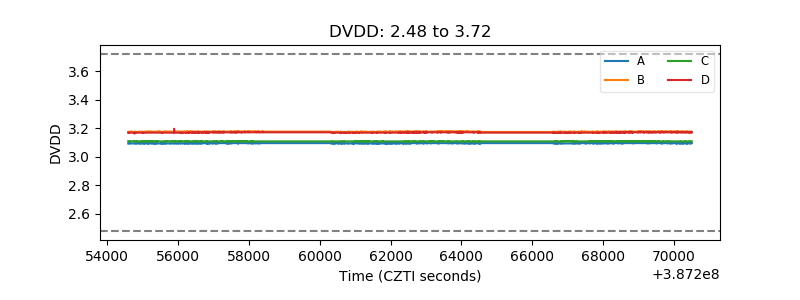 |
| Temperature 1 | 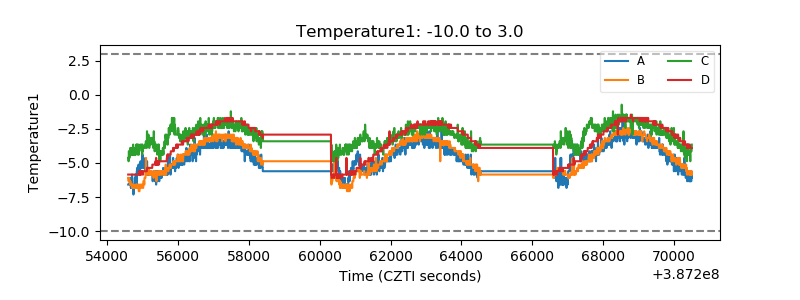 |
| Veto HV Monitor | 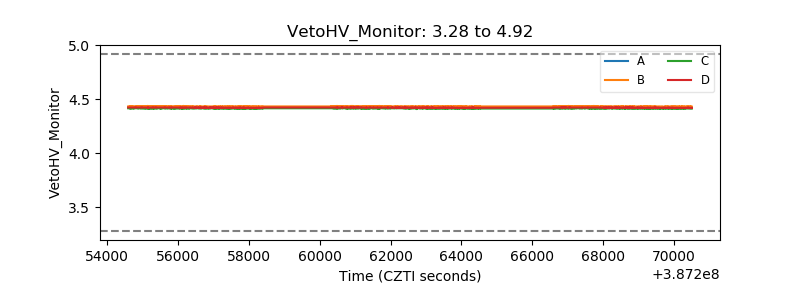 |
| Veto LLD | 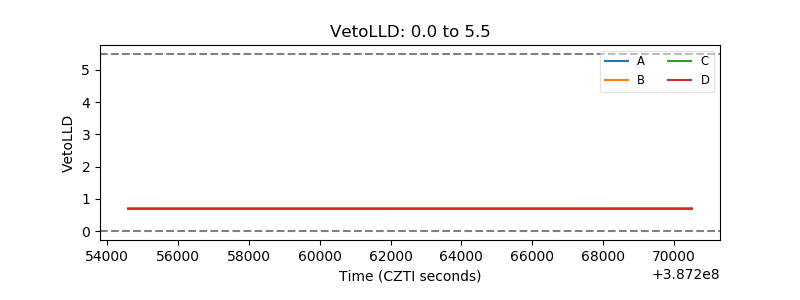 |
| Alpha Counter | 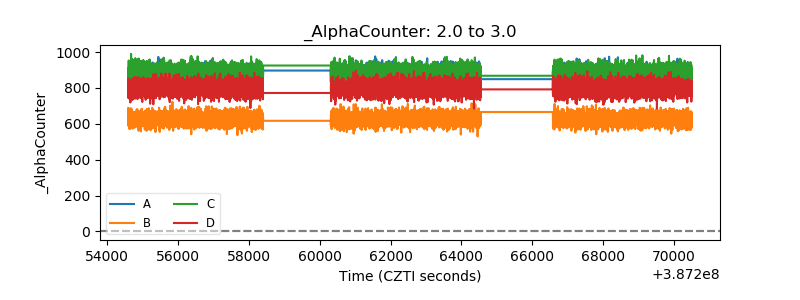 |
| _CPM_Rate | 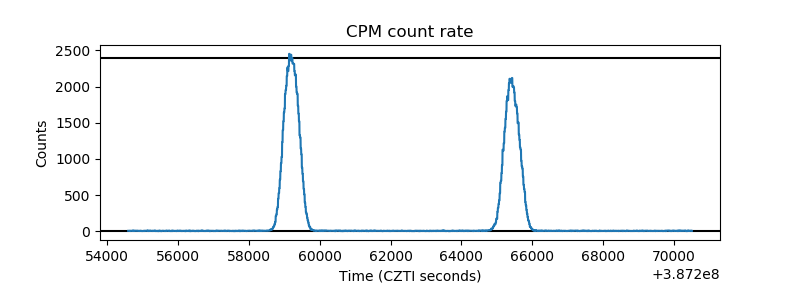 |
| CZT Counter | 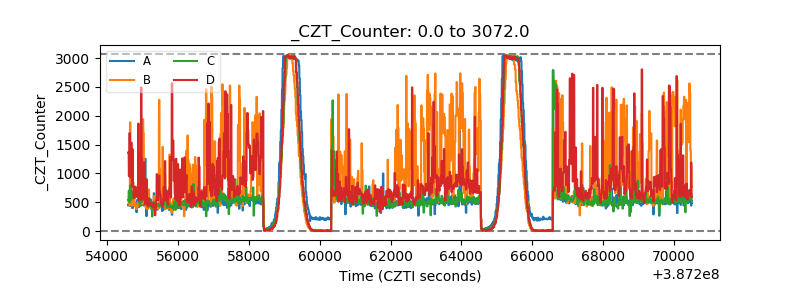 |
| +2.5 Volts monitor | 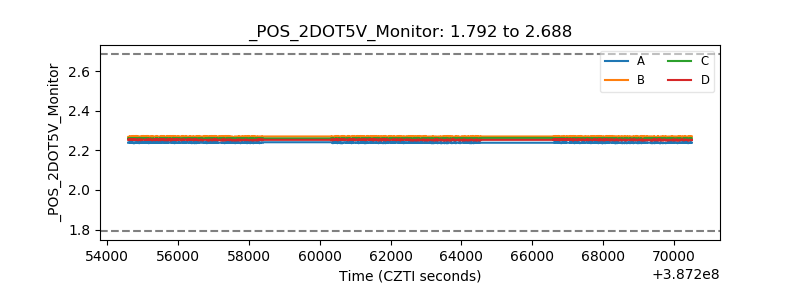 |
| +5 Volts monitor | 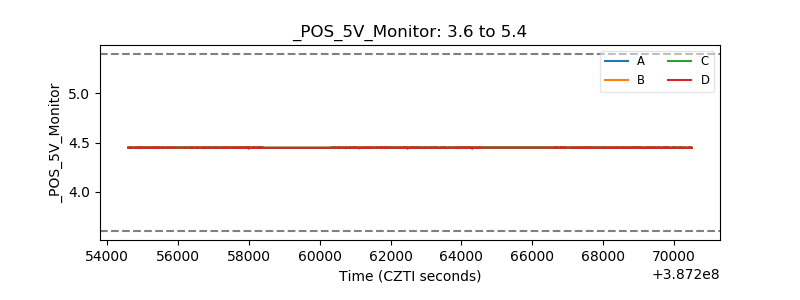 |
| _ROLL_ROT | 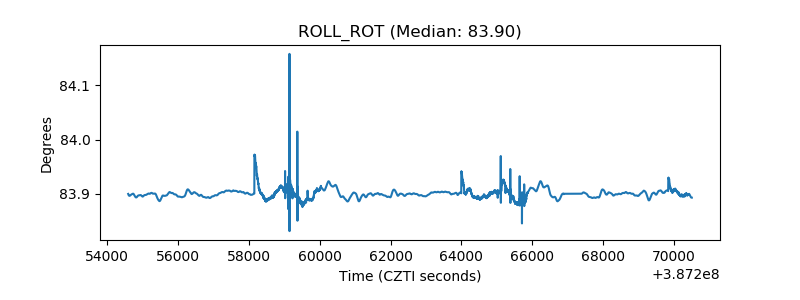 |
| _Roll_DEC | 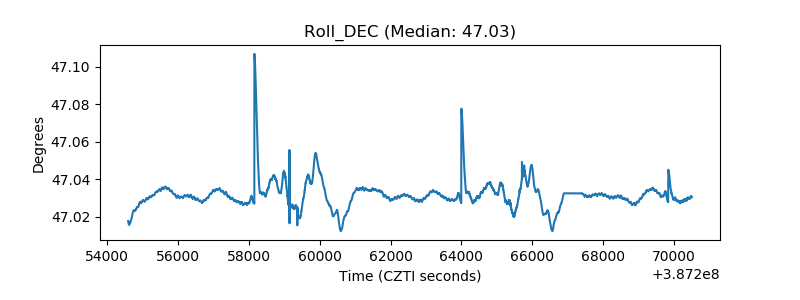 |
| _Roll_RA | 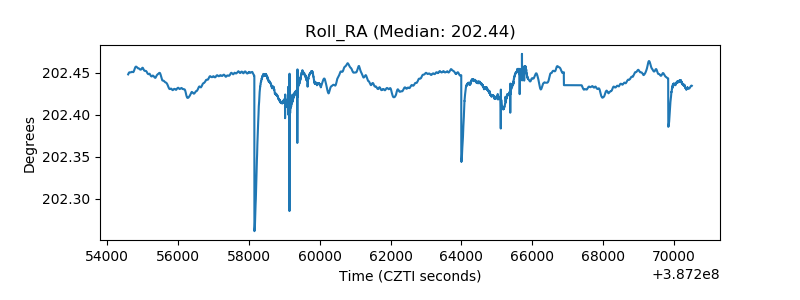 |
| Veto Counter | 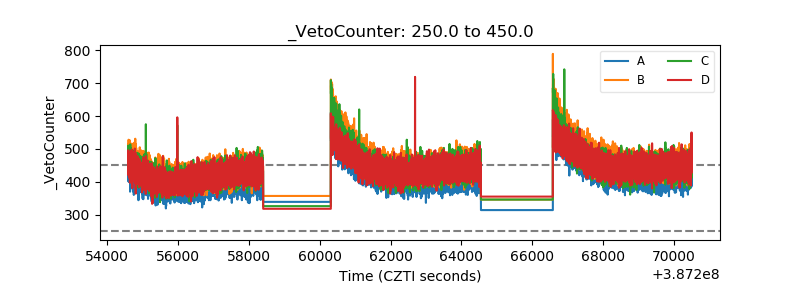 |