| Param | Original file | Final file |
|---|---|---|
| Filename | modeM0/AS1T05_023T01_9000005058_35319cztM0_level2.evt | modeM0/AS1T05_023T01_9000005058_35319cztM0_level2_quad_clean.evt |
| Size (bytes) | 906,658,560 | 104,238,720 |
| Size | 864.7 MB | 99.4 MB |
| Events in quadrant A | 4,710,109 | 667,959 |
| Events in quadrant B | 9,025,550 | 601,345 |
| Events in quadrant C | 5,199,620 | 643,412 |
| Events in quadrant D | 7,904,065 | 606,581 |
| Mode M0 | |||
|---|---|---|---|
| Quadrant | BADHDUFLAG | Total packets | Discarded packets |
| A | 0 | 19377 | 6 |
| B | 0 | 32967 | 2 |
| C | 0 | 20729 | 2 |
| D | 0 | 29984 | 2 |
| Mode M9 | |||
|---|---|---|---|
| Quadrant | BADHDUFLAG | Total packets | Discarded packets |
| A | 0 | 39 | 0 |
| B | 0 | 39 | 0 |
| C | 0 | 39 | 0 |
| D | 0 | 39 | 0 |
| Mode SS | |||
|---|---|---|---|
| Quadrant | BADHDUFLAG | Total packets | Discarded packets |
| A | 0 | 188 | 0 |
| B | 0 | 188 | 0 |
| C | 0 | 188 | 0 |
| D | 0 | 188 | 0 |
| Quadrant | Total seconds | Saturated seconds | Saturation percentage |
|---|---|---|---|
| A | 9175 | 28 | 0.305177% |
| B | 9176 | 1525 | 16.619442% |
| C | 9176 | 166 | 1.809067% |
| D | 9176 | 369 | 4.021360% |
Noise dominated data is calculated using 1-second bins in cleaned event files. If a bin has >2000 counts, and if more than 50% of those come from <1% of pixels, then it is considered to be noise-dominated and hence unusable.
| Quadrant | # 1 sec bins | Bins with >0 counts | Bins with >2000 counts | High rate bins dominated by noise | Noise dominated (total time) | Noise dominated (detector-on time) | Marked lightcurve |
|---|---|---|---|---|---|---|---|
| A | 13122 | 9178 | 15 | 15 | 0.11% | 0.16% | 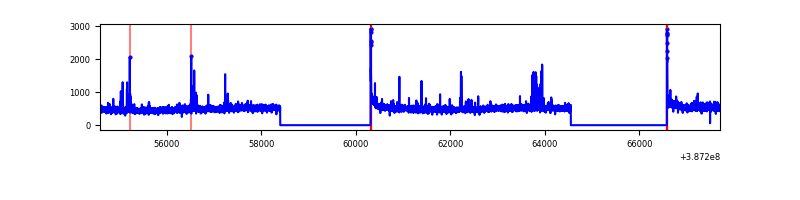 |
| B | 13122 | 9178 | 1080 | 1080 | 8.23% | 11.77% | 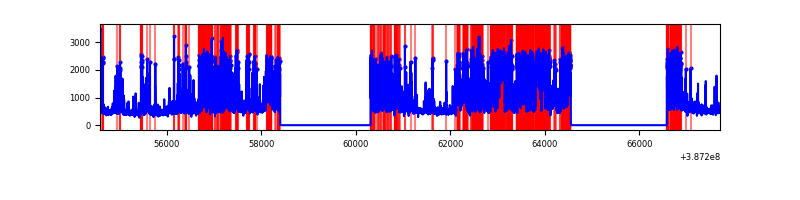 |
| C | 13122 | 9178 | 132 | 132 | 1.01% | 1.44% | 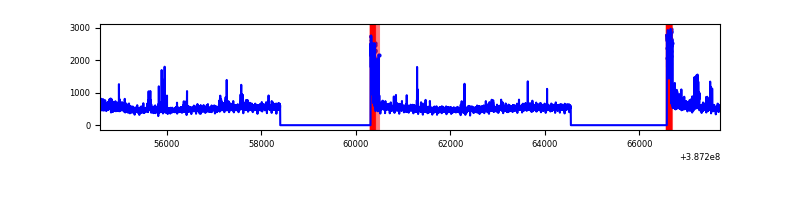 |
| D | 13122 | 9178 | 352 | 352 | 2.68% | 3.84% | 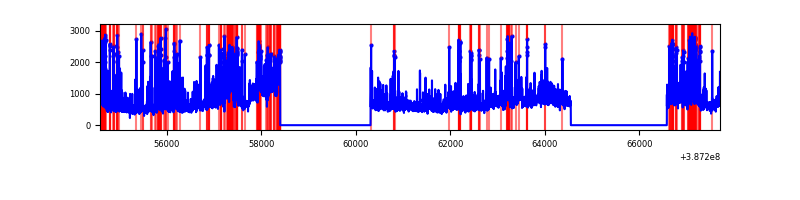 |
Top three noisy pixels from each quadrant. If the there are fewer than three noisy pixels in the level2.evt file, extra rows are filled as -1
| Pixel properties | Quadrant properties | ||||||
|---|---|---|---|---|---|---|---|
| Quadrant | DetID | PixID | Counts | Sigma | Mean | Median | Sigma |
| A | 10 | 83 | 122304 | 544.6 | 1124 | 1107 | 222.5 |
| A | 15 | 169 | 117854 | 524.61 | 1124 | 1107 | 222.5 |
| A | 9 | 143 | 36831 | 160.53 | 1124 | 1107 | 222.5 |
| B | 5 | 236 | 3384572 | 17267.9 | 1043 | 1019 | 195.9 |
| B | 5 | 172 | 1510755 | 7704.91 | 1043 | 1019 | 195.9 |
| B | 12 | 111 | 24140 | 118.0 | 1043 | 1019 | 195.9 |
| C | 0 | 10 | 474443 | 1941.85 | 1068 | 1077 | 243.8 |
| C | 15 | 214 | 372062 | 1521.86 | 1068 | 1077 | 243.8 |
| C | 15 | 159 | 70665 | 285.47 | 1068 | 1077 | 243.8 |
| D | 12 | 235 | 1099535 | 4270.91 | 1065 | 1036 | 257.2 |
| D | 8 | 195 | 1038400 | 4033.22 | 1065 | 1036 | 257.2 |
| D | 7 | 80 | 760305 | 2952.0 | 1065 | 1036 | 257.2 |
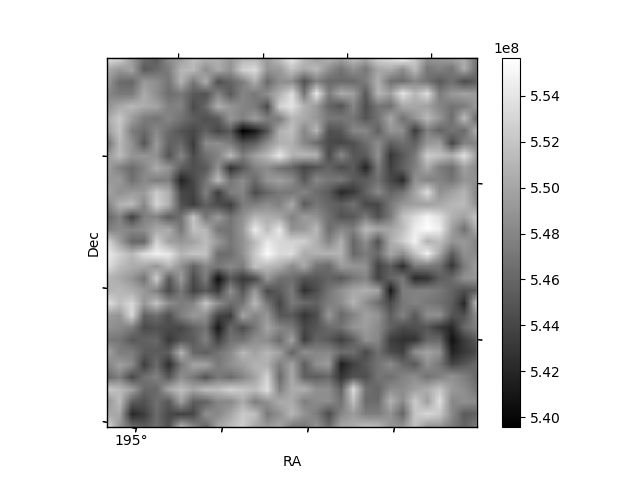
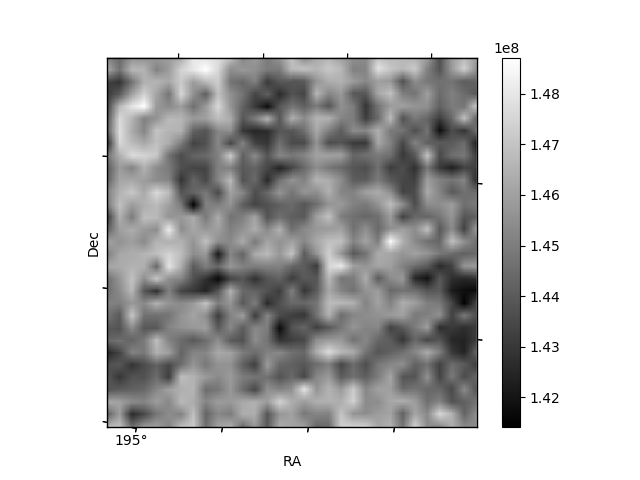
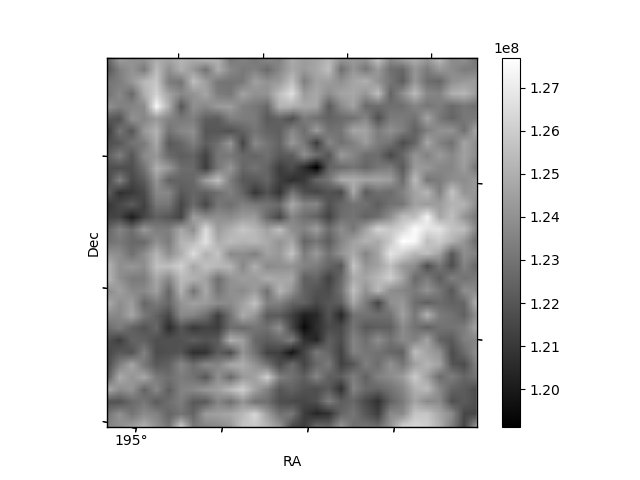
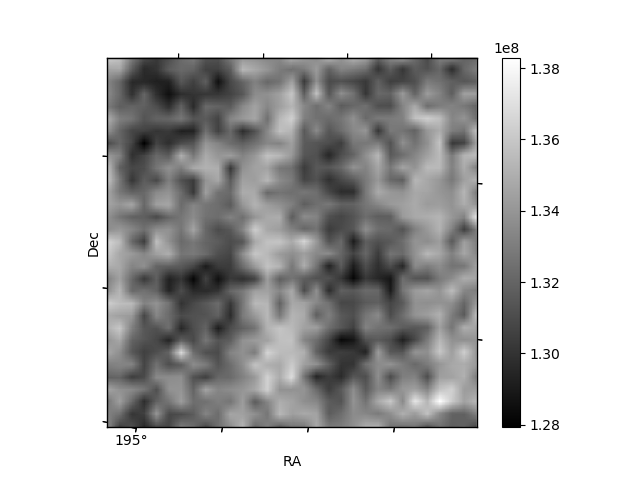
Histogram calculated using DETX and DETY for each event in the final _common_clean file
| Quadrant A | 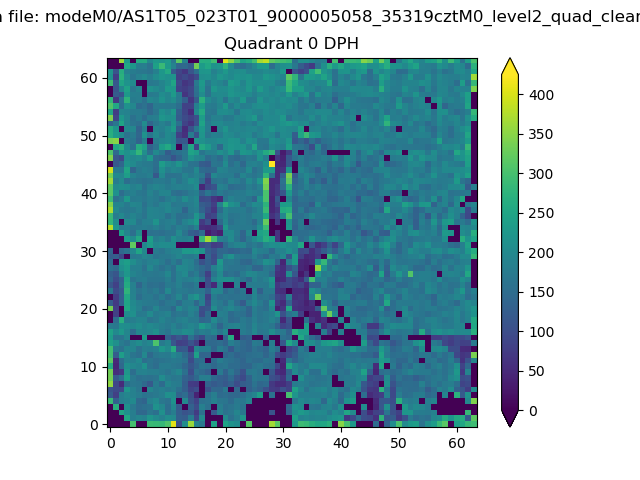 |
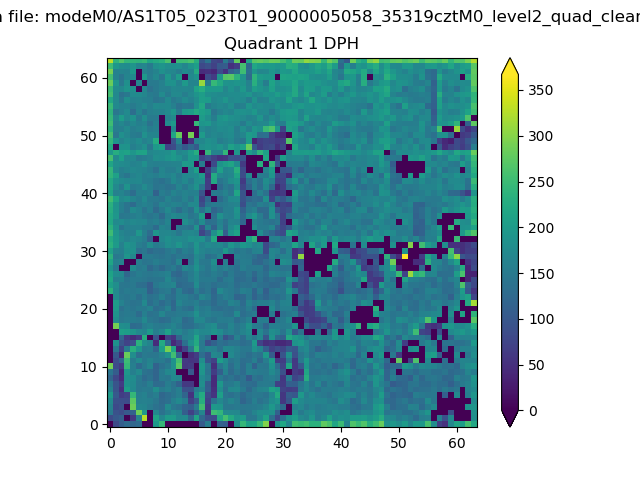 |
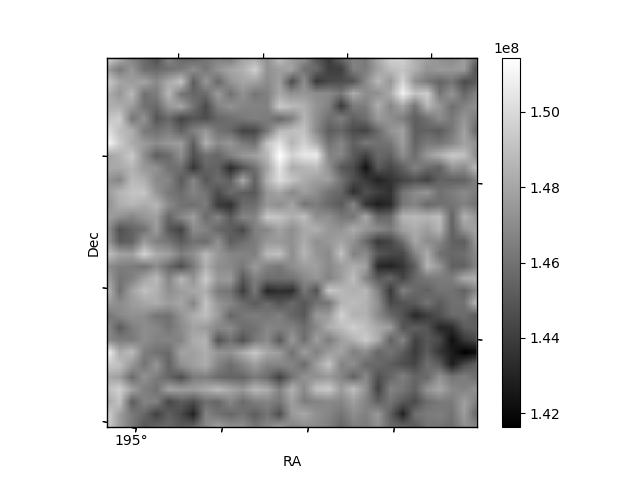
Quadrant B |
|---|---|---|---|
| Quadrant D | 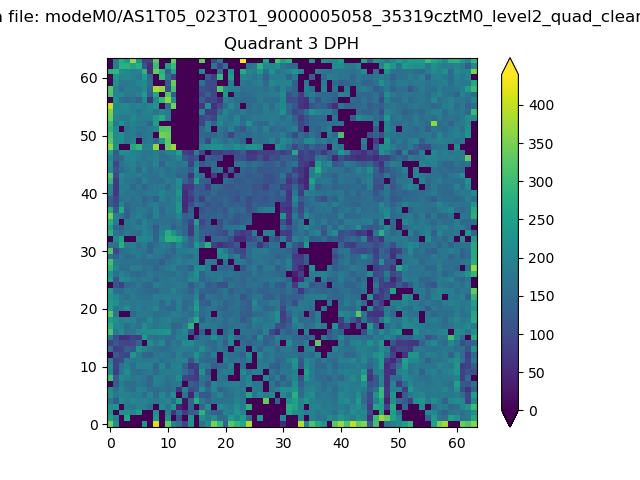 |
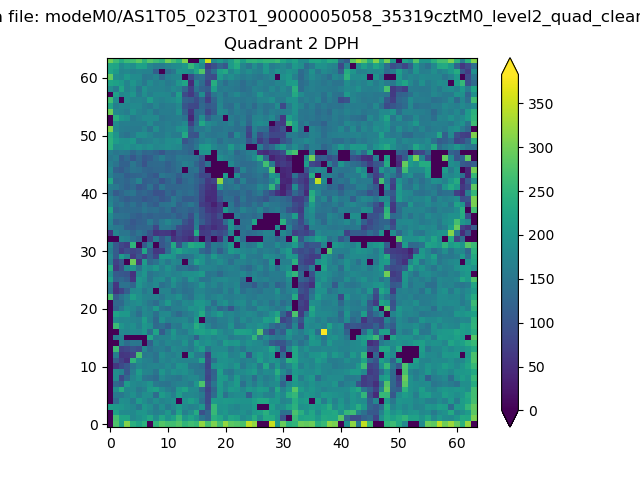 |
Quadrant C |
| Plot type | Count rate plots | Images |
|---|---|---|
| Comparison with Poisson distribution Blue bars denote a histogram of data divided into 1 sec bins. Red curve is a Poisson curve with rate = median count rate of data. |
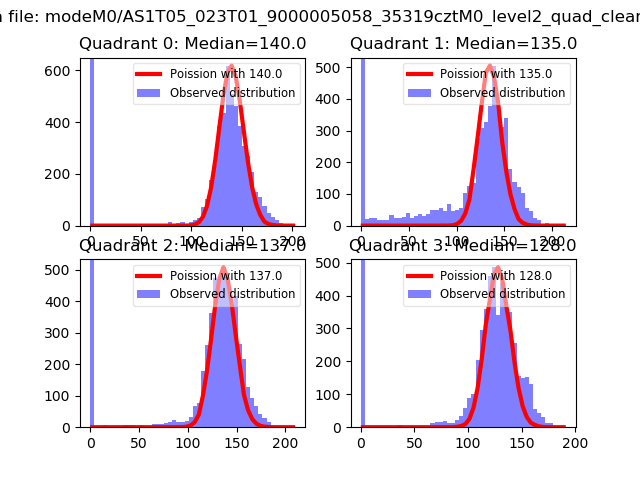 |
 |
| Quadrant-wise count rates Data is divided into 100 sec bins |
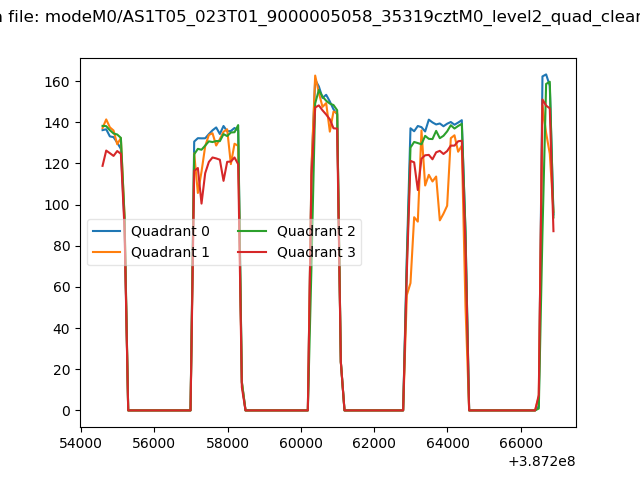 |
|
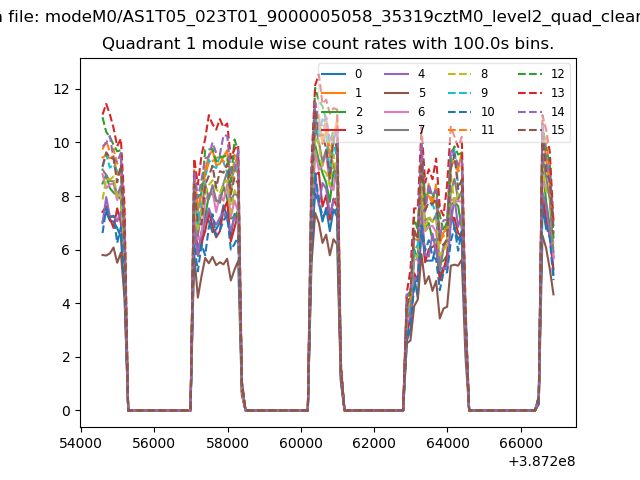
| Module-wise count rates for Quadrant A Data is divided into 100 sec bins |
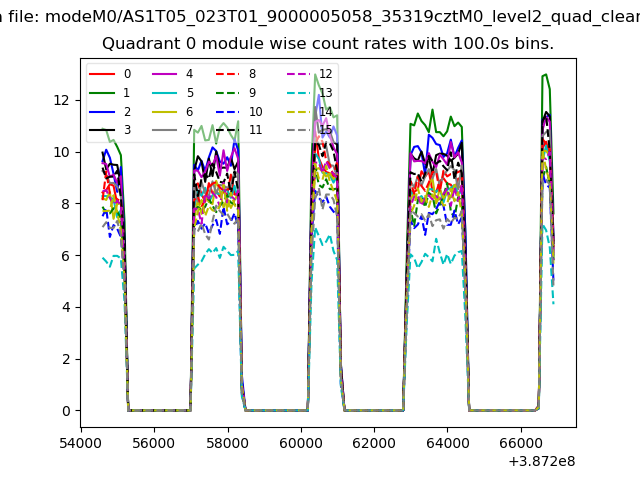 |
 |
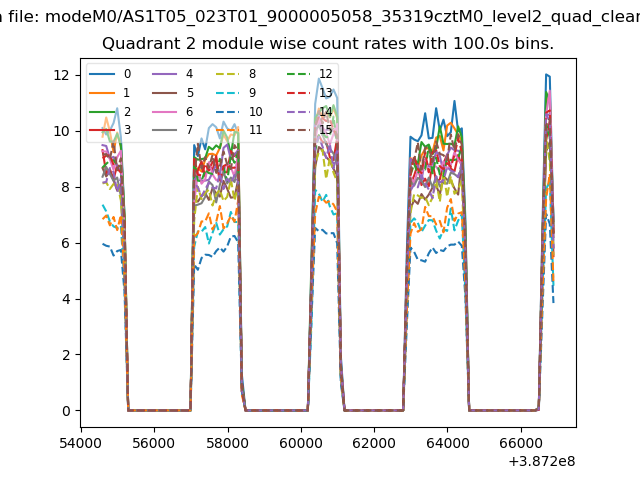
| Module-wise count rates for Quadrant B Data is divided into 100 sec bins |
 |
 |
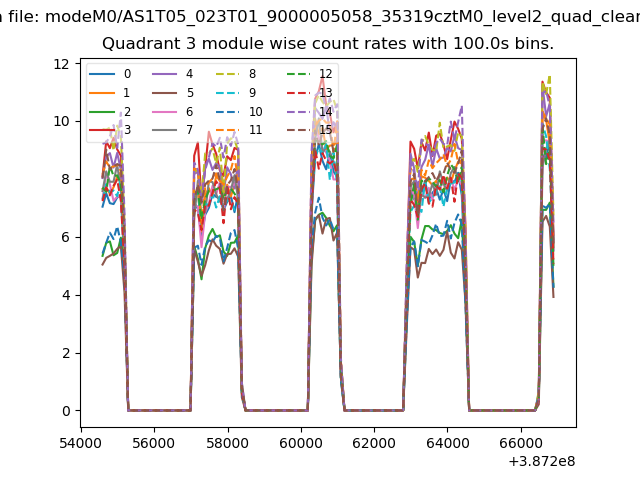
| Module-wise count rates for Quadrant C Data is divided into 100 sec bins |
 |
 |
| Module-wise count rates for Quadrant D Data is divided into 100 sec bins |
 |
 |
| Parameter | Plot |
|---|---|
| CZT HV Monitor | 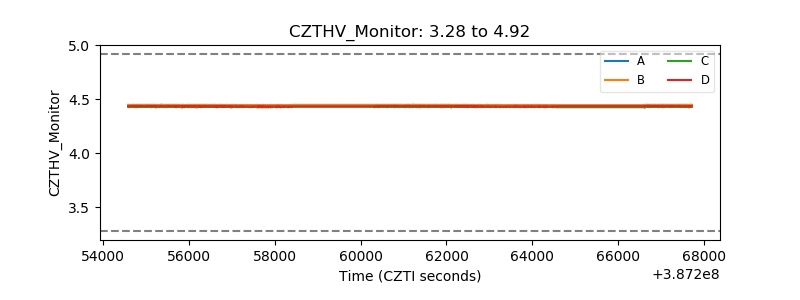 |
| D_VDD | 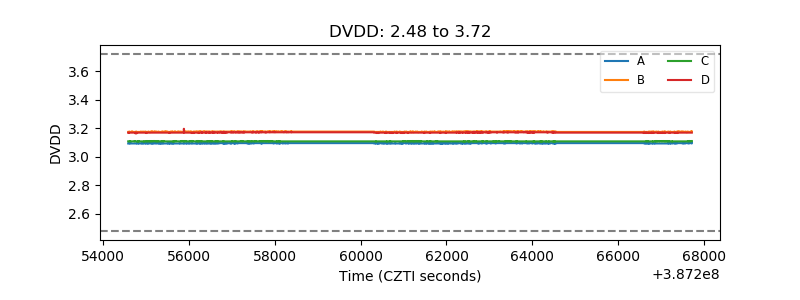 |
| Temperature 1 | 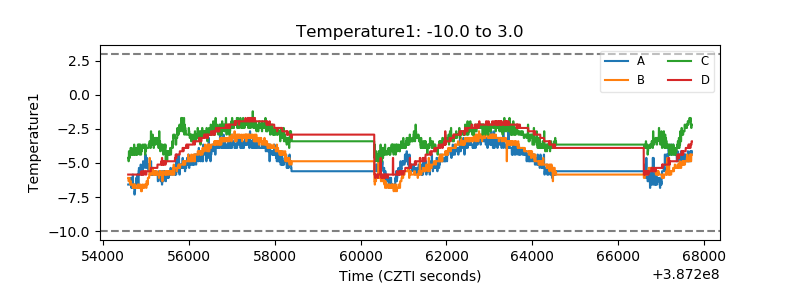 |
| Veto HV Monitor | 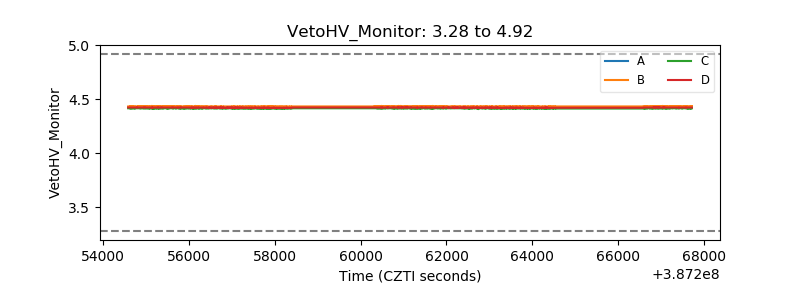 |
| Veto LLD | 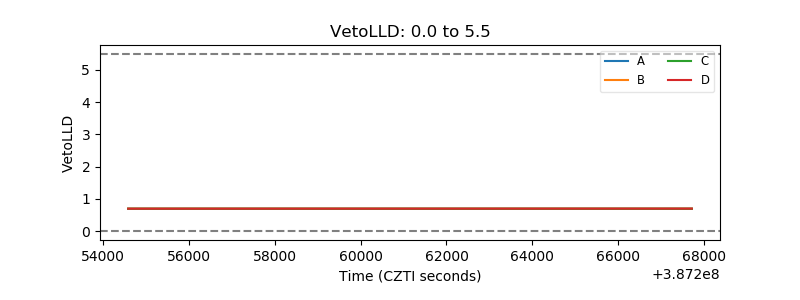 |
| Alpha Counter |  |
| _CPM_Rate | 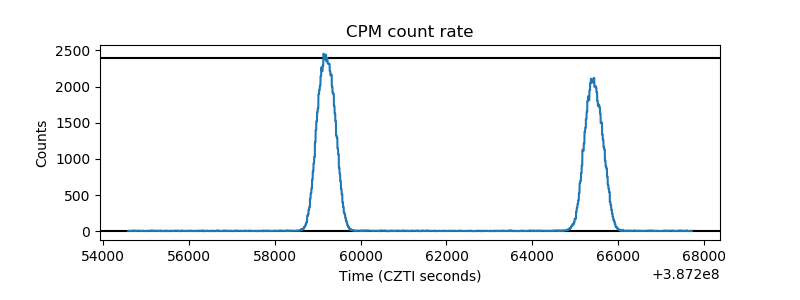 |
| CZT Counter | 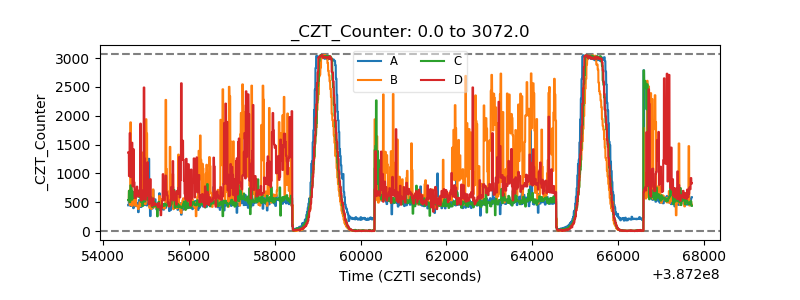 |
| +2.5 Volts monitor | 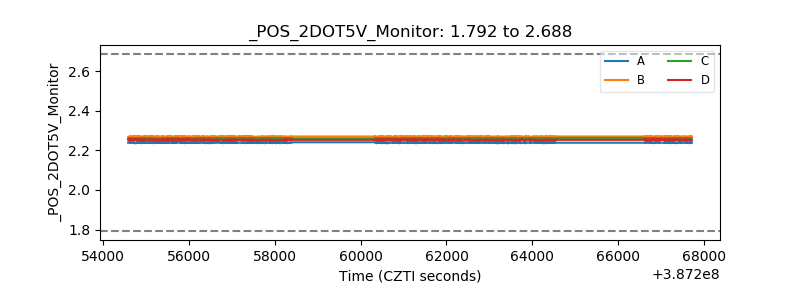 |
| +5 Volts monitor | 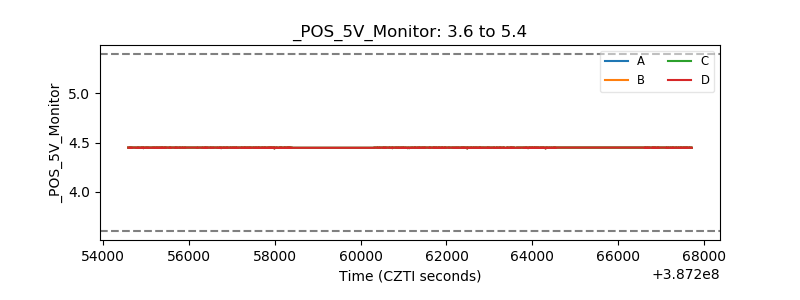 |
| _ROLL_ROT | 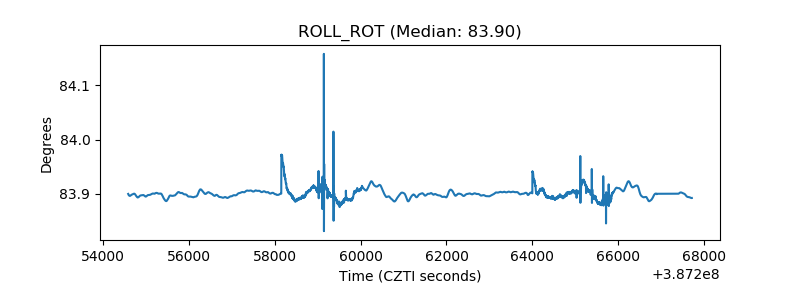 |
| _Roll_DEC | 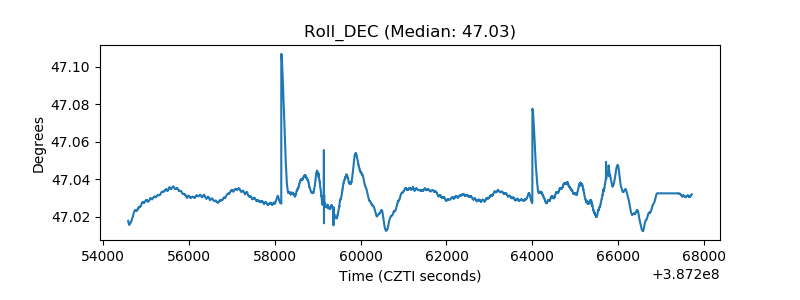 |
| _Roll_RA | 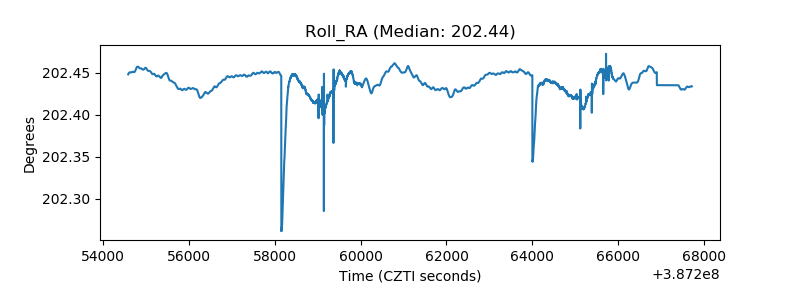 |
| Veto Counter | 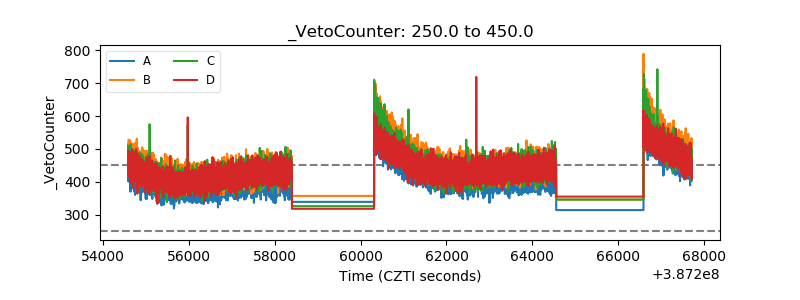 |