| Param | Original file | Final file |
|---|---|---|
| Filename | modeM0/AS1T05_023T01_9000005058_35318cztM0_level2.evt | modeM0/AS1T05_023T01_9000005058_35318cztM0_level2_quad_clean.evt |
| Size (bytes) | 510,425,280 | 71,464,320 |
| Size | 486.8 MB | 68.2 MB |
| Events in quadrant A | 2,669,198 | 465,544 |
| Events in quadrant B | 4,649,105 | 452,319 |
| Events in quadrant C | 3,015,570 | 454,979 |
| Events in quadrant D | 4,771,144 | 425,415 |
| Mode M0 | |||
|---|---|---|---|
| Quadrant | BADHDUFLAG | Total packets | Discarded packets |
| A | 0 | 11061 | 3 |
| B | 0 | 17366 | 2 |
| C | 0 | 12073 | 2 |
| D | 0 | 17812 | 2 |
| Mode M9 | |||
|---|---|---|---|
| Quadrant | BADHDUFLAG | Total packets | Discarded packets |
| A | 0 | 28 | 0 |
| B | 0 | 28 | 0 |
| C | 0 | 28 | 0 |
| D | 0 | 29 | 0 |
| Mode SS | |||
|---|---|---|---|
| Quadrant | BADHDUFLAG | Total packets | Discarded packets |
| A | 0 | 106 | 0 |
| B | 0 | 106 | 0 |
| C | 0 | 106 | 0 |
| D | 0 | 106 | 0 |
| Quadrant | Total seconds | Saturated seconds | Saturation percentage |
|---|---|---|---|
| A | 5217 | 23 | 0.440866% |
| B | 5217 | 592 | 11.347518% |
| C | 5217 | 96 | 1.840138% |
| D | 5217 | 277 | 5.309565% |
Noise dominated data is calculated using 1-second bins in cleaned event files. If a bin has >2000 counts, and if more than 50% of those come from <1% of pixels, then it is considered to be noise-dominated and hence unusable.
| Quadrant | # 1 sec bins | Bins with >0 counts | Bins with >2000 counts | High rate bins dominated by noise | Noise dominated (total time) | Noise dominated (detector-on time) | Marked lightcurve |
|---|---|---|---|---|---|---|---|
| A | 7130 | 5218 | 13 | 13 | 0.18% | 0.25% | 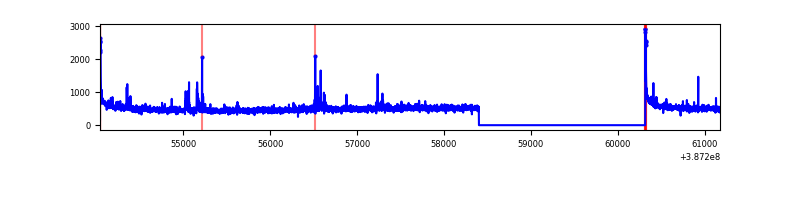 |
| B | 7130 | 5218 | 369 | 369 | 5.18% | 7.07% | 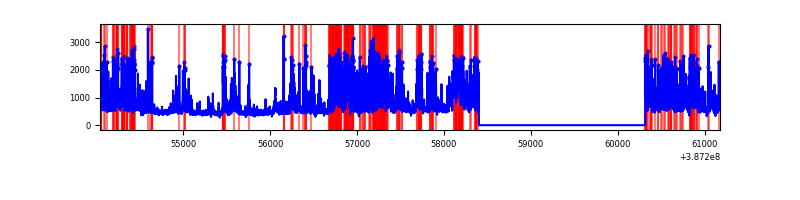 |
| C | 7130 | 5218 | 64 | 64 | 0.90% | 1.23% | 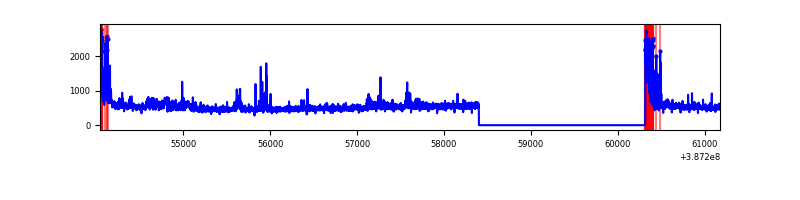 |
| D | 7130 | 5218 | 259 | 259 | 3.63% | 4.96% | 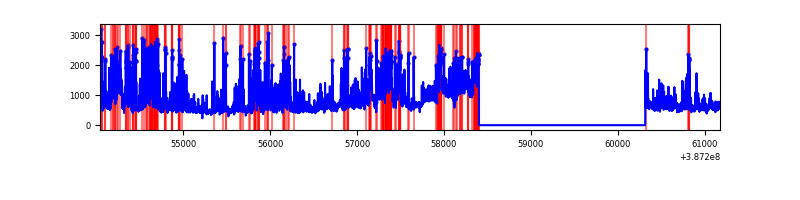 |
Top three noisy pixels from each quadrant. If the there are fewer than three noisy pixels in the level2.evt file, extra rows are filled as -1
| Pixel properties | Quadrant properties | ||||||
|---|---|---|---|---|---|---|---|
| Quadrant | DetID | PixID | Counts | Sigma | Mean | Median | Sigma |
| A | 10 | 83 | 95035 | 756.18 | 628 | 618 | 124.9 |
| A | 9 | 143 | 42367 | 334.37 | 628 | 618 | 124.9 |
| A | 15 | 169 | 39047 | 307.78 | 628 | 618 | 124.9 |
| B | 5 | 236 | 1860228 | 16143.24 | 604 | 589 | 115.2 |
| B | 5 | 172 | 402231 | 3486.59 | 604 | 589 | 115.2 |
| B | 4 | 232 | 14608 | 121.7 | 604 | 589 | 115.2 |
| C | 0 | 10 | 294611 | 2125.64 | 601 | 603 | 138.3 |
| C | 15 | 214 | 216283 | 1559.34 | 601 | 603 | 138.3 |
| C | 15 | 159 | 75247 | 539.67 | 601 | 603 | 138.3 |
| D | 12 | 235 | 740118 | 5125.32 | 595 | 579 | 144.3 |
| D | 7 | 80 | 710956 | 4923.21 | 595 | 579 | 144.3 |
| D | 8 | 195 | 416953 | 2885.65 | 595 | 579 | 144.3 |
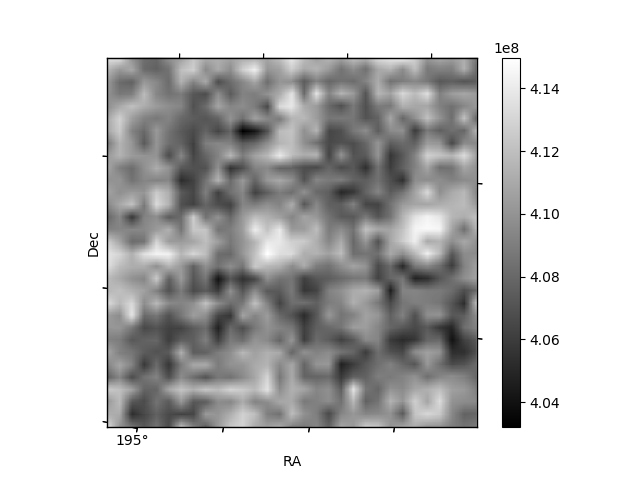
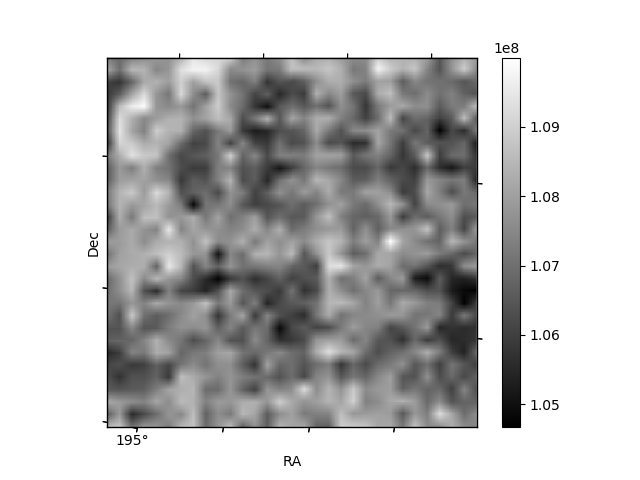
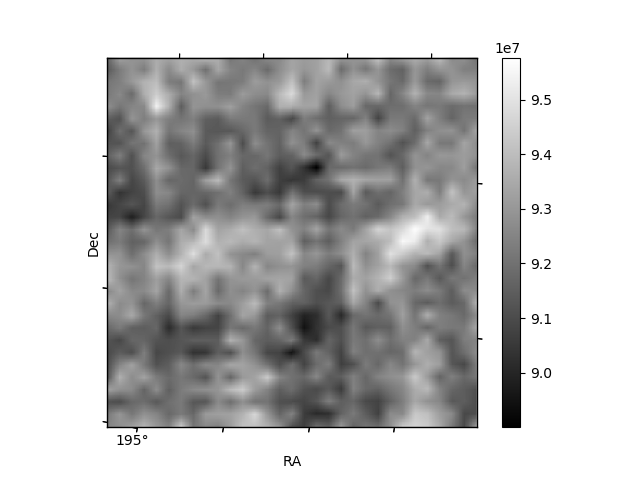
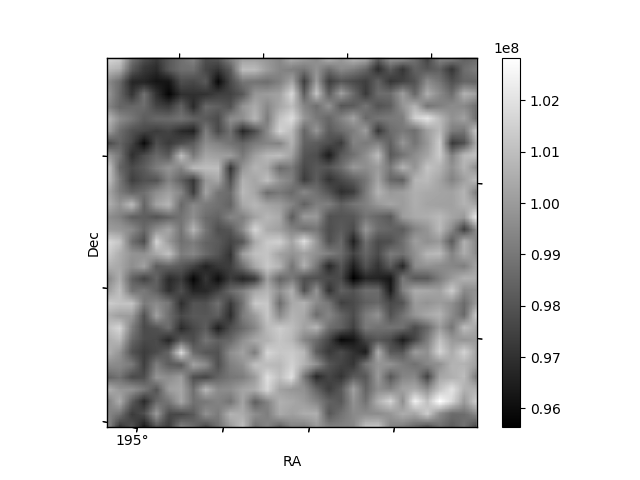
Histogram calculated using DETX and DETY for each event in the final _common_clean file
| Quadrant A | 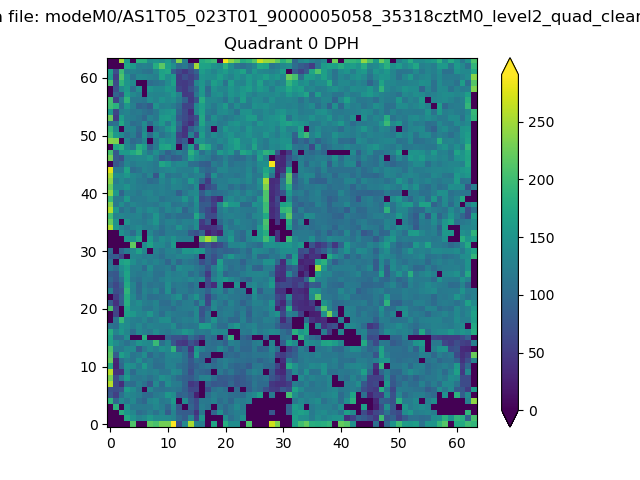 |
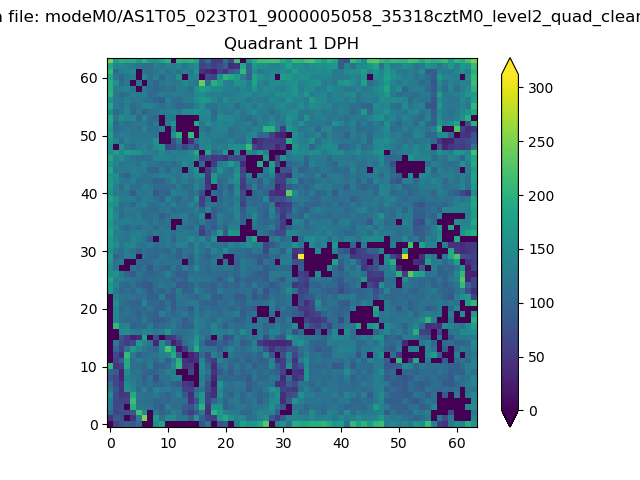 |
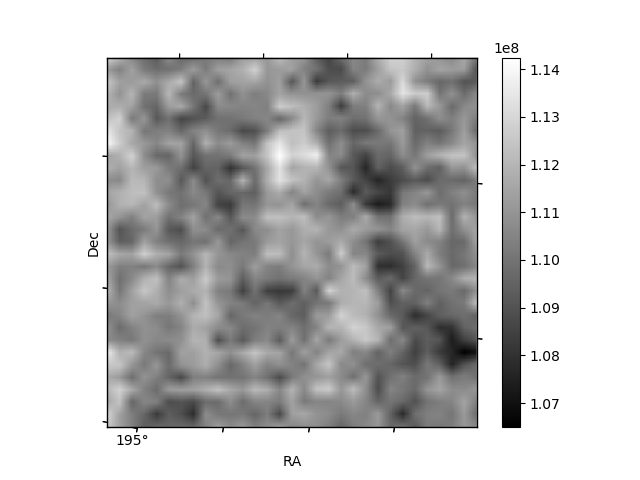
Quadrant B |
|---|---|---|---|
| Quadrant D | 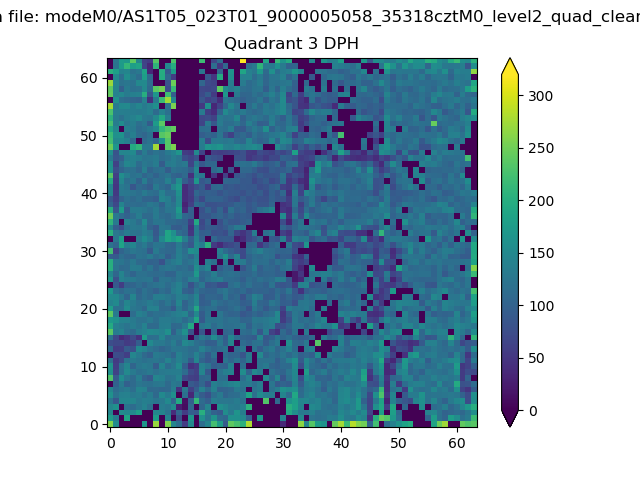 |
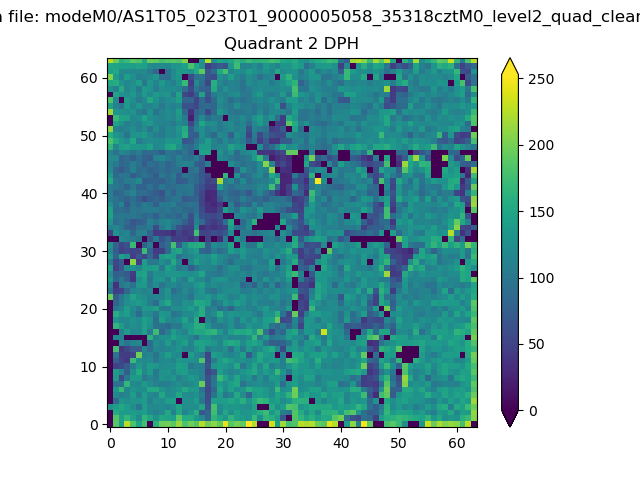 |
Quadrant C |
| Plot type | Count rate plots | Images |
|---|---|---|
| Comparison with Poisson distribution Blue bars denote a histogram of data divided into 1 sec bins. Red curve is a Poisson curve with rate = median count rate of data. |
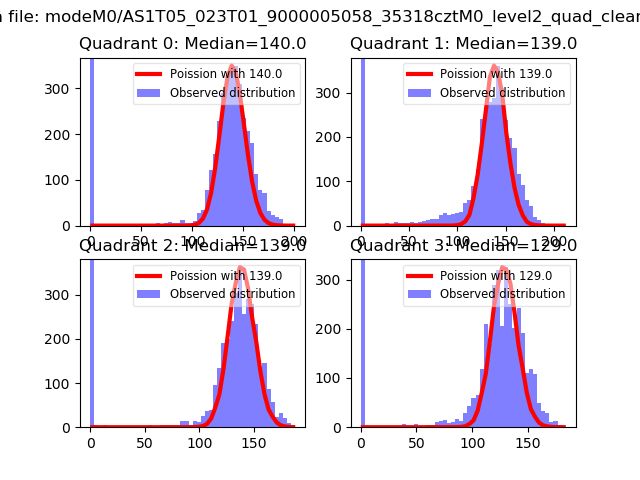 |
 |
| Quadrant-wise count rates Data is divided into 100 sec bins |
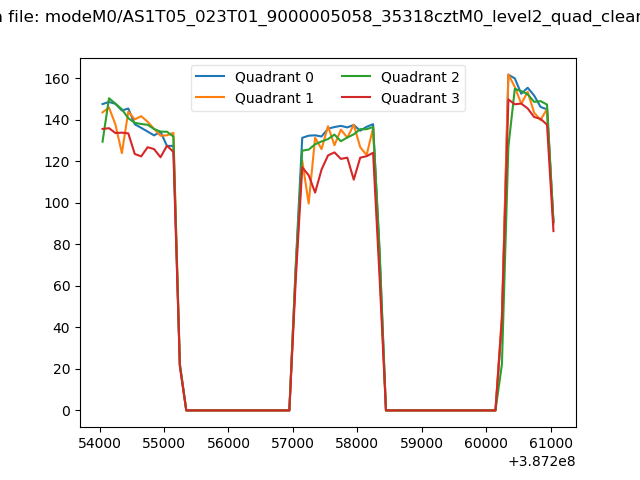 |
|
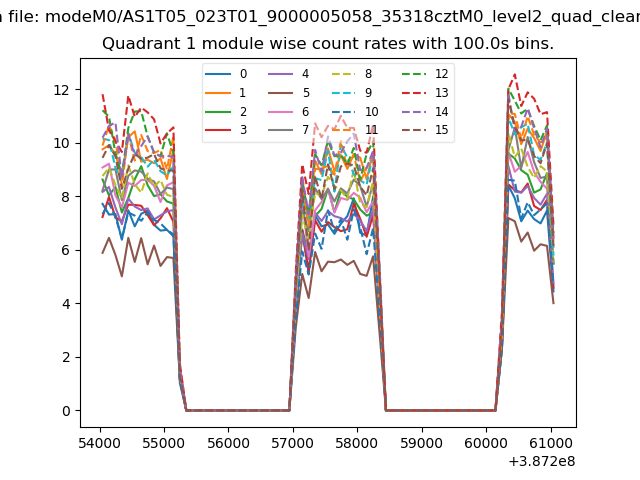
| Module-wise count rates for Quadrant A Data is divided into 100 sec bins |
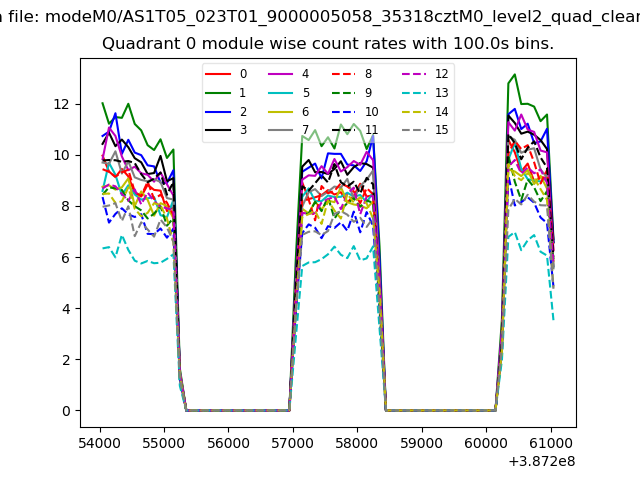 |
 |
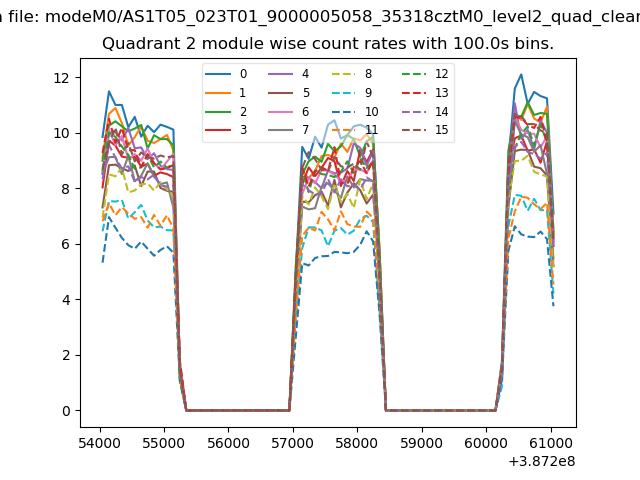
| Module-wise count rates for Quadrant B Data is divided into 100 sec bins |
 |
 |
| Module-wise count rates for Quadrant C Data is divided into 100 sec bins |
 |
 |
| Module-wise count rates for Quadrant D Data is divided into 100 sec bins |
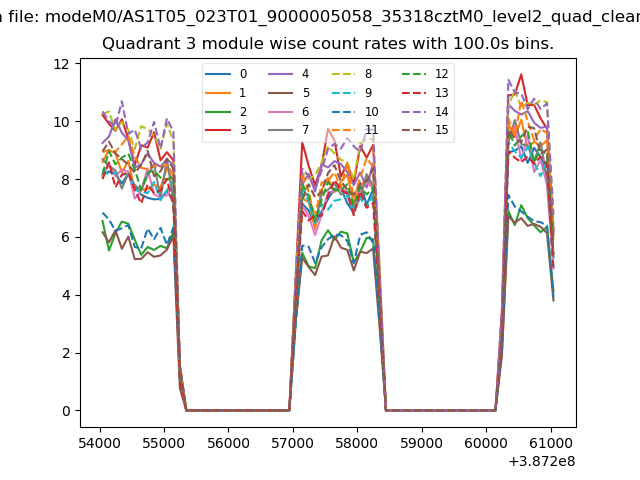 |
 |
| Parameter | Plot |
|---|---|
| CZT HV Monitor | 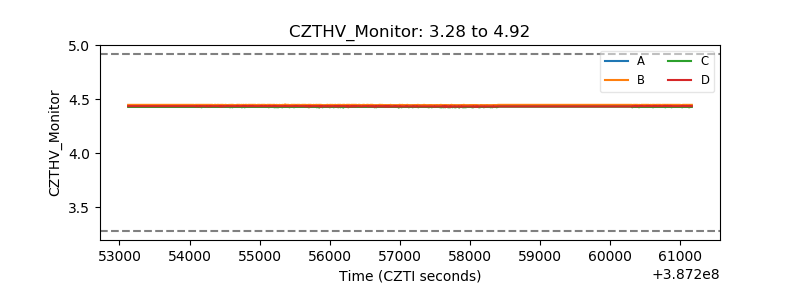 |
| D_VDD | 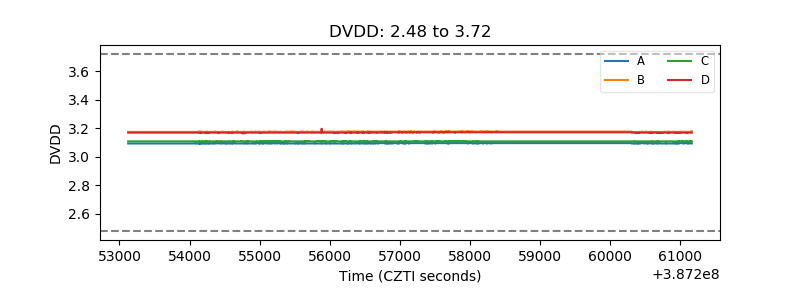 |
| Temperature 1 | 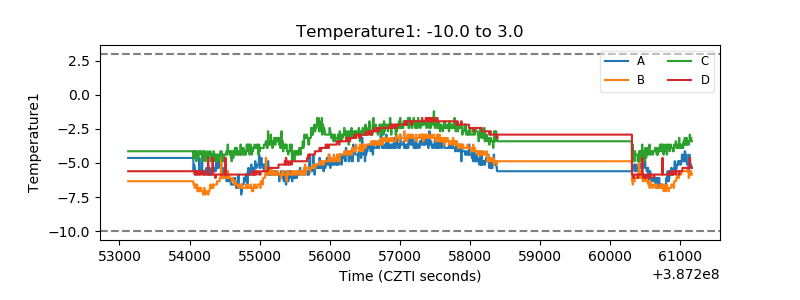 |
| Veto HV Monitor | 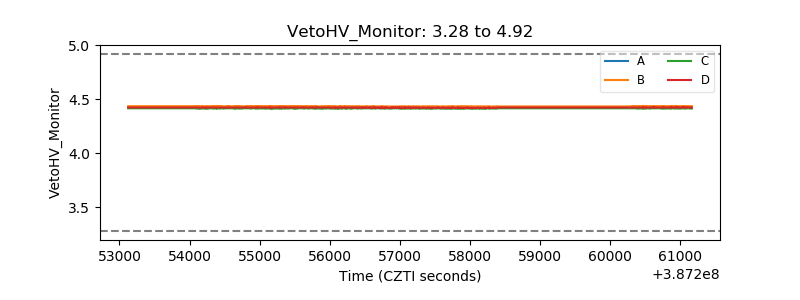 |
| Veto LLD | 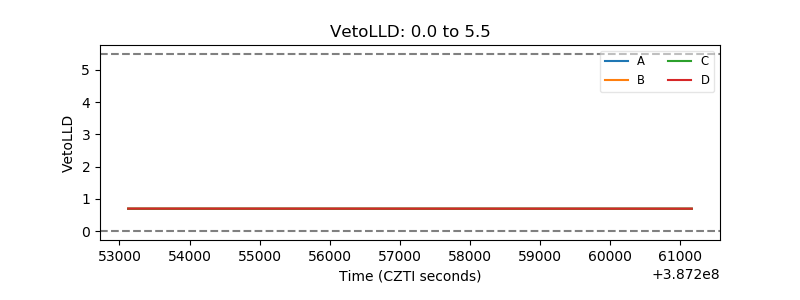 |
| Alpha Counter | 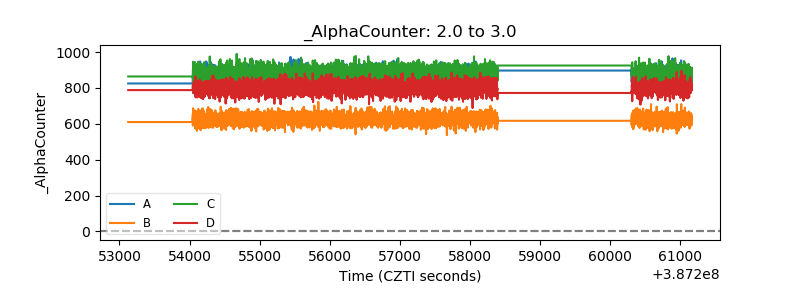 |
| _CPM_Rate | 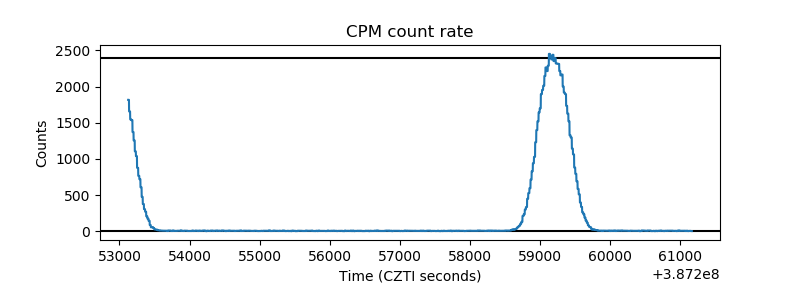 |
| CZT Counter | 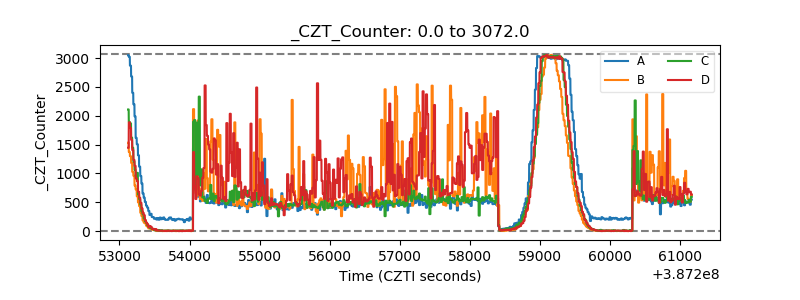 |
| +2.5 Volts monitor | 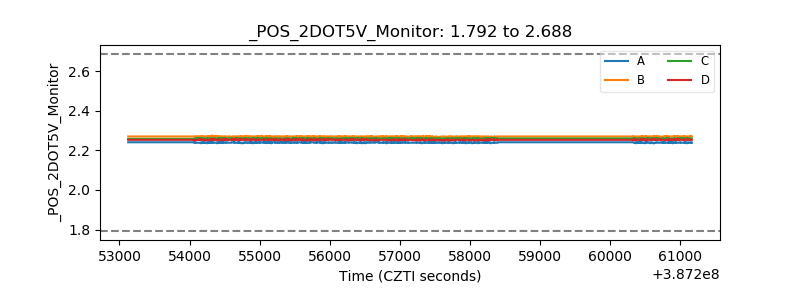 |
| +5 Volts monitor | 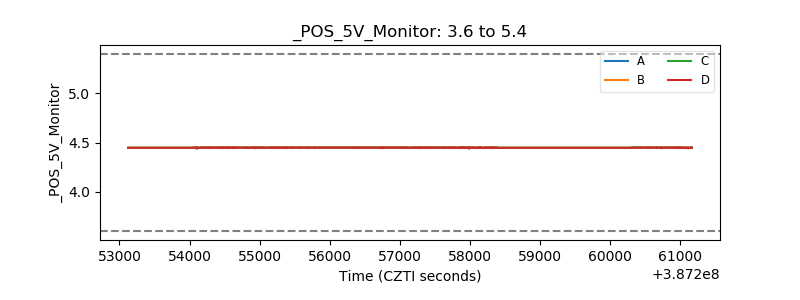 |
| _ROLL_ROT | 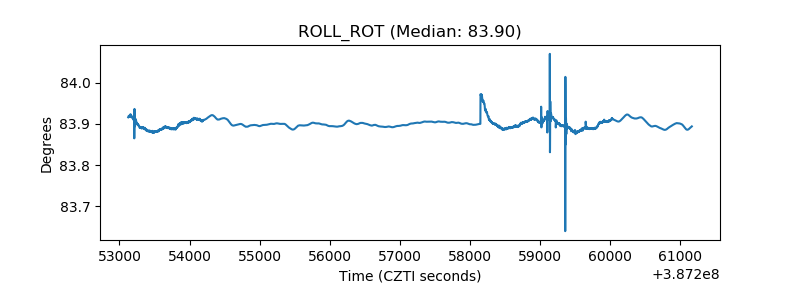 |
| _Roll_DEC | 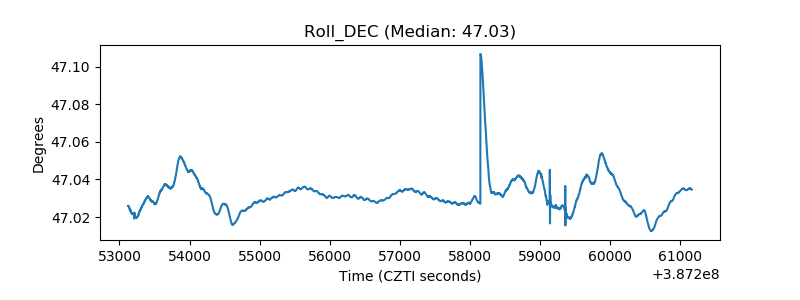 |
| _Roll_RA | 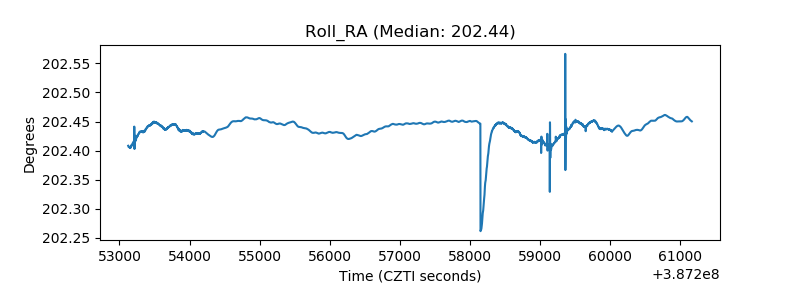 |
| Veto Counter | 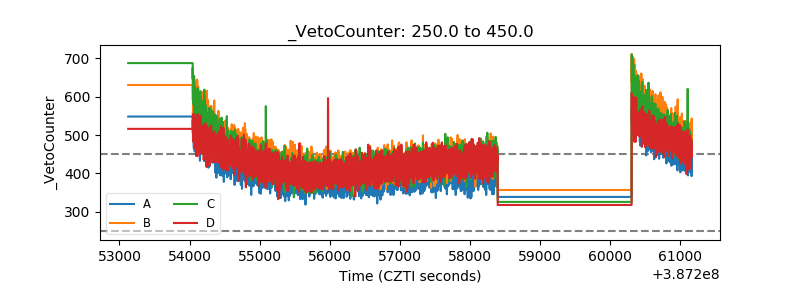 |