| Param | Original file | Final file |
|---|---|---|
| Filename | modeM0/AS1T05_023T01_9000005058_35303cztM0_level2.evt | modeM0/AS1T05_023T01_9000005058_35303cztM0_level2_quad_clean.evt |
| Size (bytes) | 551,234,880 | 68,581,440 |
| Size | 525.7 MB | 65.4 MB |
| Events in quadrant A | 2,828,187 | 462,747 |
| Events in quadrant B | 7,317,909 | 348,003 |
| Events in quadrant C | 3,050,242 | 459,354 |
| Events in quadrant D | 3,142,376 | 438,546 |
| Mode M0 | |||
|---|---|---|---|
| Quadrant | BADHDUFLAG | Total packets | Discarded packets |
| A | 0 | 11835 | 3 |
| B | 0 | 25342 | 2 |
| C | 0 | 12154 | 2 |
| D | 0 | 12821 | 2 |
| Mode M9 | |||
|---|---|---|---|
| Quadrant | BADHDUFLAG | Total packets | Discarded packets |
| A | 0 | 27 | 0 |
| B | 0 | 27 | 0 |
| C | 0 | 27 | 0 |
| D | 0 | 28 | 0 |
| Mode SS | |||
|---|---|---|---|
| Quadrant | BADHDUFLAG | Total packets | Discarded packets |
| A | 0 | 106 | 0 |
| B | 0 | 106 | 0 |
| C | 0 | 106 | 0 |
| D | 0 | 106 | 0 |
| Quadrant | Total seconds | Saturated seconds | Saturation percentage |
|---|---|---|---|
| A | 5243 | 13 | 0.247950% |
| B | 5243 | 1957 | 37.325958% |
| C | 5243 | 82 | 1.563990% |
| D | 5243 | 136 | 2.593935% |
Noise dominated data is calculated using 1-second bins in cleaned event files. If a bin has >2000 counts, and if more than 50% of those come from <1% of pixels, then it is considered to be noise-dominated and hence unusable.
| Quadrant | # 1 sec bins | Bins with >0 counts | Bins with >2000 counts | High rate bins dominated by noise | Noise dominated (total time) | Noise dominated (detector-on time) | Marked lightcurve |
|---|---|---|---|---|---|---|---|
| A | 7126 | 5244 | 9 | 9 | 0.13% | 0.17% | 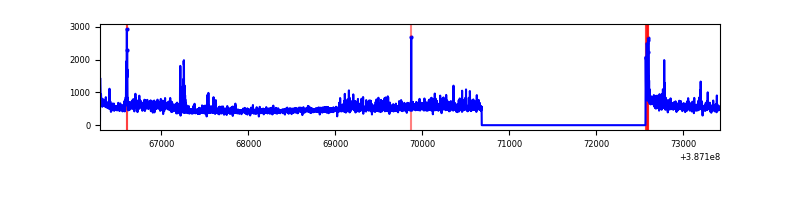 |
| B | 7126 | 5244 | 1549 | 1549 | 21.74% | 29.54% | 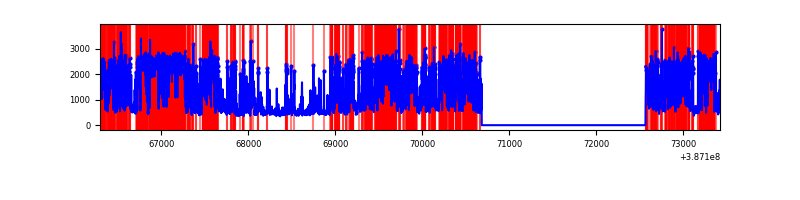 |
| C | 7126 | 5244 | 73 | 73 | 1.02% | 1.39% | 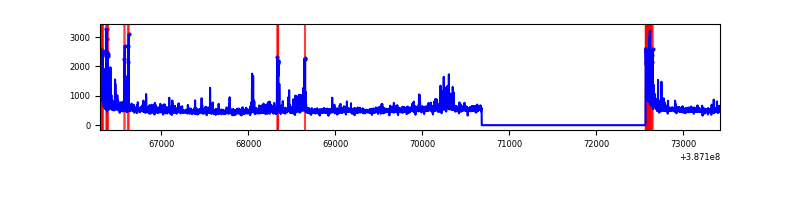 |
| D | 7126 | 5244 | 105 | 105 | 1.47% | 2.00% | 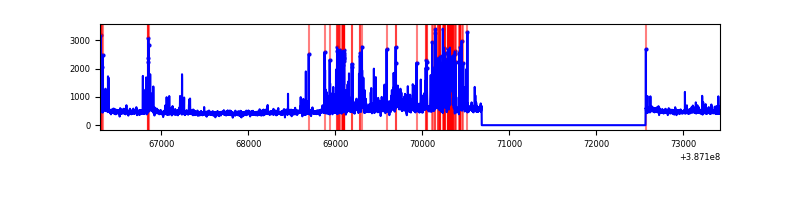 |
Top three noisy pixels from each quadrant. If the there are fewer than three noisy pixels in the level2.evt file, extra rows are filled as -1
| Pixel properties | Quadrant properties | ||||||
|---|---|---|---|---|---|---|---|
| Quadrant | DetID | PixID | Counts | Sigma | Mean | Median | Sigma |
| A | 15 | 169 | 285054 | 2252.35 | 622 | 611 | 126.3 |
| A | 10 | 83 | 94569 | 744.0 | 622 | 611 | 126.3 |
| A | 7 | 16 | 27553 | 213.34 | 622 | 611 | 126.3 |
| B | 5 | 236 | 3073714 | 31156.68 | 515 | 501 | 98.6 |
| B | 5 | 172 | 2203704 | 22336.4 | 515 | 501 | 98.6 |
| B | 4 | 232 | 13091 | 127.64 | 515 | 501 | 98.6 |
| C | 0 | 10 | 464347 | 3393.47 | 597 | 603 | 136.7 |
| C | 15 | 214 | 220002 | 1605.47 | 597 | 603 | 136.7 |
| C | 3 | 233 | 33792 | 242.86 | 597 | 603 | 136.7 |
| D | 7 | 80 | 439469 | 3047.75 | 594 | 577 | 144.0 |
| D | 8 | 195 | 171023 | 1183.61 | 594 | 577 | 144.0 |
| D | 13 | 249 | 159371 | 1102.69 | 594 | 577 | 144.0 |
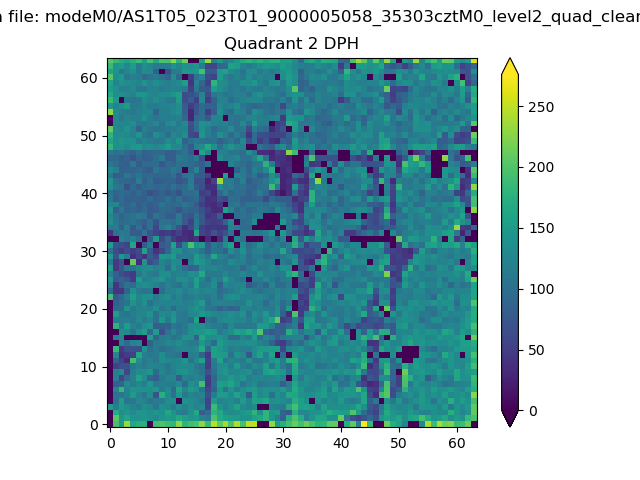
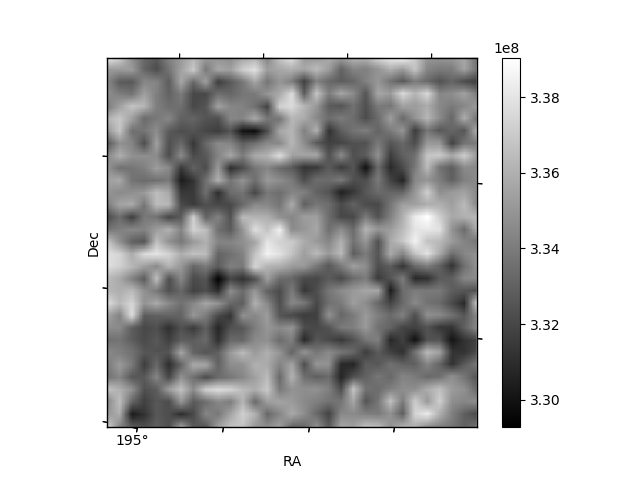
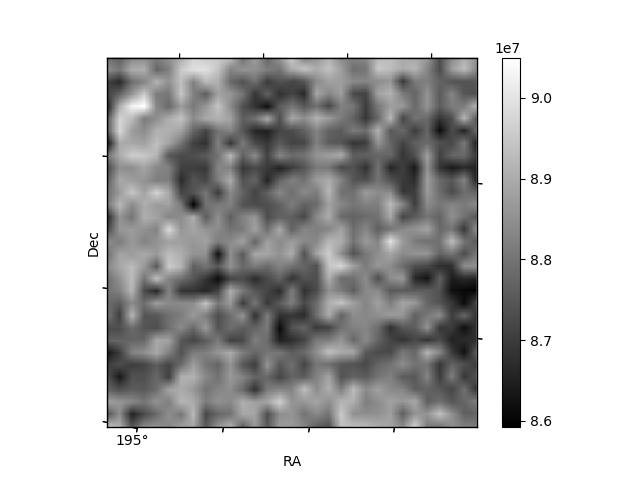
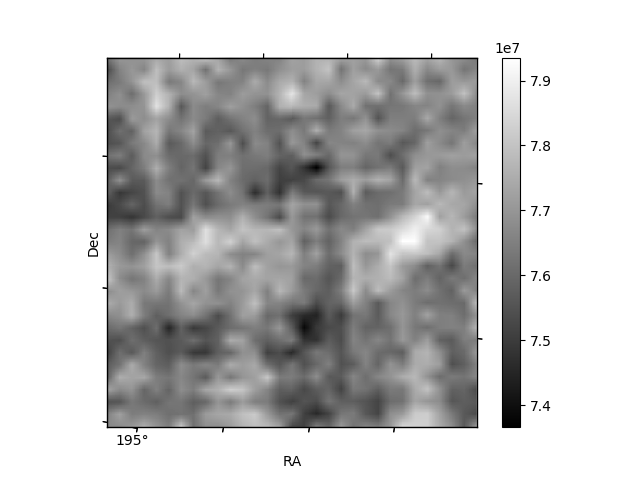
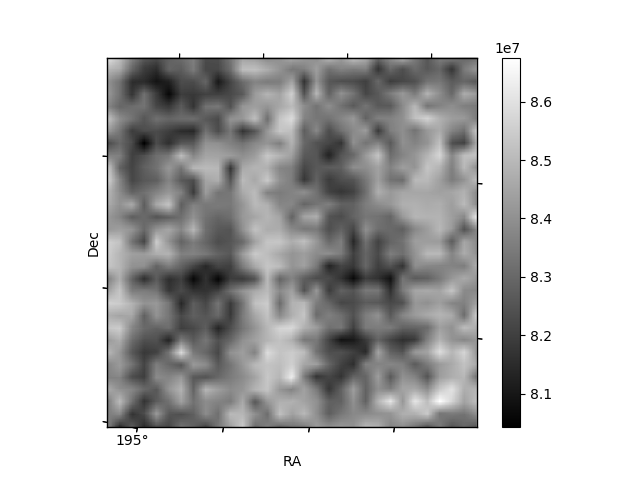
Histogram calculated using DETX and DETY for each event in the final _common_clean file
| Quadrant A | 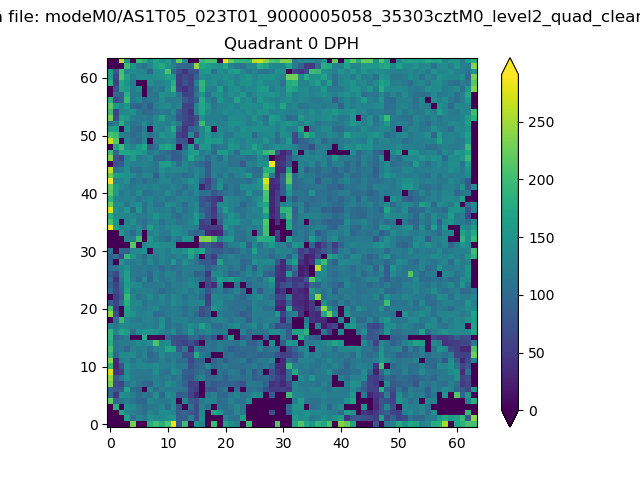 |
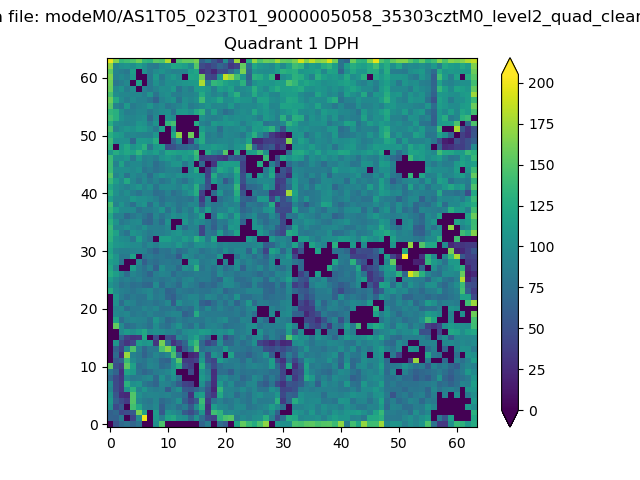 |
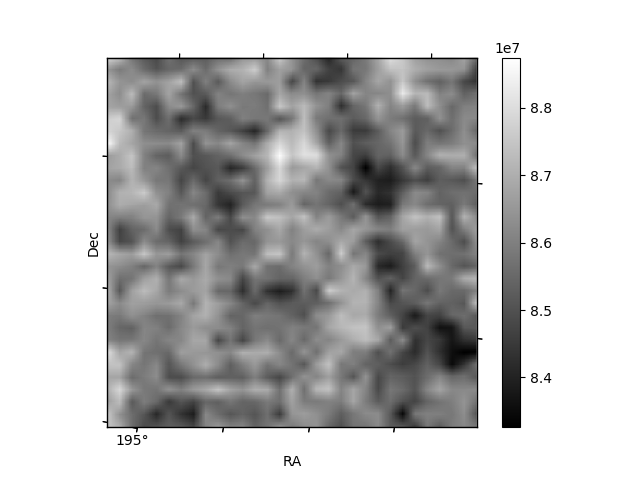
Quadrant B |
|---|---|---|---|
| Quadrant D | 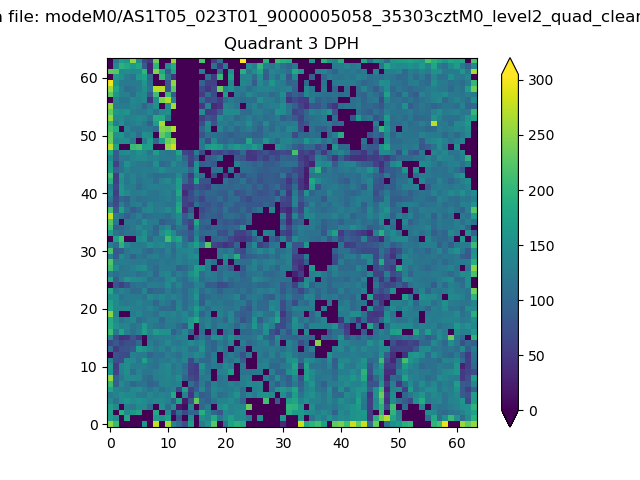 |
 |
Quadrant C |
| Plot type | Count rate plots | Images |
|---|---|---|
| Comparison with Poisson distribution Blue bars denote a histogram of data divided into 1 sec bins. Red curve is a Poisson curve with rate = median count rate of data. |
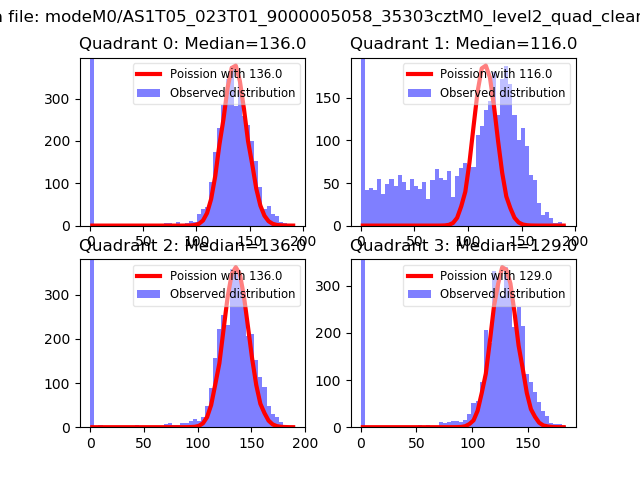 |
 |
| Quadrant-wise count rates Data is divided into 100 sec bins |
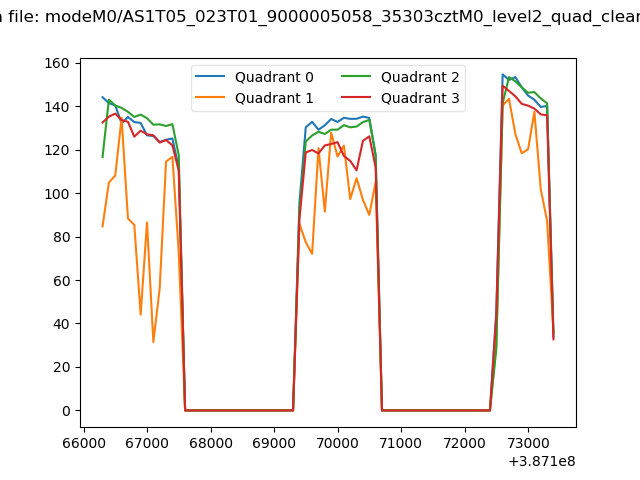 |
|
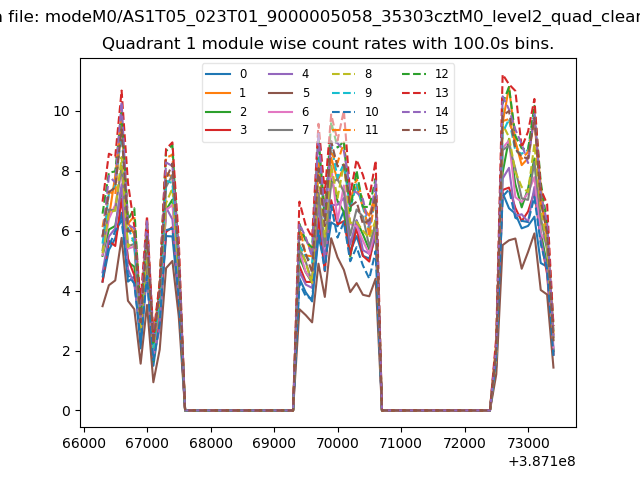
| Module-wise count rates for Quadrant A Data is divided into 100 sec bins |
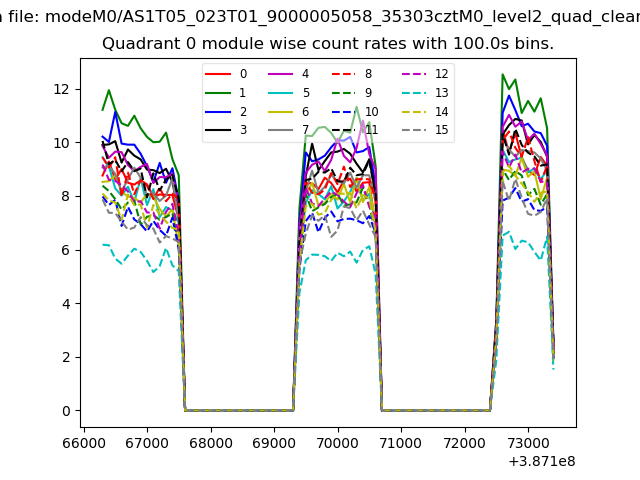 |
 |
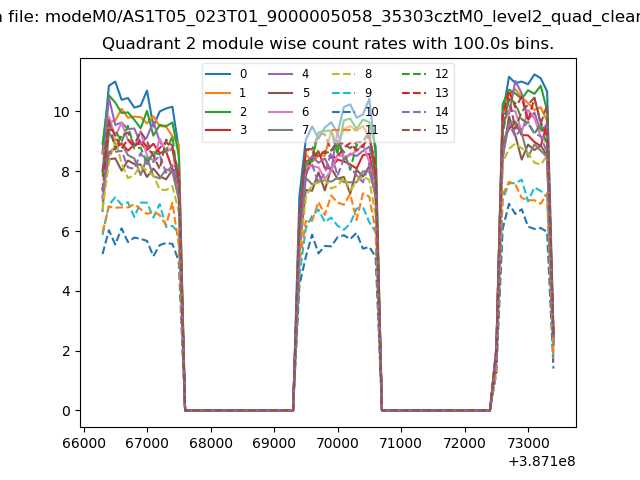
| Module-wise count rates for Quadrant B Data is divided into 100 sec bins |
 |
 |
| Module-wise count rates for Quadrant C Data is divided into 100 sec bins |
 |
 |
| Module-wise count rates for Quadrant D Data is divided into 100 sec bins |
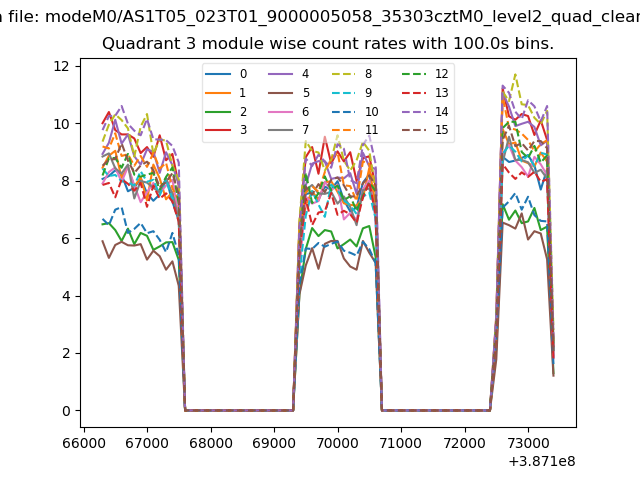 |
 |
| Parameter | Plot |
|---|---|
| CZT HV Monitor | 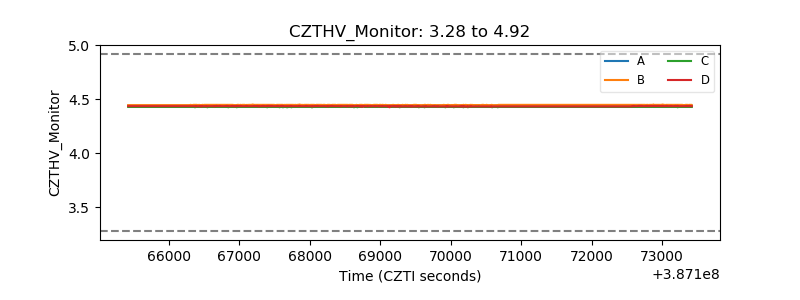 |
| D_VDD | 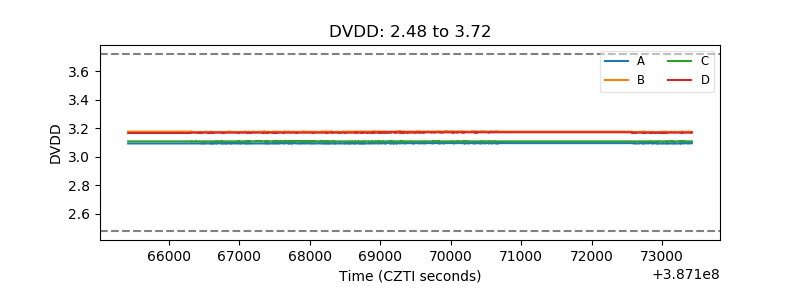 |
| Temperature 1 | 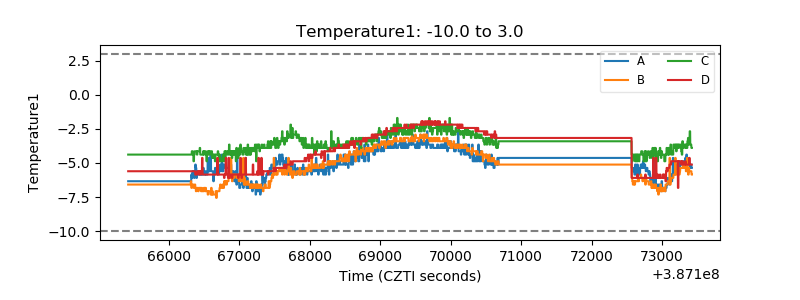 |
| Veto HV Monitor | 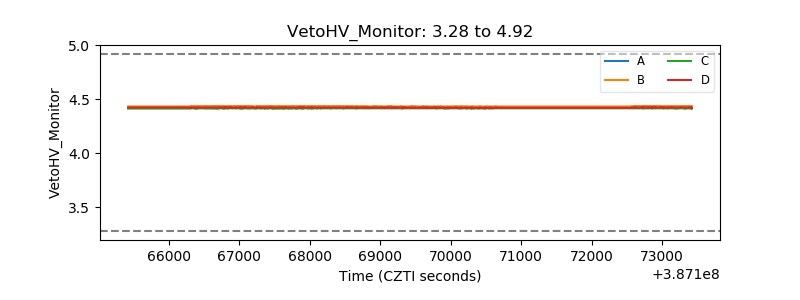 |
| Veto LLD | 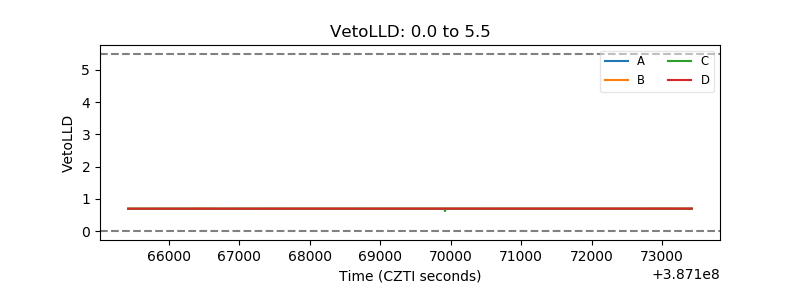 |
| Alpha Counter | 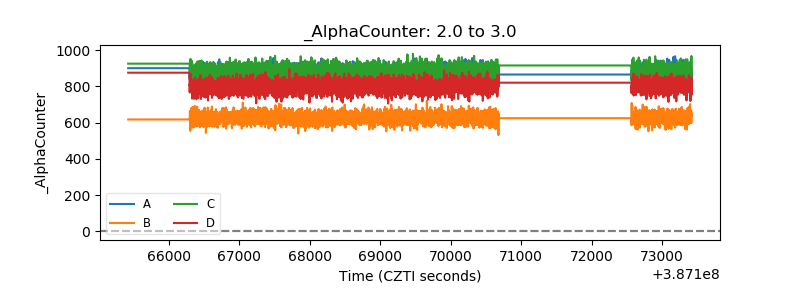 |
| _CPM_Rate | 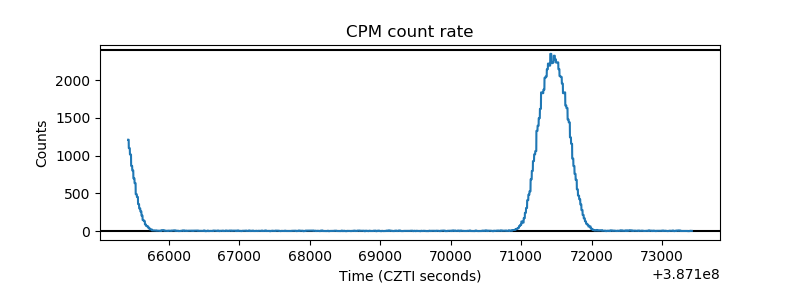 |
| CZT Counter | 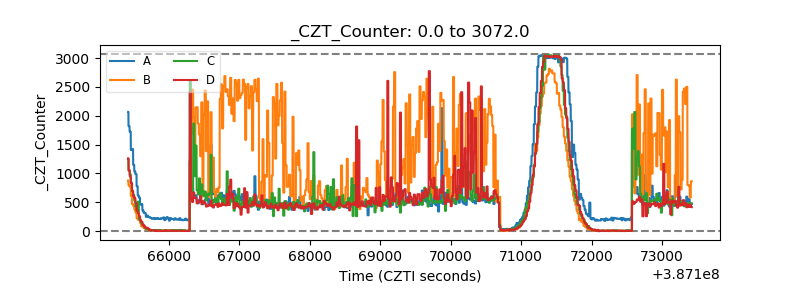 |
| +2.5 Volts monitor | 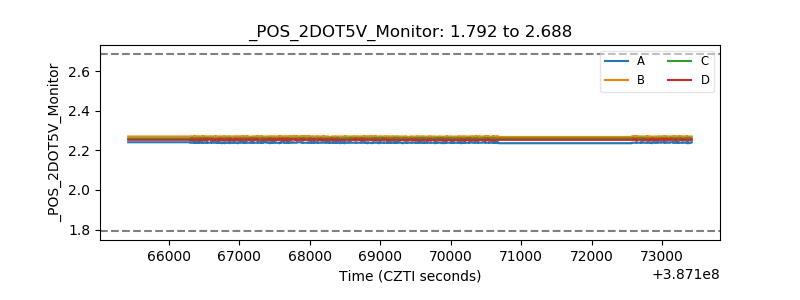 |
| +5 Volts monitor | 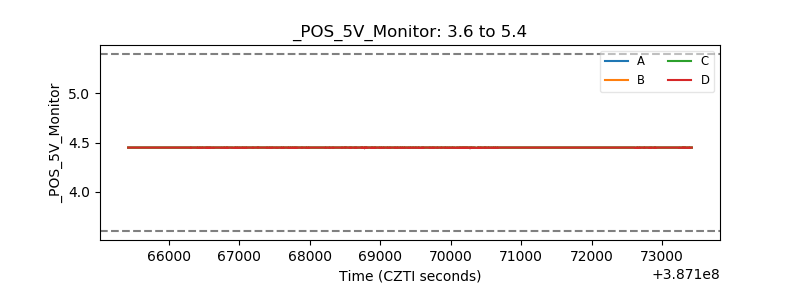 |
| _ROLL_ROT | 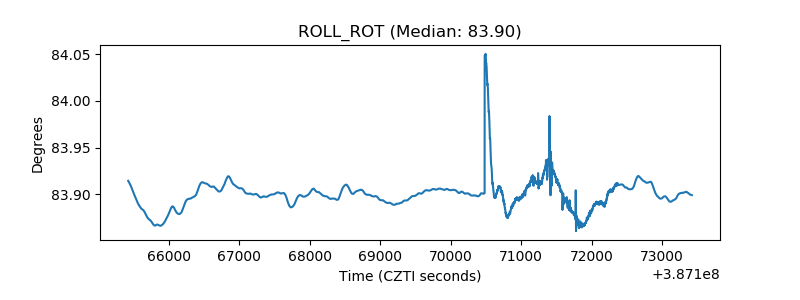 |
| _Roll_DEC | 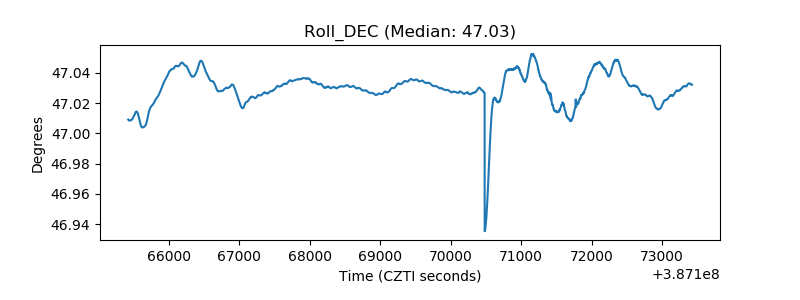 |
| _Roll_RA | 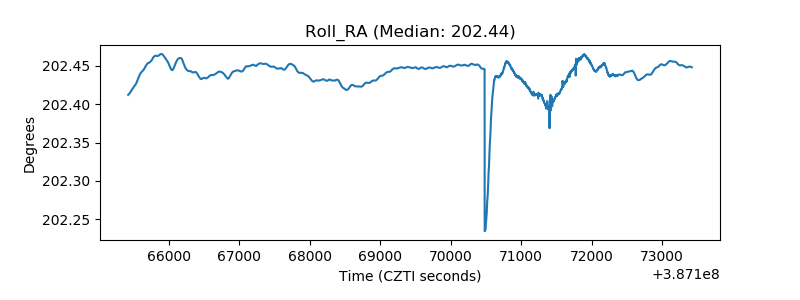 |
| Veto Counter | 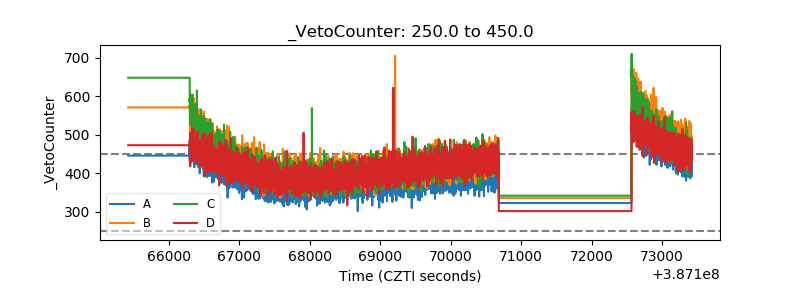 |