| Param | Original file | Final file |
|---|---|---|
| Filename | modeM0/AS1A11_082T01_9000005056_35300cztM0_level2.evt | modeM0/AS1A11_082T01_9000005056_35300cztM0_level2_quad_clean.evt |
| Size (bytes) | 640,200,960 | 75,706,560 |
| Size | 610.5 MB | 72.2 MB |
| Events in quadrant A | 3,410,528 | 502,677 |
| Events in quadrant B | 6,424,015 | 486,220 |
| Events in quadrant C | 3,441,802 | 497,708 |
| Events in quadrant D | 5,740,501 | 420,557 |
| Mode M0 | |||
|---|---|---|---|
| Quadrant | BADHDUFLAG | Total packets | Discarded packets |
| A | 0 | 13882 | 3 |
| B | 0 | 22856 | 2 |
| C | 0 | 13540 | 2 |
| D | 0 | 20737 | 2 |
| Mode SS | |||
|---|---|---|---|
| Quadrant | BADHDUFLAG | Total packets | Discarded packets |
| A | 0 | 110 | 0 |
| B | 0 | 110 | 0 |
| C | 0 | 110 | 0 |
| D | 0 | 110 | 0 |
| Mode M9 | |||
|---|---|---|---|
| Quadrant | BADHDUFLAG | Total packets | Discarded packets |
| A | 0 | 30 | 0 |
| B | 0 | 30 | 0 |
| C | 0 | 30 | 0 |
| D | 0 | 31 | 0 |
| Quadrant | Total seconds | Saturated seconds | Saturation percentage |
|---|---|---|---|
| A | 5505 | 61 | 1.108084% |
| B | 5505 | 1281 | 23.269755% |
| C | 5505 | 176 | 3.197094% |
| D | 5505 | 1021 | 18.546776% |
Noise dominated data is calculated using 1-second bins in cleaned event files. If a bin has >2000 counts, and if more than 50% of those come from <1% of pixels, then it is considered to be noise-dominated and hence unusable.
| Quadrant | # 1 sec bins | Bins with >0 counts | Bins with >2000 counts | High rate bins dominated by noise | Noise dominated (total time) | Noise dominated (detector-on time) | Marked lightcurve |
|---|---|---|---|---|---|---|---|
| A | 7118 | 5506 | 46 | 46 | 0.65% | 0.84% | 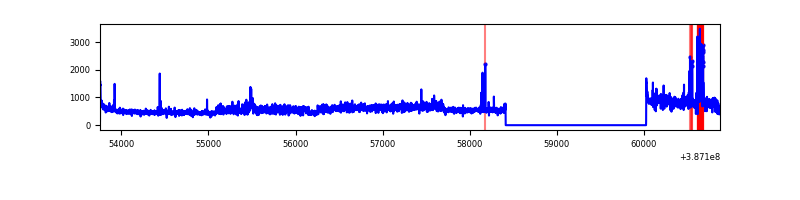 |
| B | 7118 | 5506 | 920 | 920 | 12.92% | 16.71% | 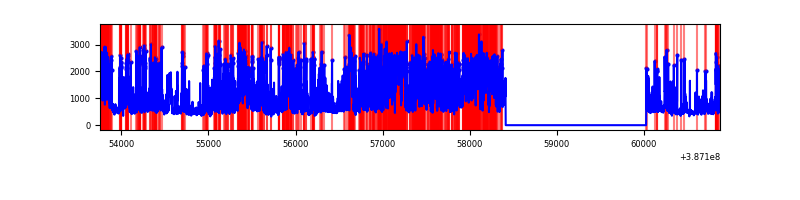 |
| C | 7118 | 5506 | 150 | 150 | 2.11% | 2.72% |  |
| D | 7118 | 5506 | 921 | 921 | 12.94% | 16.73% | 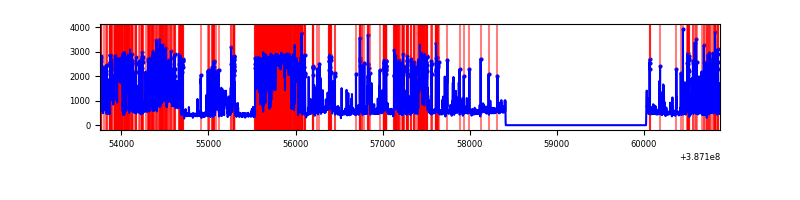 |
Top three noisy pixels from each quadrant. If the there are fewer than three noisy pixels in the level2.evt file, extra rows are filled as -1
| Pixel properties | Quadrant properties | ||||||
|---|---|---|---|---|---|---|---|
| Quadrant | DetID | PixID | Counts | Sigma | Mean | Median | Sigma |
| A | 15 | 169 | 705819 | 5529.45 | 630 | 617 | 127.5 |
| A | 7 | 16 | 133158 | 1039.25 | 630 | 617 | 127.5 |
| A | 10 | 83 | 98039 | 763.88 | 630 | 617 | 127.5 |
| B | 5 | 236 | 3208539 | 28968.54 | 579 | 565 | 110.7 |
| B | 5 | 172 | 895354 | 8080.09 | 579 | 565 | 110.7 |
| B | 0 | 190 | 25753 | 227.45 | 579 | 565 | 110.7 |
| C | 0 | 10 | 499537 | 3462.34 | 615 | 619 | 144.1 |
| C | 9 | 69 | 228845 | 1583.82 | 615 | 619 | 144.1 |
| C | 15 | 214 | 227417 | 1573.91 | 615 | 619 | 144.1 |
| D | 7 | 80 | 2700601 | 19525.63 | 565 | 550 | 138.3 |
| D | 13 | 249 | 508209 | 3671.18 | 565 | 550 | 138.3 |
| D | 8 | 195 | 154713 | 1114.84 | 565 | 550 | 138.3 |
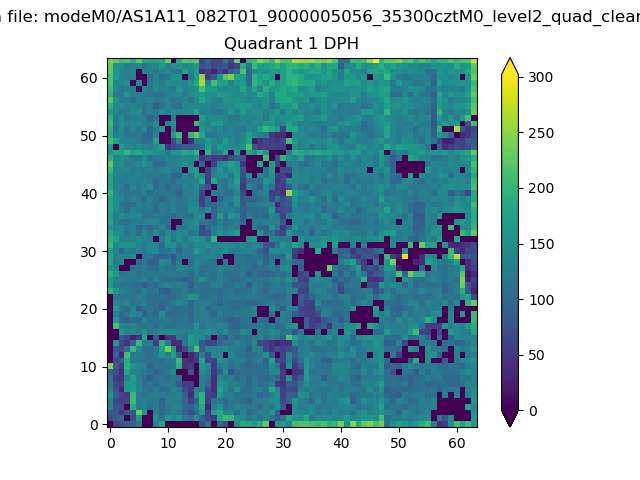
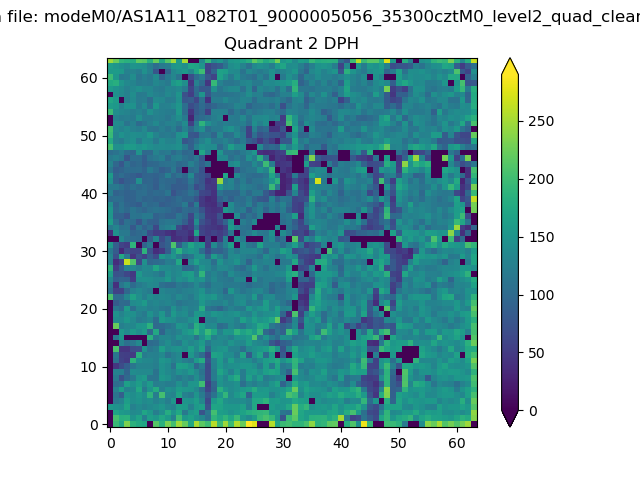
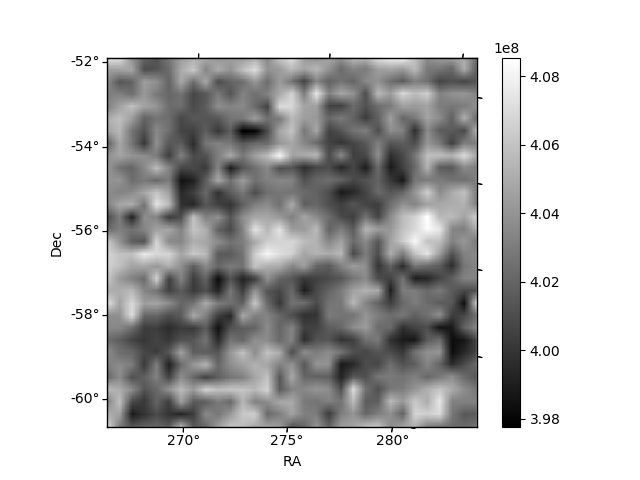
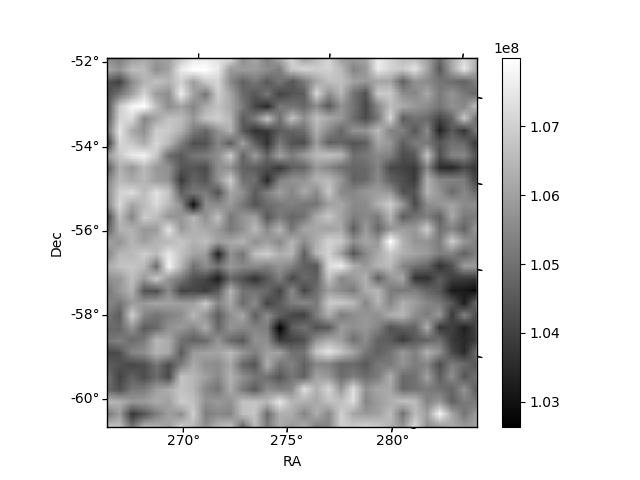
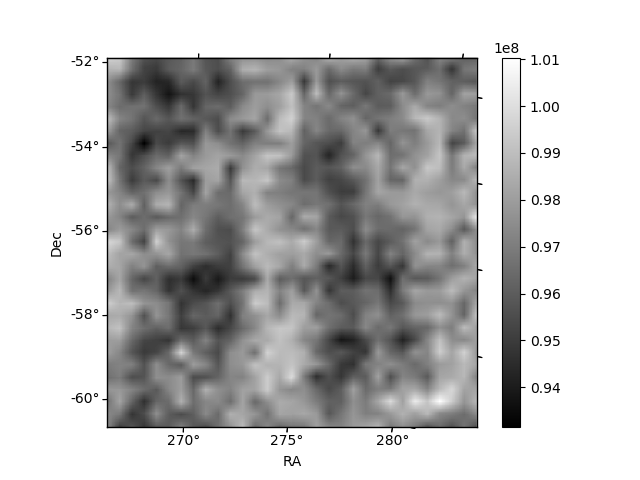
Histogram calculated using DETX and DETY for each event in the final _common_clean file
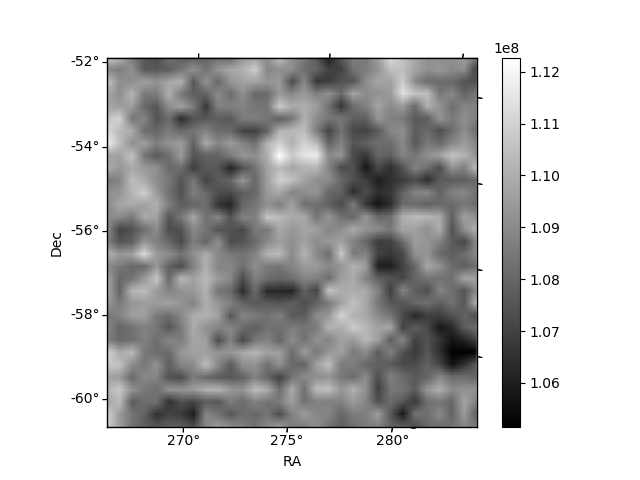
| Quadrant A | 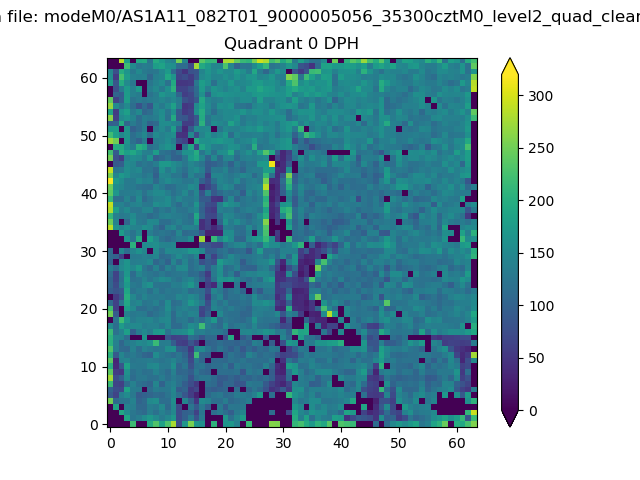 |
 |
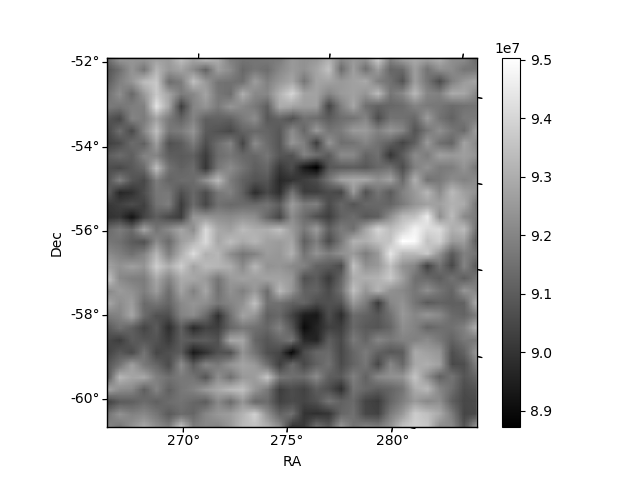
Quadrant B |
|---|---|---|---|
| Quadrant D | 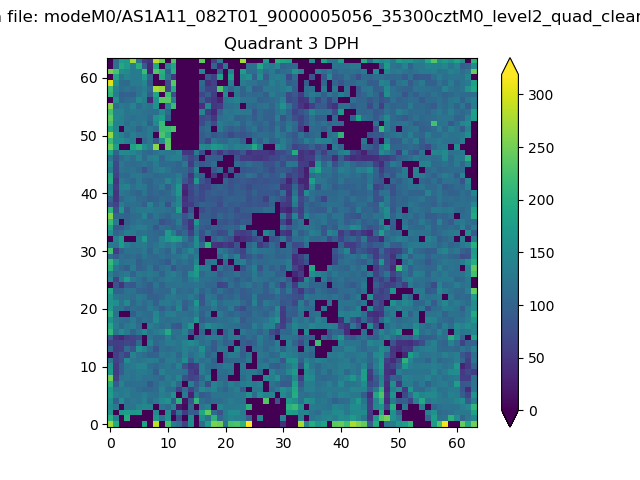 |
 |
Quadrant C |
| Plot type | Count rate plots | Images |
|---|---|---|
| Comparison with Poisson distribution Blue bars denote a histogram of data divided into 1 sec bins. Red curve is a Poisson curve with rate = median count rate of data. |
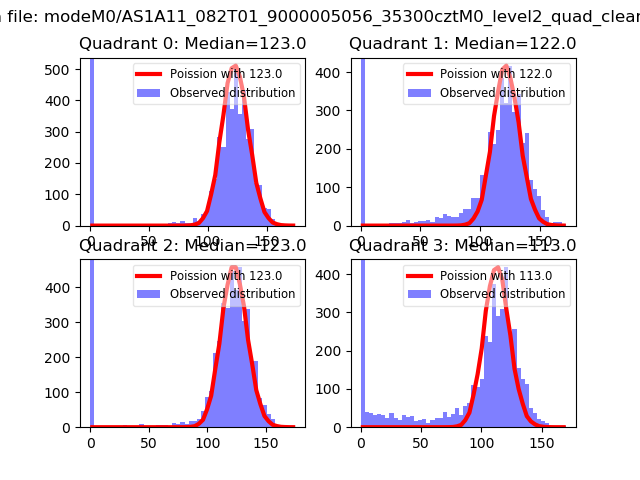 |
 |
| Quadrant-wise count rates Data is divided into 100 sec bins |
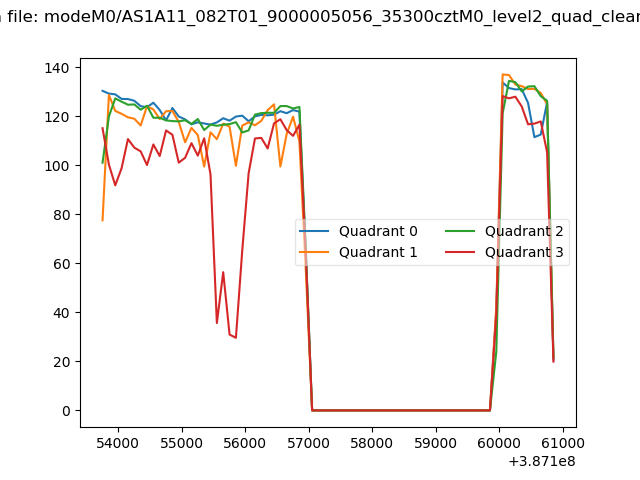 |
|
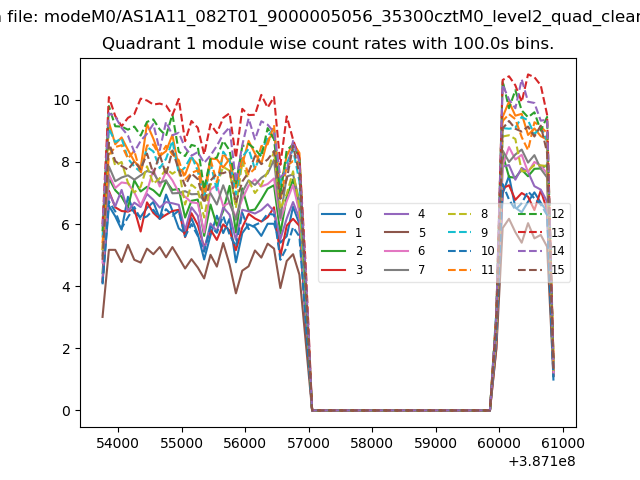
| Module-wise count rates for Quadrant A Data is divided into 100 sec bins |
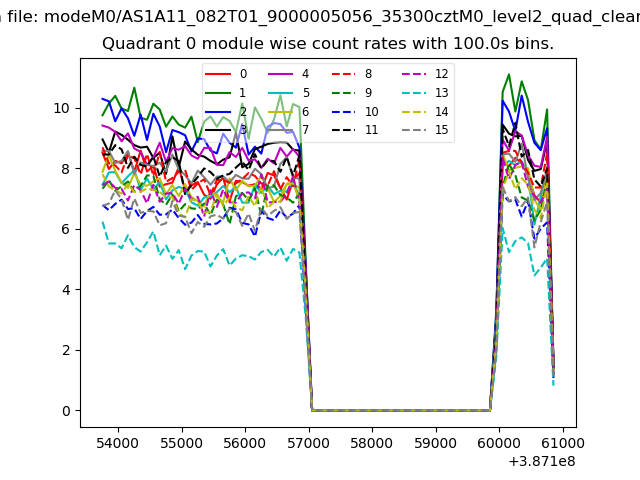 |
 |
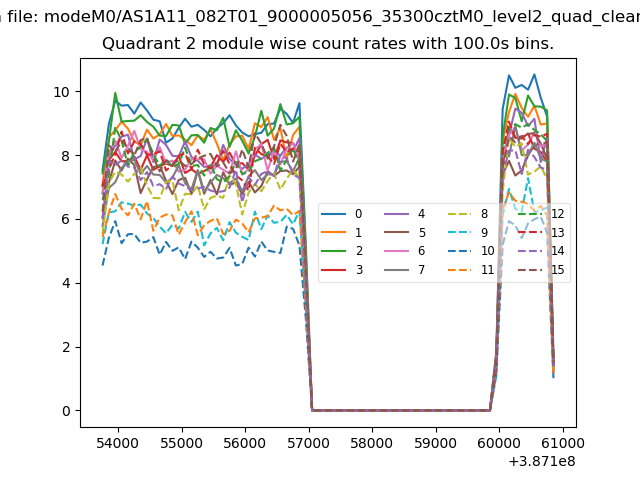
| Module-wise count rates for Quadrant B Data is divided into 100 sec bins |
 |
 |
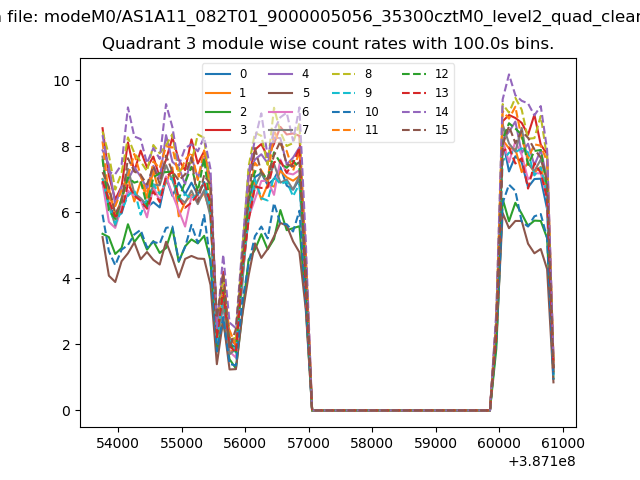
| Module-wise count rates for Quadrant C Data is divided into 100 sec bins |
 |
 |
| Module-wise count rates for Quadrant D Data is divided into 100 sec bins |
 |
 |
| Parameter | Plot |
|---|---|
| CZT HV Monitor | 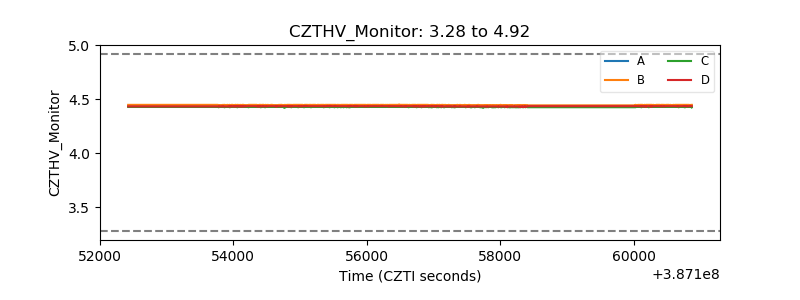 |
| D_VDD | 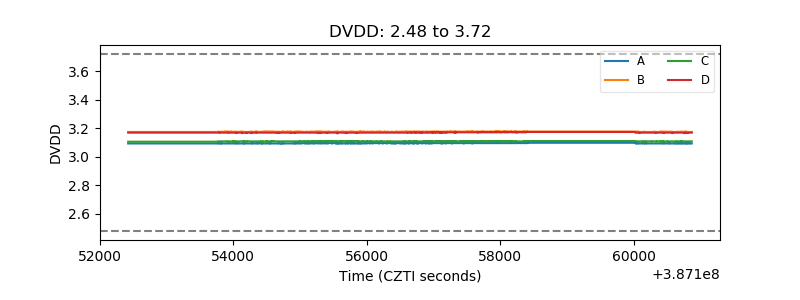 |
| Temperature 1 | 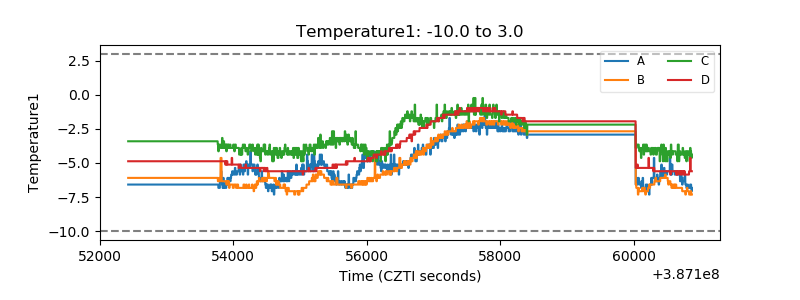 |
| Veto HV Monitor | 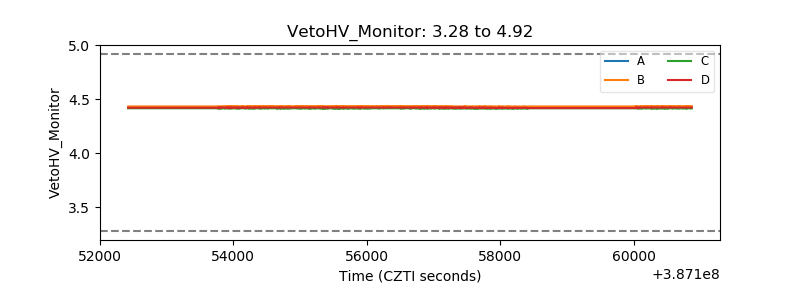 |
| Veto LLD | 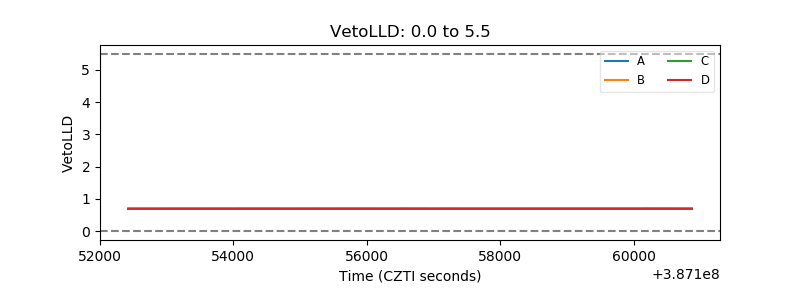 |
| Alpha Counter | 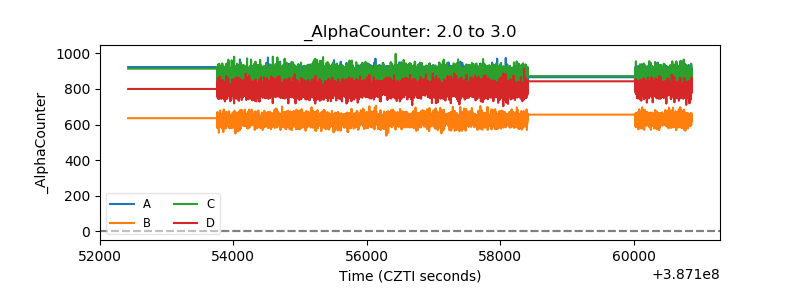 |
| _CPM_Rate | 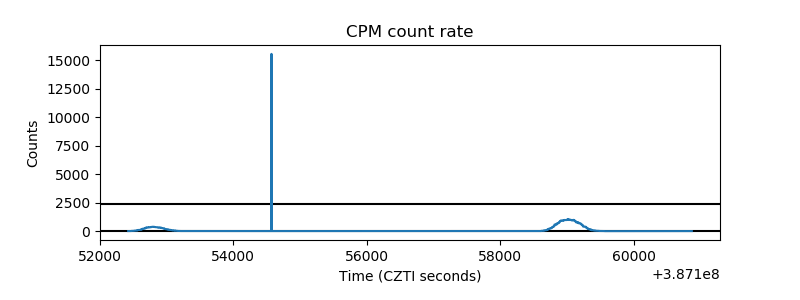 |
| CZT Counter | 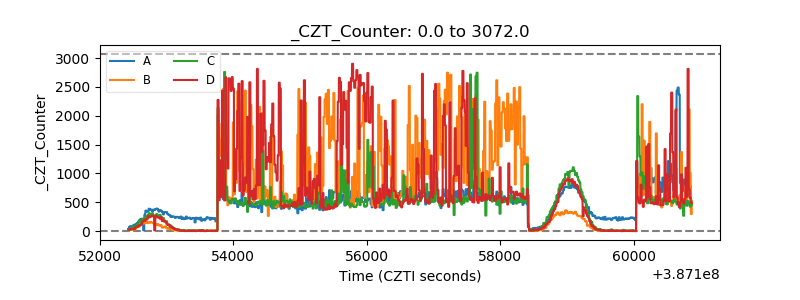 |
| +2.5 Volts monitor | 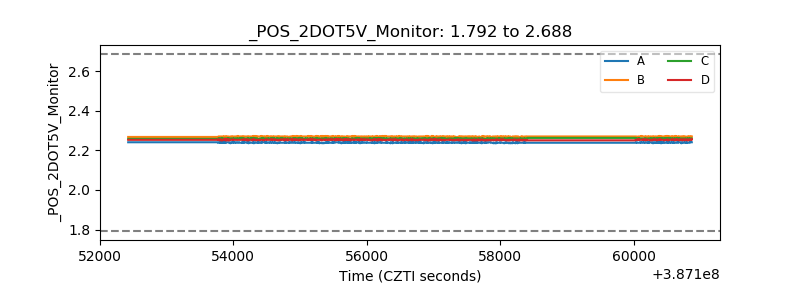 |
| +5 Volts monitor | 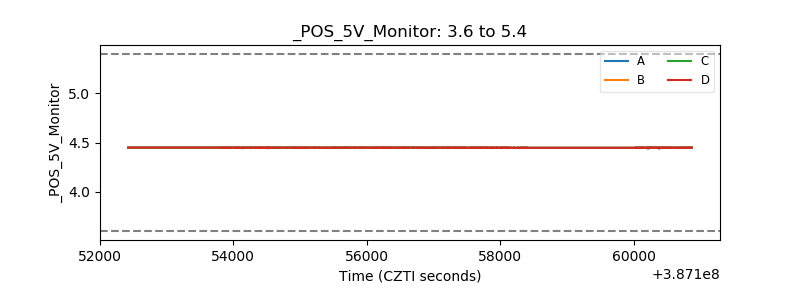 |
| _ROLL_ROT | 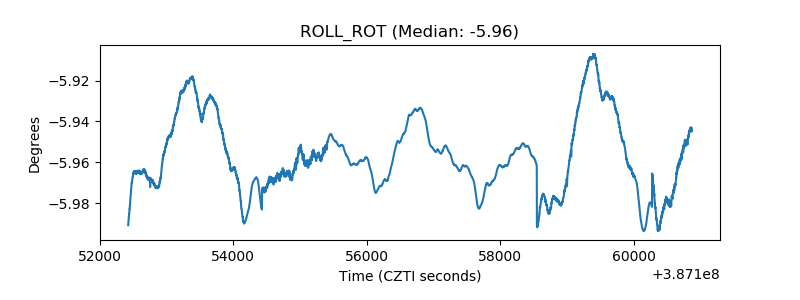 |
| _Roll_DEC | 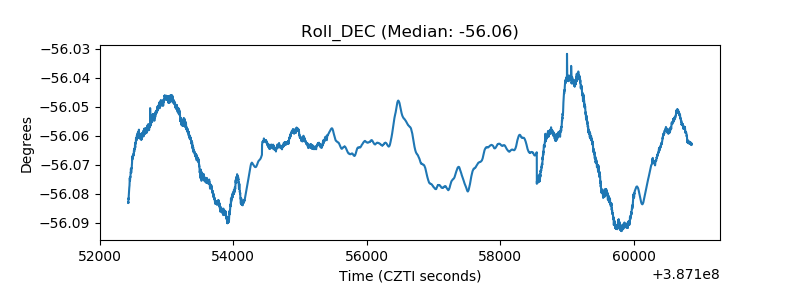 |
| _Roll_RA | 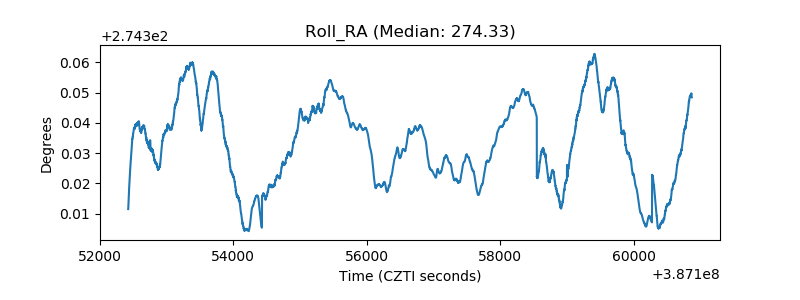 |
| Veto Counter | 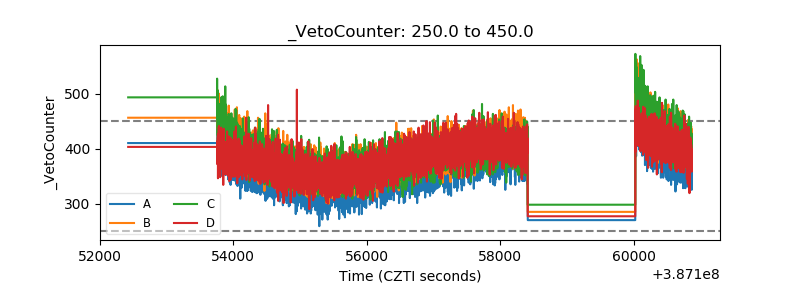 |