| Param | Original file | Final file |
|---|---|---|
| Filename | modeM0/AS1A11_082T01_9000005056_35295cztM0_level2.evt | modeM0/AS1A11_082T01_9000005056_35295cztM0_level2_quad_clean.evt |
| Size (bytes) | 664,577,280 | 66,761,280 |
| Size | 633.8 MB | 63.7 MB |
| Events in quadrant A | 2,682,702 | 436,480 |
| Events in quadrant B | 9,796,232 | 349,399 |
| Events in quadrant C | 3,381,130 | 428,047 |
| Events in quadrant D | 3,875,633 | 403,237 |
| Mode M0 | |||
|---|---|---|---|
| Quadrant | BADHDUFLAG | Total packets | Discarded packets |
| A | 0 | 11793 | 3 |
| B | 0 | 33114 | 2 |
| C | 0 | 13460 | 2 |
| D | 0 | 15251 | 2 |
| Mode SS | |||
|---|---|---|---|
| Quadrant | BADHDUFLAG | Total packets | Discarded packets |
| A | 0 | 118 | 0 |
| B | 0 | 118 | 0 |
| C | 0 | 118 | 0 |
| D | 0 | 118 | 0 |
| Mode M9 | |||
|---|---|---|---|
| Quadrant | BADHDUFLAG | Total packets | Discarded packets |
| A | 0 | 25 | 0 |
| B | 0 | 25 | 0 |
| C | 0 | 25 | 0 |
| D | 0 | 26 | 0 |
| Quadrant | Total seconds | Saturated seconds | Saturation percentage |
|---|---|---|---|
| A | 5770 | 9 | 0.155979% |
| B | 5770 | 3075 | 53.292894% |
| C | 5770 | 156 | 2.703640% |
| D | 5770 | 286 | 4.956672% |
Noise dominated data is calculated using 1-second bins in cleaned event files. If a bin has >2000 counts, and if more than 50% of those come from <1% of pixels, then it is considered to be noise-dominated and hence unusable.
| Quadrant | # 1 sec bins | Bins with >0 counts | Bins with >2000 counts | High rate bins dominated by noise | Noise dominated (total time) | Noise dominated (detector-on time) | Marked lightcurve |
|---|---|---|---|---|---|---|---|
| A | 7232 | 5771 | 0 | 0 | 0.00% | 0.00% | 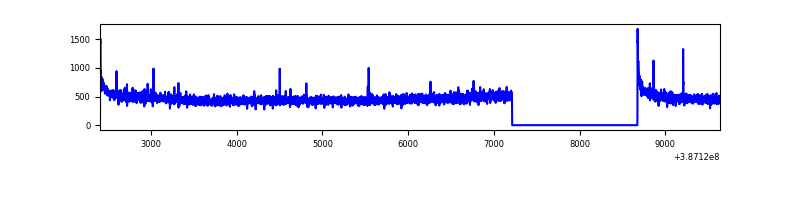 |
| B | 7232 | 5771 | 2563 | 2563 | 35.44% | 44.41% | 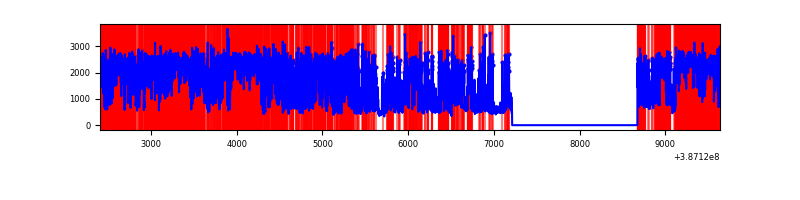 |
| C | 7232 | 5771 | 141 | 141 | 1.95% | 2.44% | 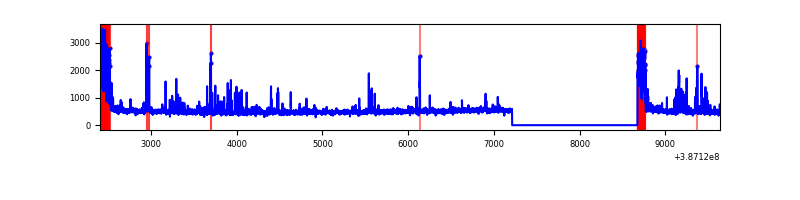 |
| D | 7232 | 5771 | 273 | 273 | 3.77% | 4.73% | 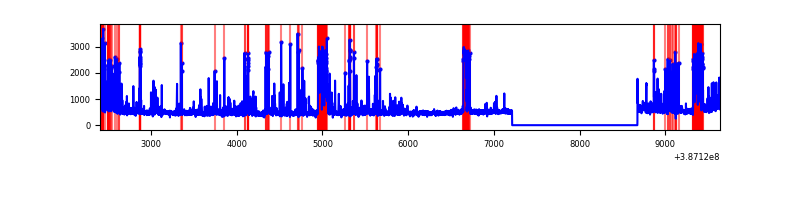 |
Top three noisy pixels from each quadrant. If the there are fewer than three noisy pixels in the level2.evt file, extra rows are filled as -1
| Pixel properties | Quadrant properties | ||||||
|---|---|---|---|---|---|---|---|
| Quadrant | DetID | PixID | Counts | Sigma | Mean | Median | Sigma |
| A | 10 | 83 | 104550 | 786.04 | 659 | 647 | 132.2 |
| A | 13 | 6 | 17542 | 127.81 | 659 | 647 | 132.2 |
| A | 13 | 254 | 8982 | 63.06 | 659 | 647 | 132.2 |
| B | 5 | 172 | 4405985 | 46006.12 | 498 | 485 | 95.8 |
| B | 5 | 236 | 3332444 | 34795.26 | 498 | 485 | 95.8 |
| B | 4 | 232 | 62665 | 649.34 | 498 | 485 | 95.8 |
| C | 0 | 10 | 614644 | 4198.48 | 633 | 638 | 146.2 |
| C | 15 | 214 | 235446 | 1605.58 | 633 | 638 | 146.2 |
| C | 15 | 159 | 28931 | 193.46 | 633 | 638 | 146.2 |
| D | 7 | 80 | 308447 | 2001.29 | 629 | 612 | 153.8 |
| D | 2 | 249 | 252243 | 1635.9 | 629 | 612 | 153.8 |
| D | 10 | 118 | 194472 | 1260.32 | 629 | 612 | 153.8 |
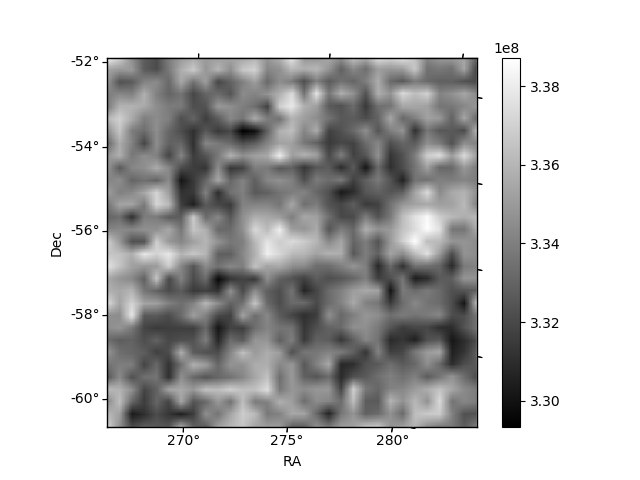
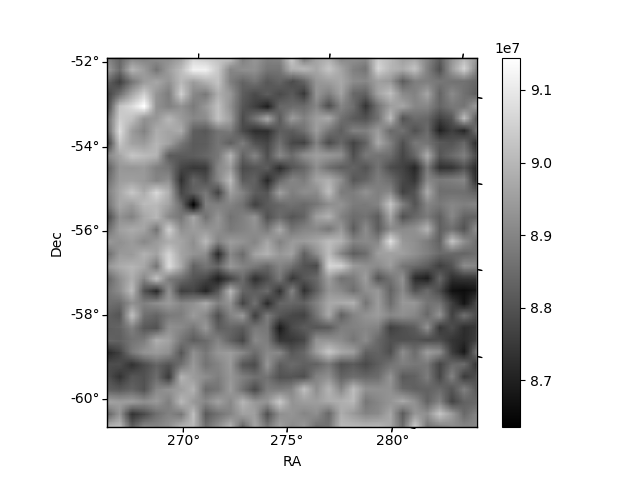
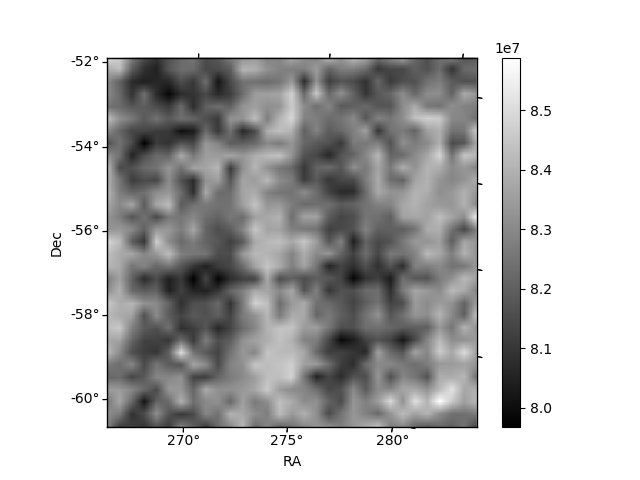
Histogram calculated using DETX and DETY for each event in the final _common_clean file
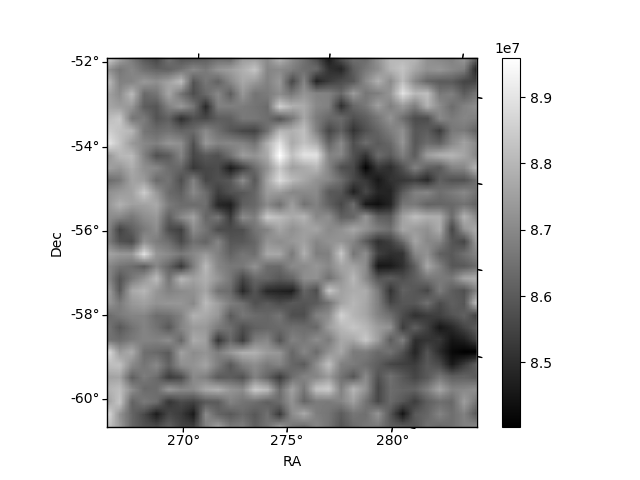
| Quadrant A | 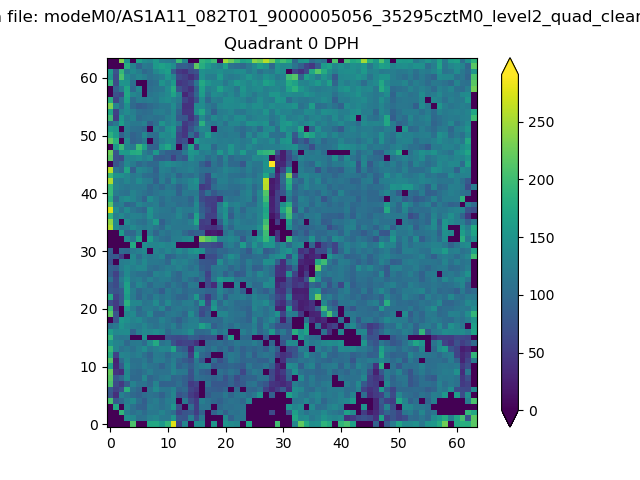 |
 |
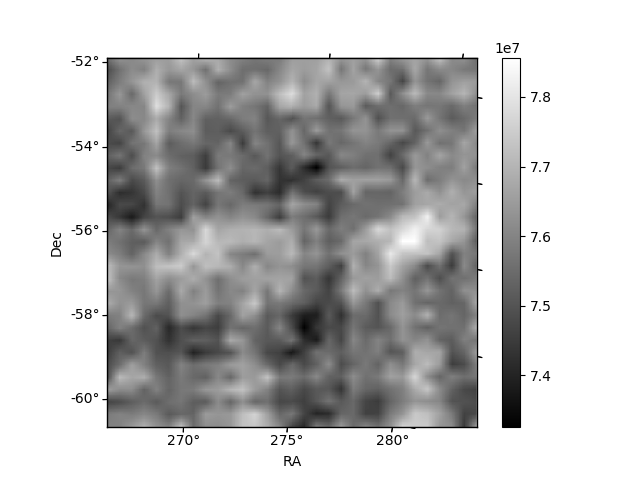
Quadrant B |
|---|---|---|---|
| Quadrant D | 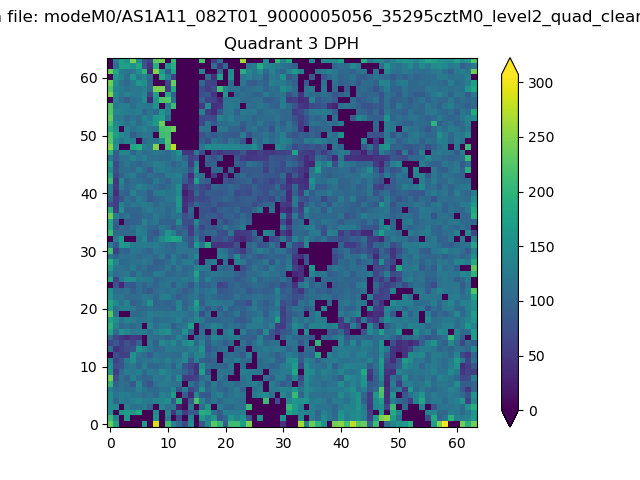 |
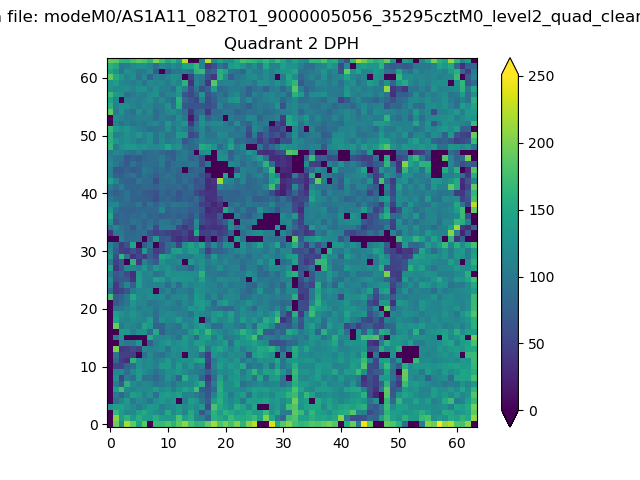 |
Quadrant C |
| Plot type | Count rate plots | Images |
|---|---|---|
| Comparison with Poisson distribution Blue bars denote a histogram of data divided into 1 sec bins. Red curve is a Poisson curve with rate = median count rate of data. |
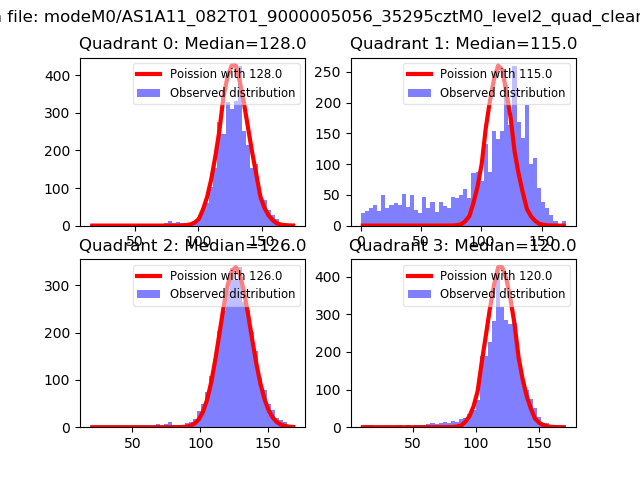 |
 |
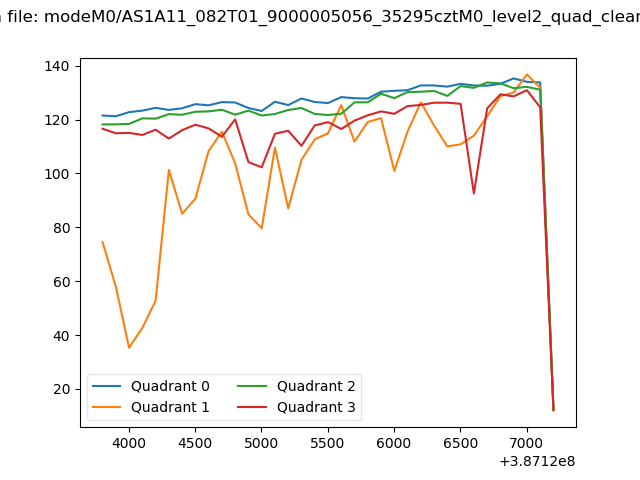
| Quadrant-wise count rates Data is divided into 100 sec bins |
 |
|
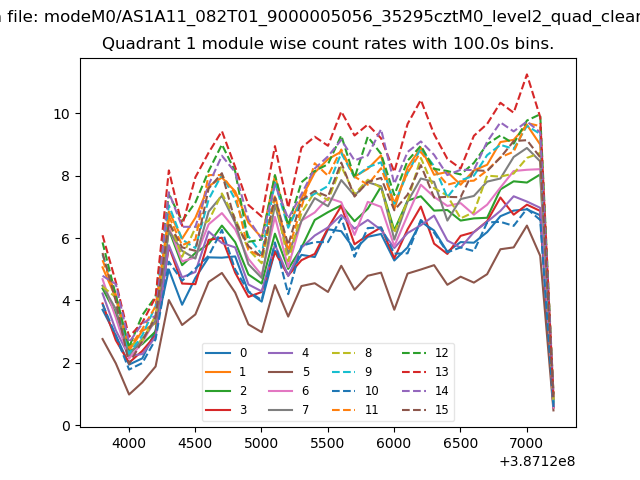
| Module-wise count rates for Quadrant A Data is divided into 100 sec bins |
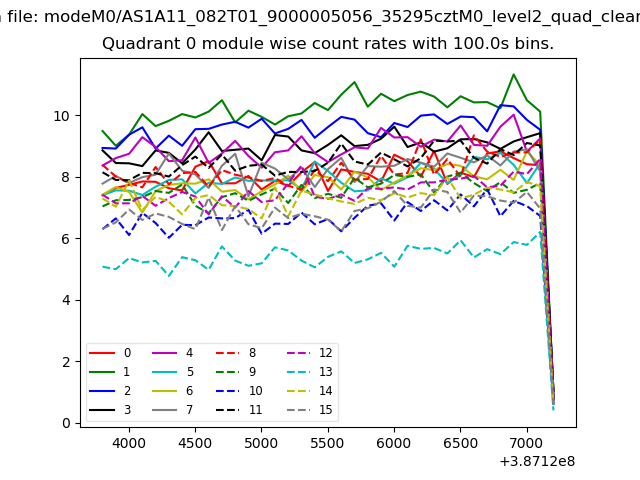 |
 |
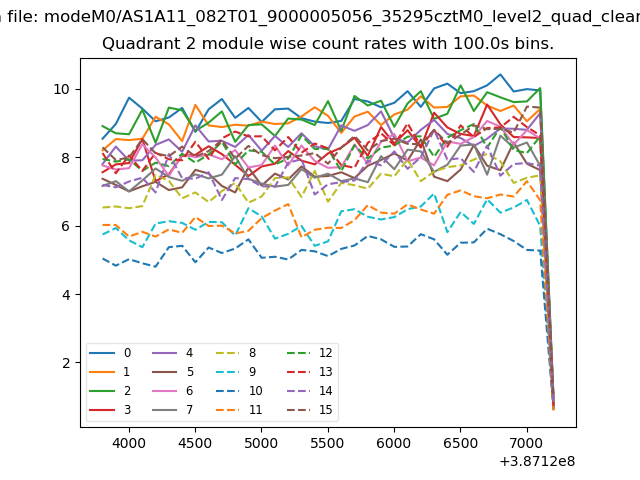
| Module-wise count rates for Quadrant B Data is divided into 100 sec bins |
 |
 |
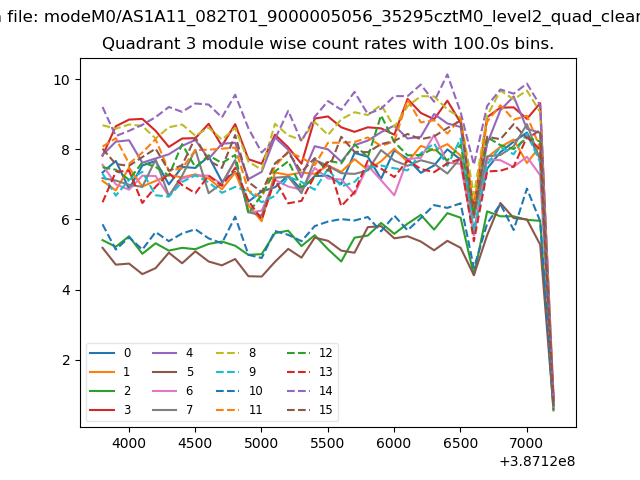
| Module-wise count rates for Quadrant C Data is divided into 100 sec bins |
 |
 |
| Module-wise count rates for Quadrant D Data is divided into 100 sec bins |
 |
 |
| Parameter | Plot |
|---|---|
| CZT HV Monitor | 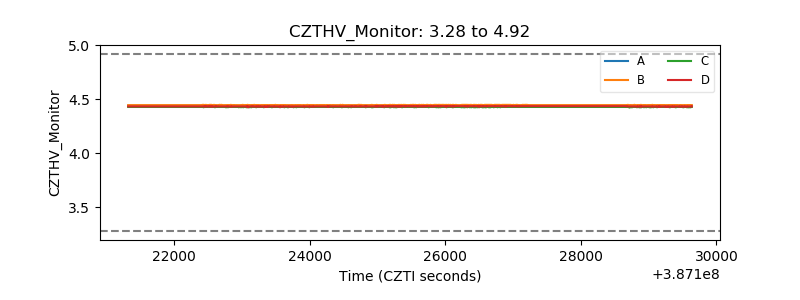 |
| D_VDD | 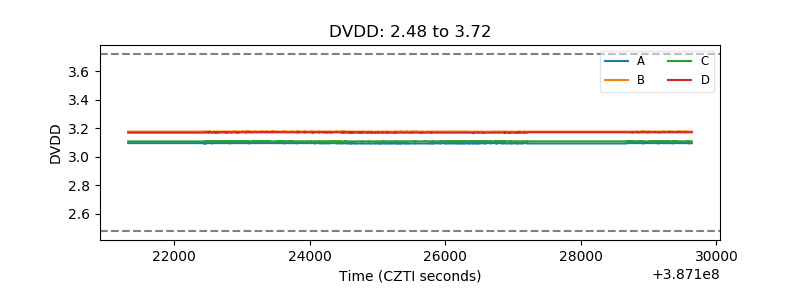 |
| Temperature 1 | 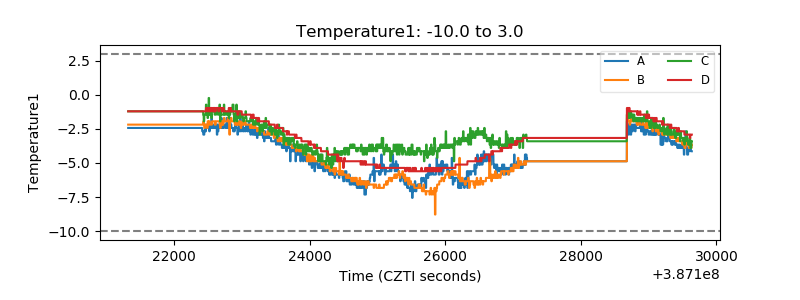 |
| Veto HV Monitor | 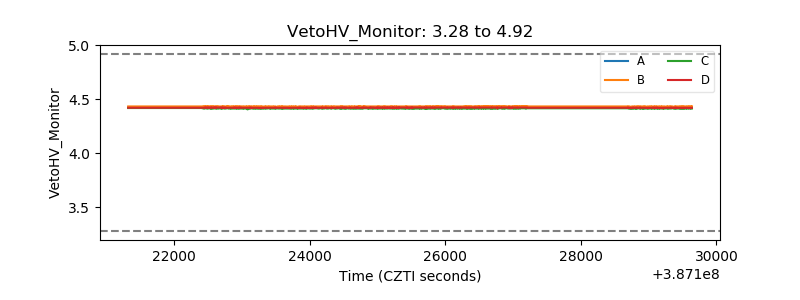 |
| Veto LLD | 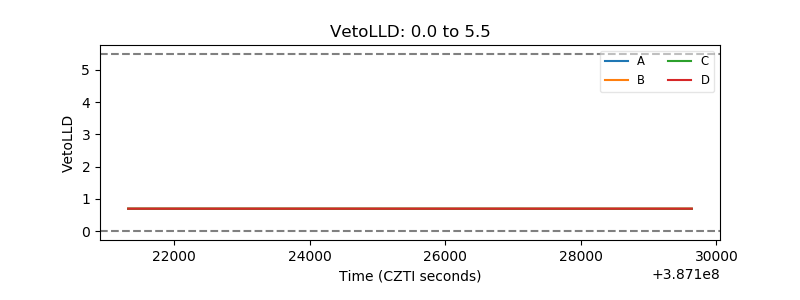 |
| Alpha Counter | 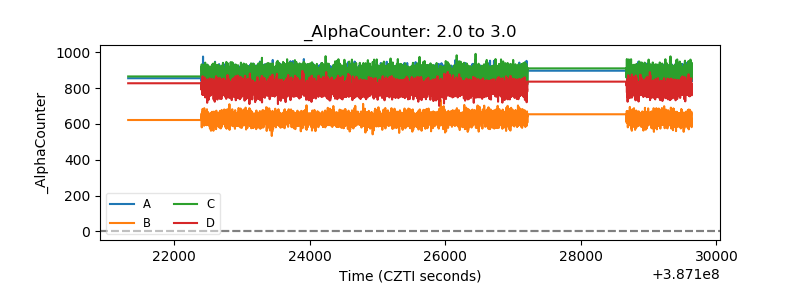 |
| _CPM_Rate | 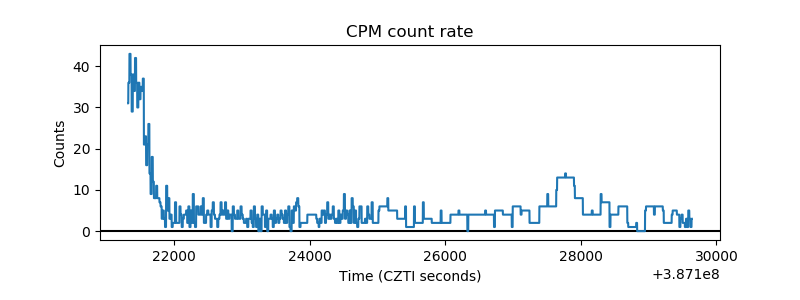 |
| CZT Counter | 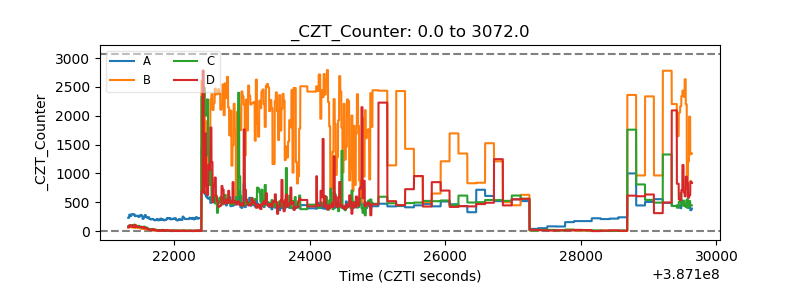 |
| +2.5 Volts monitor | 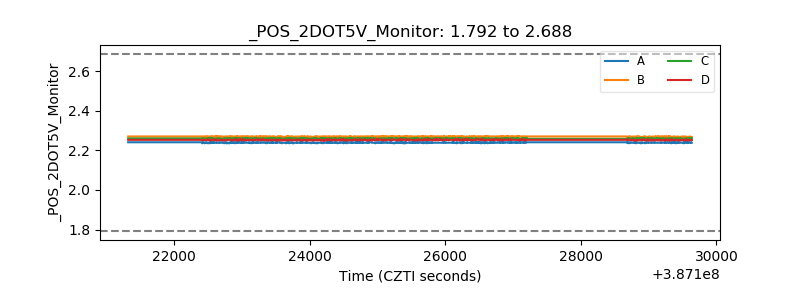 |
| +5 Volts monitor | 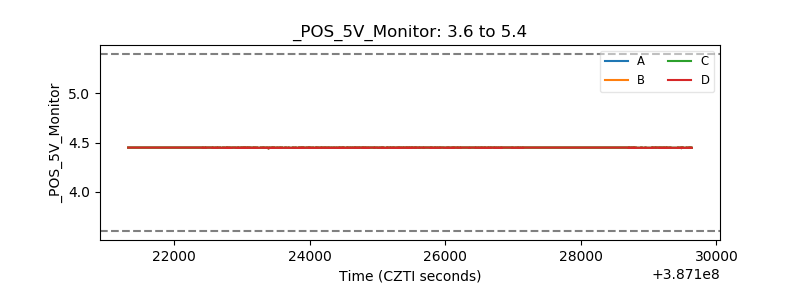 |
| _ROLL_ROT | 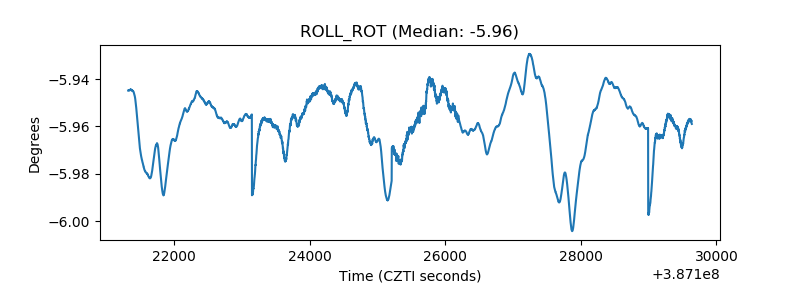 |
| _Roll_DEC | 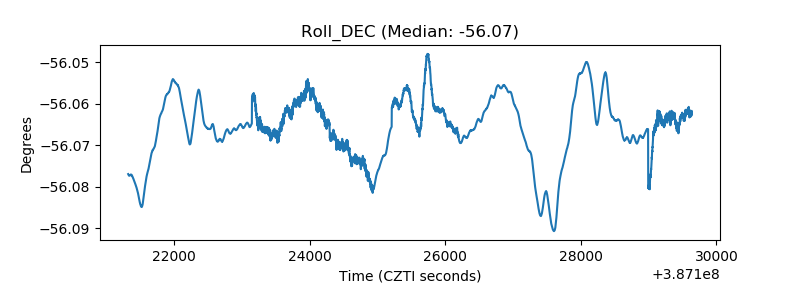 |
| _Roll_RA | 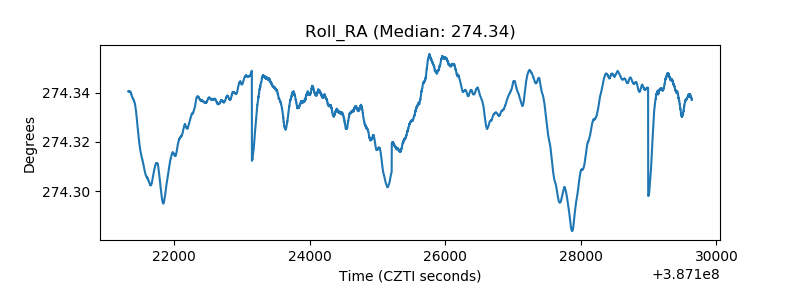 |
| Veto Counter | 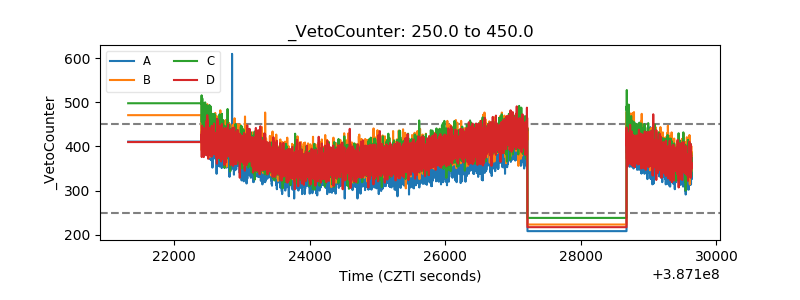 |