| Param | Original file | Final file |
|---|---|---|
| Filename | modeM0/AS1A11_082T01_9000005056_35286cztM0_level2.evt | modeM0/AS1A11_082T01_9000005056_35286cztM0_level2_quad_clean.evt |
| Size (bytes) | 760,314,240 | 71,686,080 |
| Size | 725.1 MB | 68.4 MB |
| Events in quadrant A | 2,806,518 | 490,539 |
| Events in quadrant B | 9,066,713 | 413,482 |
| Events in quadrant C | 3,865,122 | 473,256 |
| Events in quadrant D | 6,896,430 | 387,359 |
| Mode M0 | |||
|---|---|---|---|
| Quadrant | BADHDUFLAG | Total packets | Discarded packets |
| A | 0 | 12060 | 3 |
| B | 0 | 30927 | 2 |
| C | 0 | 15120 | 2 |
| D | 0 | 24421 | 2 |
| Mode SS | |||
|---|---|---|---|
| Quadrant | BADHDUFLAG | Total packets | Discarded packets |
| A | 0 | 120 | 0 |
| B | 0 | 120 | 0 |
| C | 0 | 120 | 0 |
| D | 0 | 120 | 0 |
| Mode M9 | |||
|---|---|---|---|
| Quadrant | BADHDUFLAG | Total packets | Discarded packets |
| A | 0 | 31 | 0 |
| B | 0 | 31 | 0 |
| C | 0 | 31 | 0 |
| D | 0 | 31 | 0 |
| Quadrant | Total seconds | Saturated seconds | Saturation percentage |
|---|---|---|---|
| A | 5785 | 13 | 0.224719% |
| B | 5785 | 2560 | 44.252377% |
| C | 5785 | 167 | 2.886776% |
| D | 5785 | 1589 | 27.467589% |
Noise dominated data is calculated using 1-second bins in cleaned event files. If a bin has >2000 counts, and if more than 50% of those come from <1% of pixels, then it is considered to be noise-dominated and hence unusable.
| Quadrant | # 1 sec bins | Bins with >0 counts | Bins with >2000 counts | High rate bins dominated by noise | Noise dominated (total time) | Noise dominated (detector-on time) | Marked lightcurve |
|---|---|---|---|---|---|---|---|
| A | 8950 | 5787 | 1 | 1 | 0.01% | 0.02% | 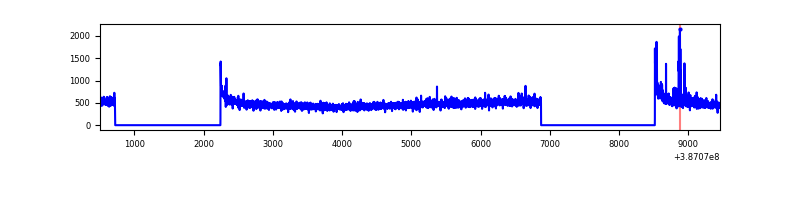 |
| B | 8950 | 5786 | 2015 | 2015 | 22.51% | 34.83% | 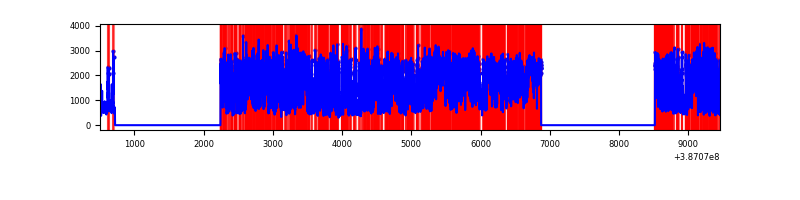 |
| C | 8950 | 5787 | 146 | 146 | 1.63% | 2.52% | 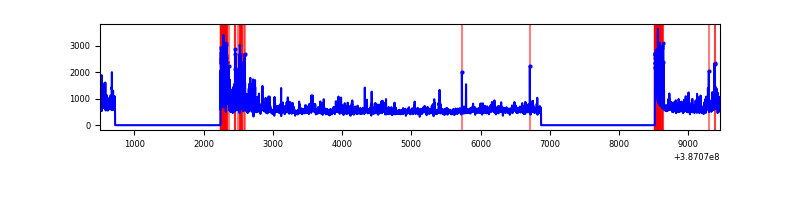 |
| D | 8950 | 5787 | 1505 | 1505 | 16.82% | 26.01% | 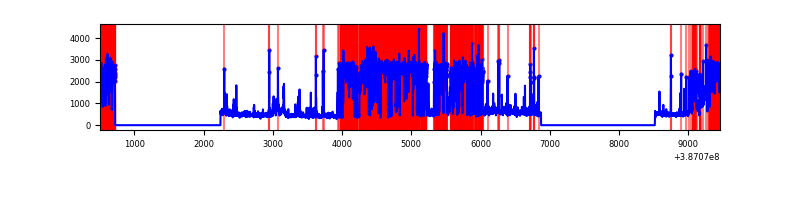 |
Top three noisy pixels from each quadrant. If the there are fewer than three noisy pixels in the level2.evt file, extra rows are filled as -1
| Pixel properties | Quadrant properties | ||||||
|---|---|---|---|---|---|---|---|
| Quadrant | DetID | PixID | Counts | Sigma | Mean | Median | Sigma |
| A | 10 | 83 | 101796 | 736.54 | 678 | 664 | 137.3 |
| A | 15 | 169 | 56841 | 409.14 | 678 | 664 | 137.3 |
| A | 13 | 6 | 13207 | 91.35 | 678 | 664 | 137.3 |
| B | 5 | 172 | 4769182 | 45436.39 | 546 | 532 | 105.0 |
| B | 5 | 236 | 2008493 | 19132.14 | 546 | 532 | 105.0 |
| B | 5 | 200 | 119561 | 1134.13 | 546 | 532 | 105.0 |
| C | 0 | 10 | 571566 | 3724.86 | 658 | 664 | 153.3 |
| C | 4 | 254 | 436344 | 2842.6 | 658 | 664 | 153.3 |
| C | 15 | 214 | 235649 | 1533.16 | 658 | 664 | 153.3 |
| D | 7 | 80 | 3653667 | 26043.97 | 569 | 554 | 140.3 |
| D | 12 | 233 | 381095 | 2712.97 | 569 | 554 | 140.3 |
| D | 2 | 249 | 178847 | 1271.1 | 569 | 554 | 140.3 |
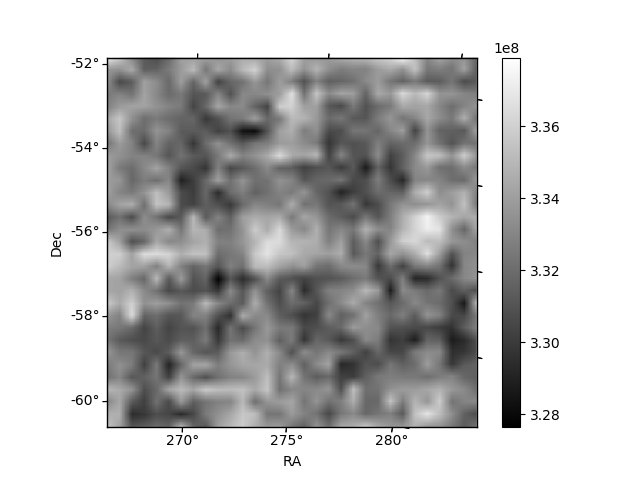
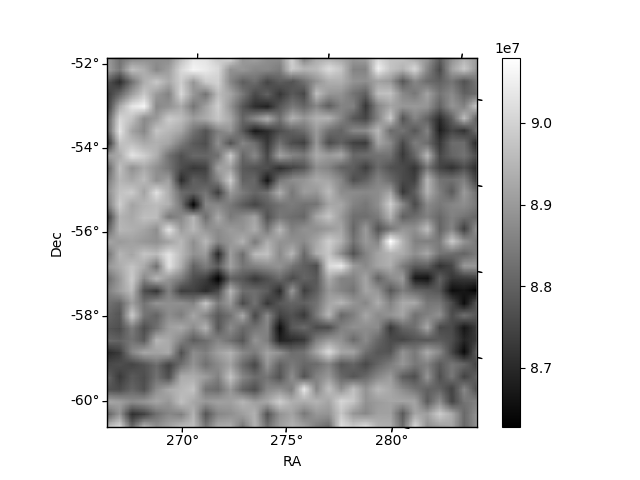
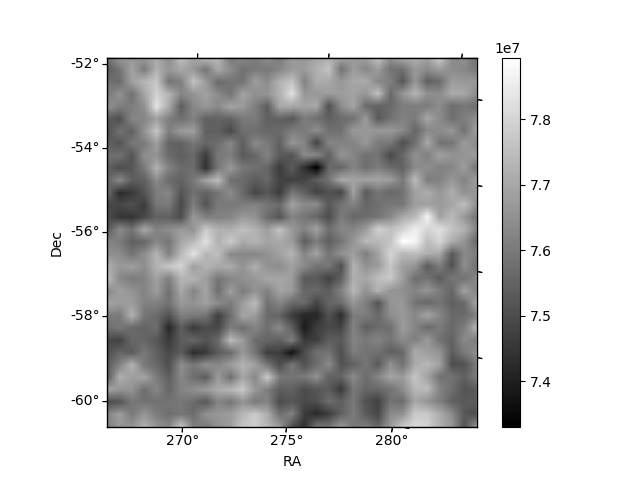
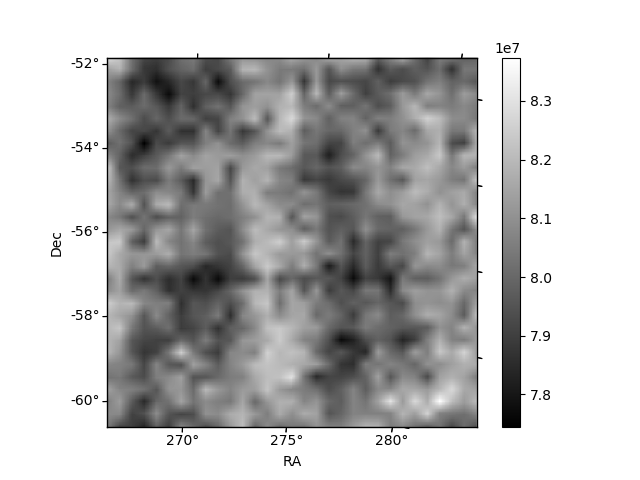
Histogram calculated using DETX and DETY for each event in the final _common_clean file
| Quadrant A | 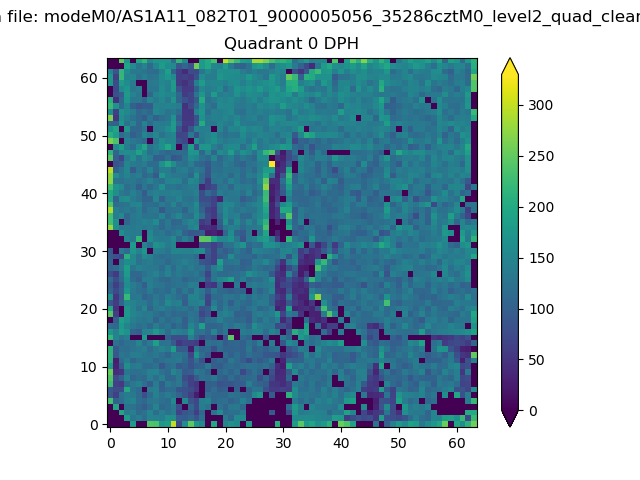 |
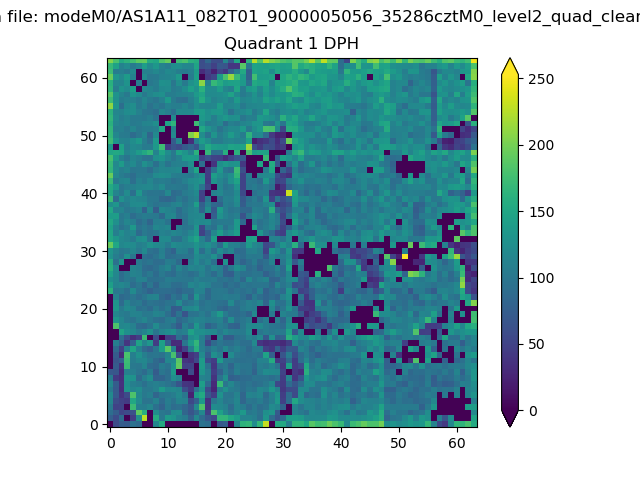 |
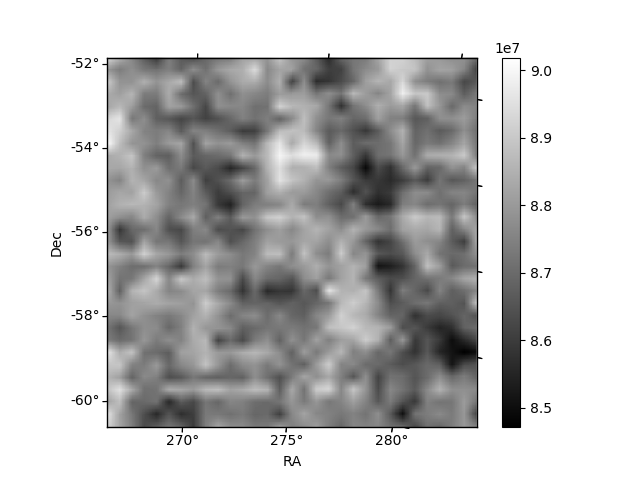
Quadrant B |
|---|---|---|---|
| Quadrant D | 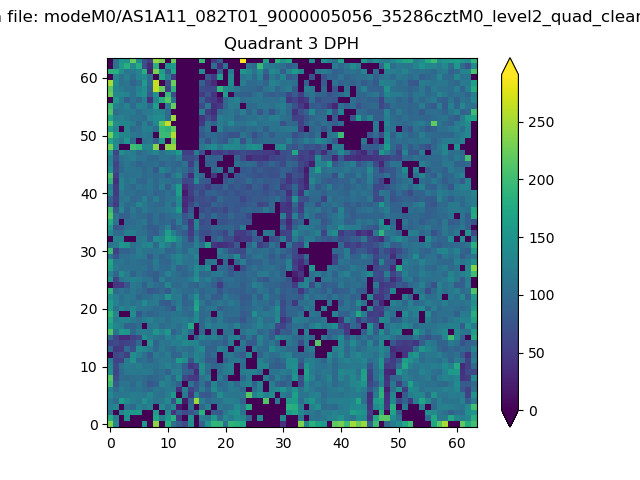 |
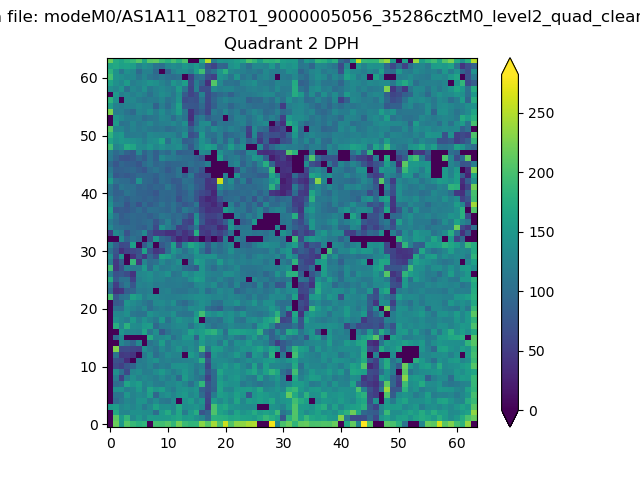 |
Quadrant C |
| Plot type | Count rate plots | Images |
|---|---|---|
| Comparison with Poisson distribution Blue bars denote a histogram of data divided into 1 sec bins. Red curve is a Poisson curve with rate = median count rate of data. |
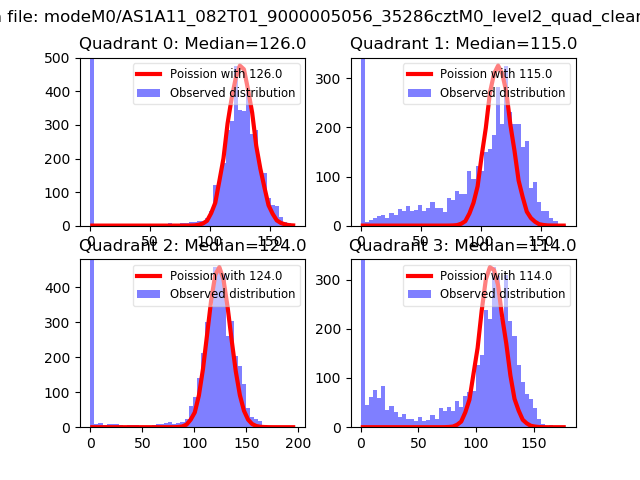 |
 |
| Quadrant-wise count rates Data is divided into 100 sec bins |
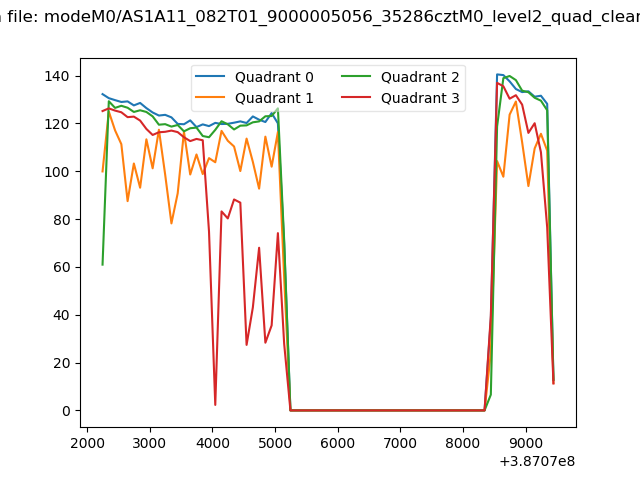 |
|
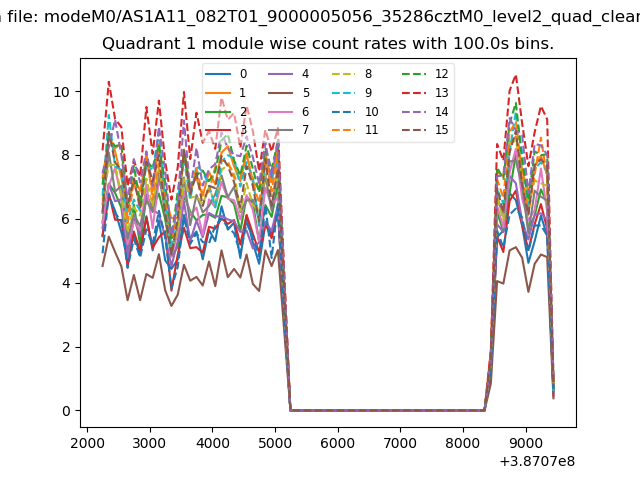
| Module-wise count rates for Quadrant A Data is divided into 100 sec bins |
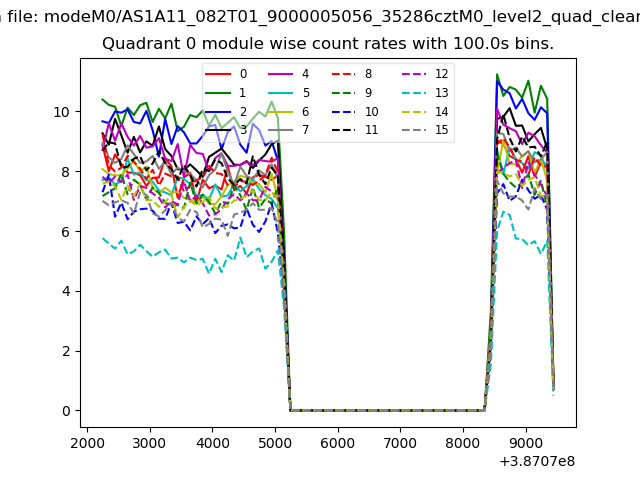 |
 |
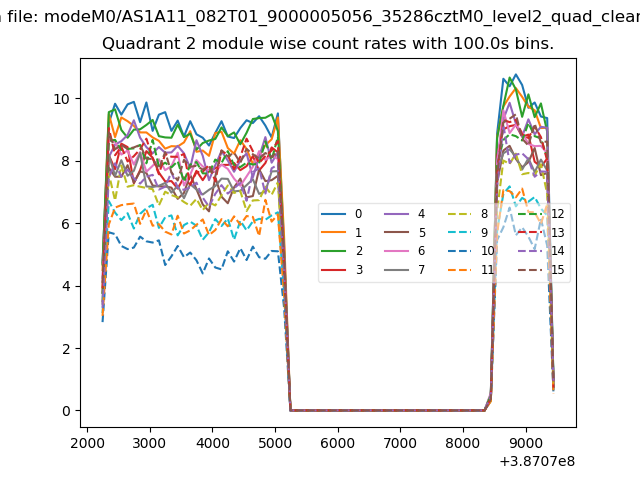
| Module-wise count rates for Quadrant B Data is divided into 100 sec bins |
 |
 |
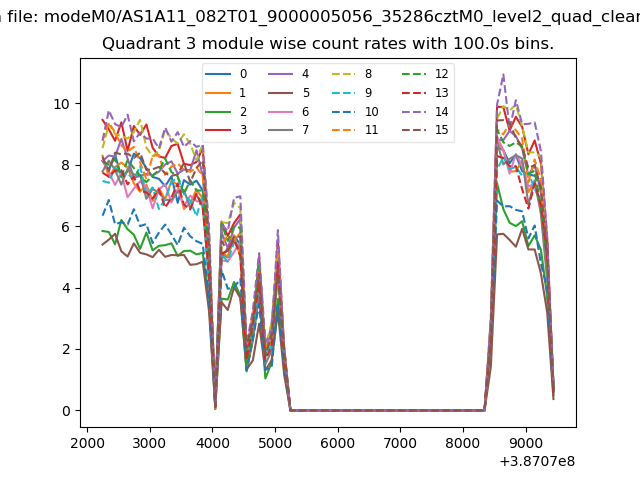
| Module-wise count rates for Quadrant C Data is divided into 100 sec bins |
 |
 |
| Module-wise count rates for Quadrant D Data is divided into 100 sec bins |
 |
 |
| Parameter | Plot |
|---|---|
| CZT HV Monitor |  |
| D_VDD | 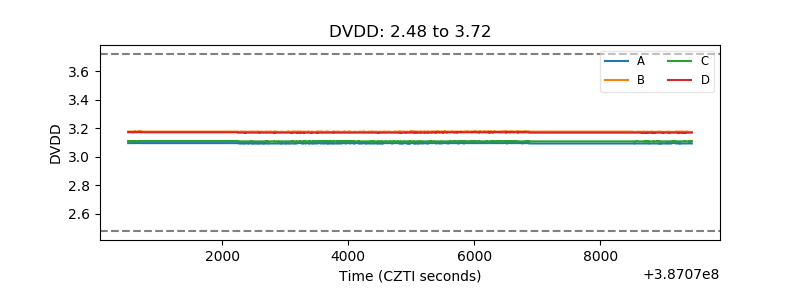 |
| Temperature 1 | 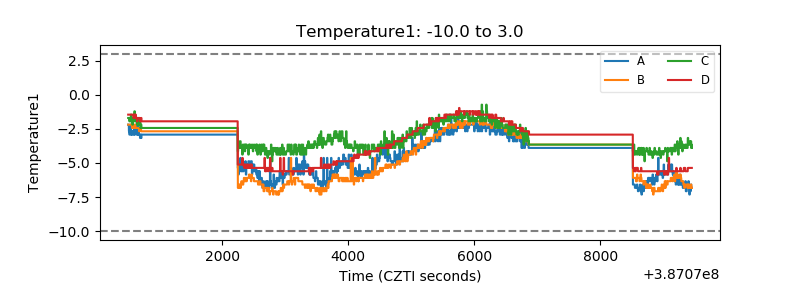 |
| Veto HV Monitor | 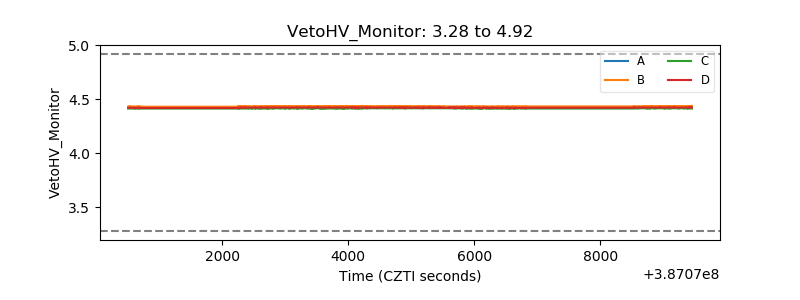 |
| Veto LLD | 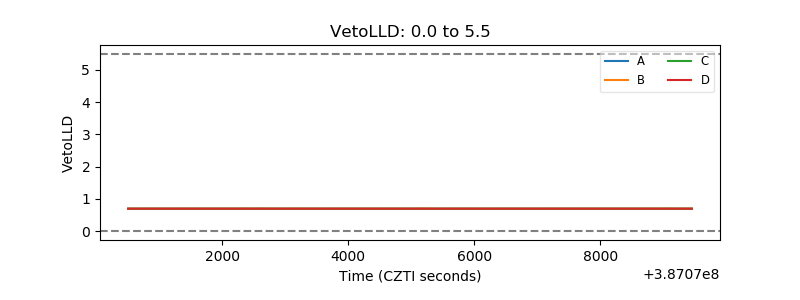 |
| Alpha Counter | 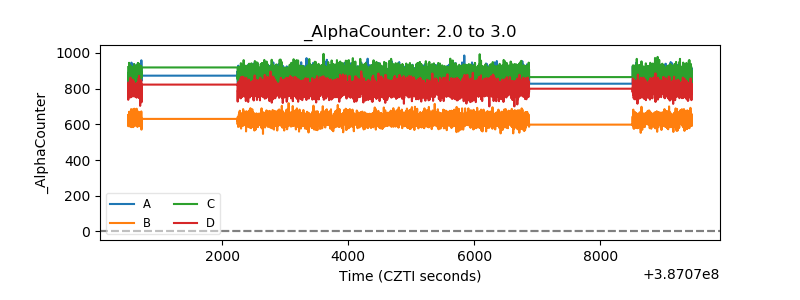 |
| _CPM_Rate | 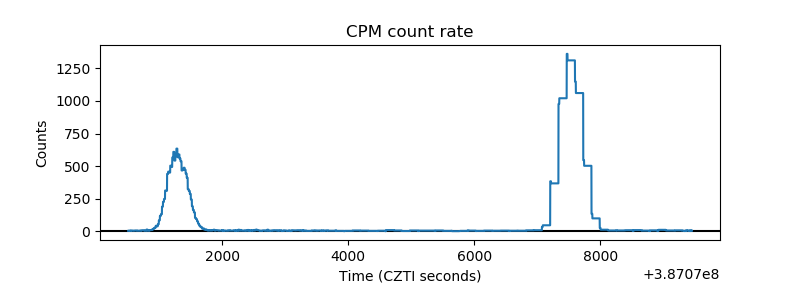 |
| CZT Counter | 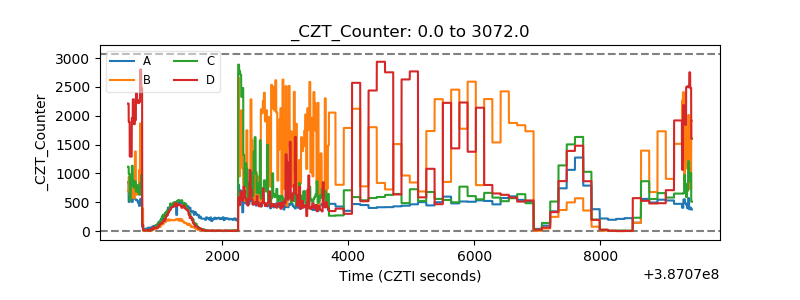 |
| +2.5 Volts monitor | 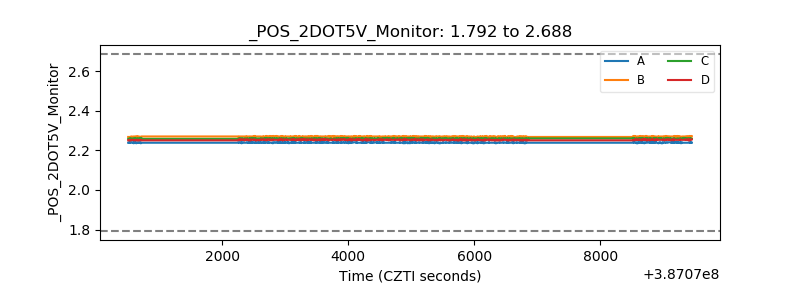 |
| +5 Volts monitor | 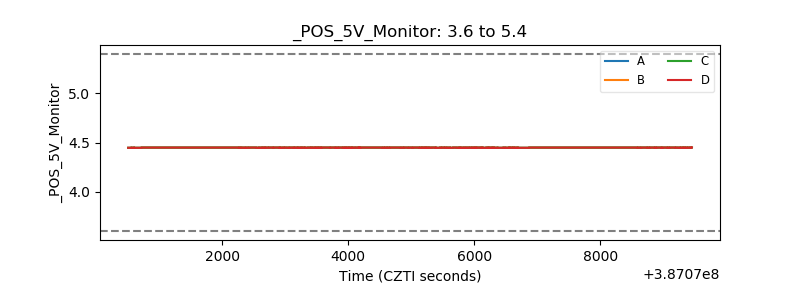 |
| _ROLL_ROT | 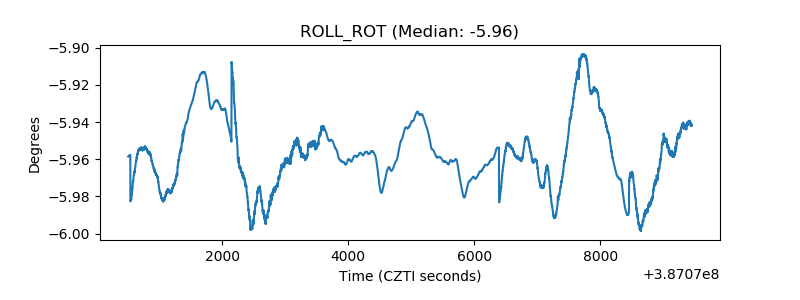 |
| _Roll_DEC | 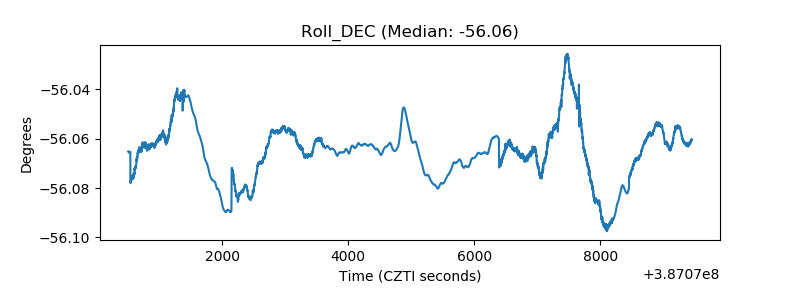 |
| _Roll_RA | 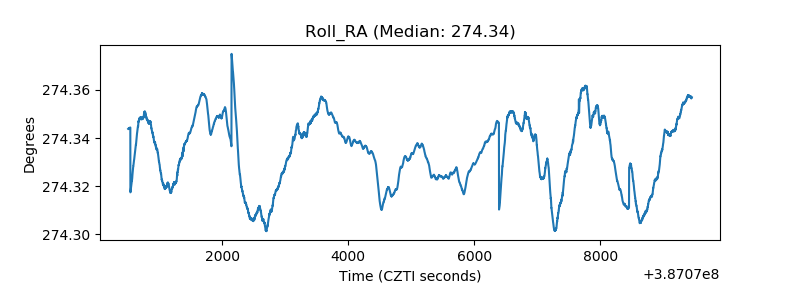 |
| Veto Counter | 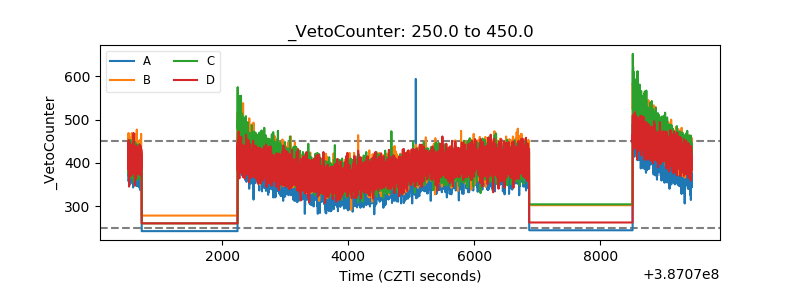 |