| Param | Original file | Final file |
|---|---|---|
| Filename | modeM0/AS1A11_082T01_9000005056_35285cztM0_level2.evt | modeM0/AS1A11_082T01_9000005056_35285cztM0_level2_quad_clean.evt |
| Size (bytes) | 923,342,400 | 99,829,440 |
| Size | 880.6 MB | 95.2 MB |
| Events in quadrant A | 3,742,651 | 670,118 |
| Events in quadrant B | 9,750,234 | 595,868 |
| Events in quadrant C | 6,859,685 | 606,875 |
| Events in quadrant D | 7,083,736 | 605,487 |
| Mode M0 | |||
|---|---|---|---|
| Quadrant | BADHDUFLAG | Total packets | Discarded packets |
| A | 0 | 16115 | 3 |
| B | 0 | 34391 | 2 |
| C | 0 | 25751 | 2 |
| D | 0 | 26335 | 2 |
| Mode SS | |||
|---|---|---|---|
| Quadrant | BADHDUFLAG | Total packets | Discarded packets |
| A | 0 | 158 | 0 |
| B | 0 | 158 | 0 |
| C | 0 | 158 | 0 |
| D | 0 | 158 | 0 |
| Mode M9 | |||
|---|---|---|---|
| Quadrant | BADHDUFLAG | Total packets | Discarded packets |
| A | 0 | 29 | 0 |
| B | 0 | 29 | 0 |
| C | 0 | 29 | 0 |
| D | 0 | 29 | 0 |
| Quadrant | Total seconds | Saturated seconds | Saturation percentage |
|---|---|---|---|
| A | 7824 | 21 | 0.268405% |
| B | 7824 | 1926 | 24.616564% |
| C | 7824 | 706 | 9.023517% |
| D | 7824 | 1058 | 13.522495% |
Noise dominated data is calculated using 1-second bins in cleaned event files. If a bin has >2000 counts, and if more than 50% of those come from <1% of pixels, then it is considered to be noise-dominated and hence unusable.
| Quadrant | # 1 sec bins | Bins with >0 counts | Bins with >2000 counts | High rate bins dominated by noise | Noise dominated (total time) | Noise dominated (detector-on time) | Marked lightcurve |
|---|---|---|---|---|---|---|---|
| A | 10750 | 7826 | 4 | 4 | 0.04% | 0.05% | 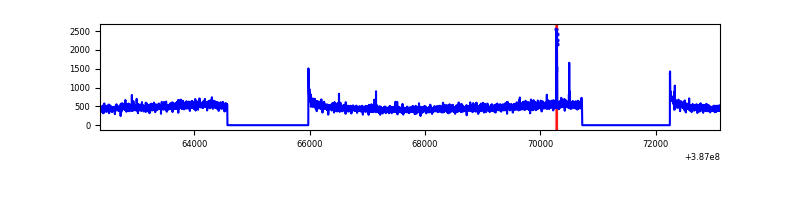 |
| B | 10750 | 7826 | 1451 | 1451 | 13.50% | 18.54% | 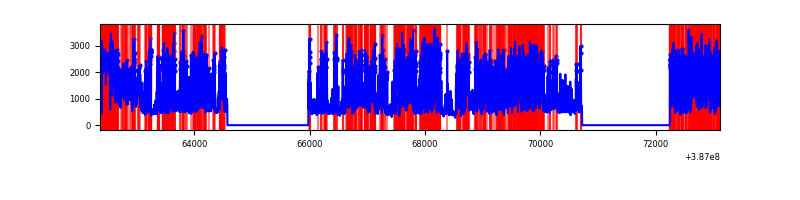 |
| C | 10750 | 7826 | 667 | 667 | 6.20% | 8.52% | 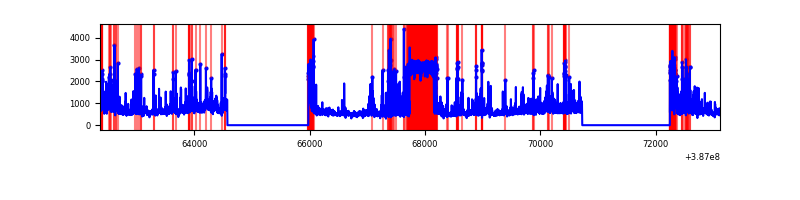 |
| D | 10750 | 7825 | 912 | 912 | 8.48% | 11.65% | 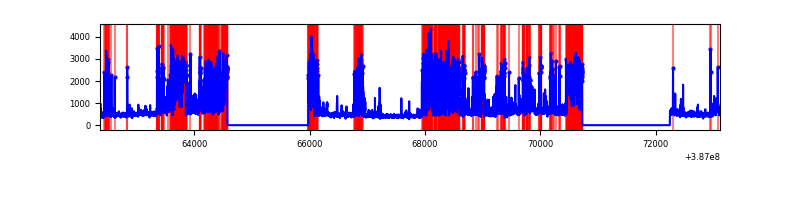 |
Top three noisy pixels from each quadrant. If the there are fewer than three noisy pixels in the level2.evt file, extra rows are filled as -1
| Pixel properties | Quadrant properties | ||||||
|---|---|---|---|---|---|---|---|
| Quadrant | DetID | PixID | Counts | Sigma | Mean | Median | Sigma |
| A | 10 | 83 | 114023 | 601.1 | 925 | 904 | 188.2 |
| A | 15 | 169 | 21511 | 109.5 | 925 | 904 | 188.2 |
| A | 13 | 6 | 17475 | 88.06 | 925 | 904 | 188.2 |
| B | 5 | 172 | 3613472 | 22273.85 | 838 | 814 | 162.2 |
| B | 5 | 236 | 2787724 | 17182.7 | 838 | 814 | 162.2 |
| B | 3 | 112 | 22069 | 131.05 | 838 | 814 | 162.2 |
| C | 9 | 187 | 1092304 | 5431.13 | 865 | 871 | 201.0 |
| C | 0 | 10 | 914230 | 4545.01 | 865 | 871 | 201.0 |
| C | 4 | 254 | 744126 | 3698.55 | 865 | 871 | 201.0 |
| D | 7 | 80 | 1493453 | 7061.09 | 861 | 836 | 211.4 |
| D | 13 | 249 | 902742 | 4266.63 | 861 | 836 | 211.4 |
| D | 12 | 233 | 446336 | 2107.52 | 861 | 836 | 211.4 |
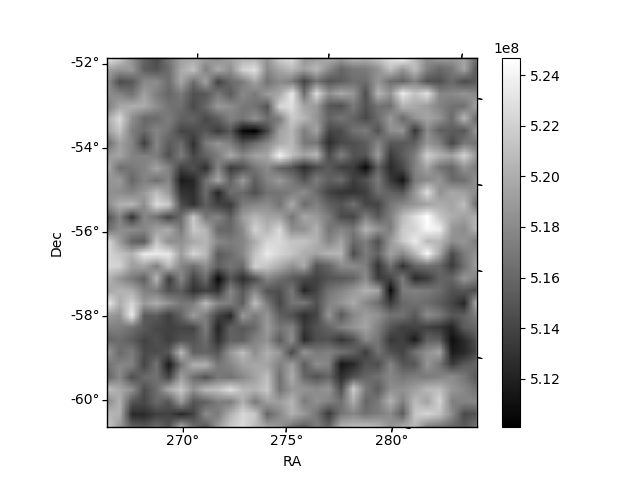
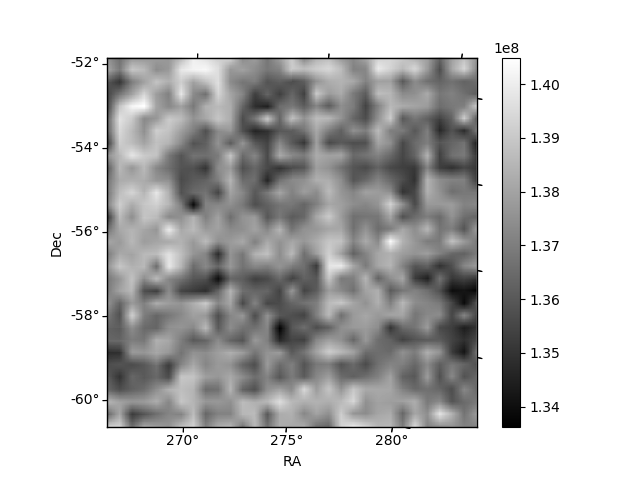
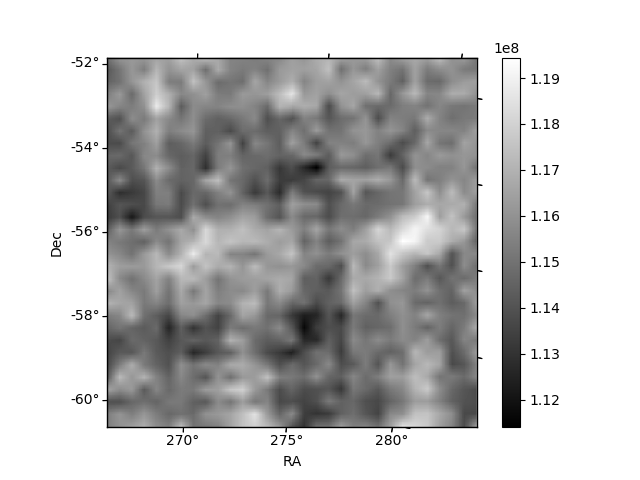
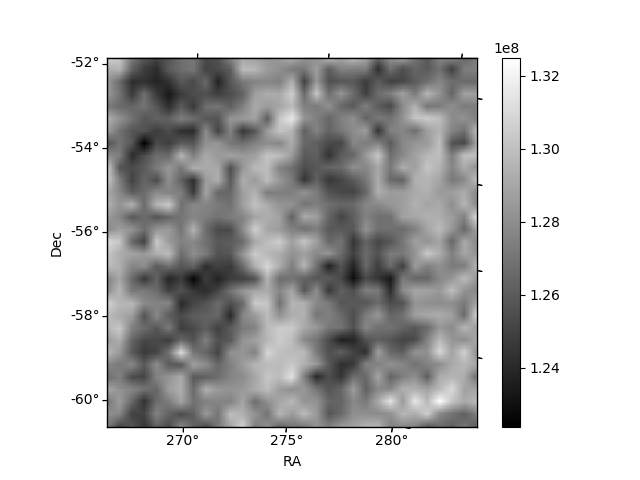
Histogram calculated using DETX and DETY for each event in the final _common_clean file
| Quadrant A | 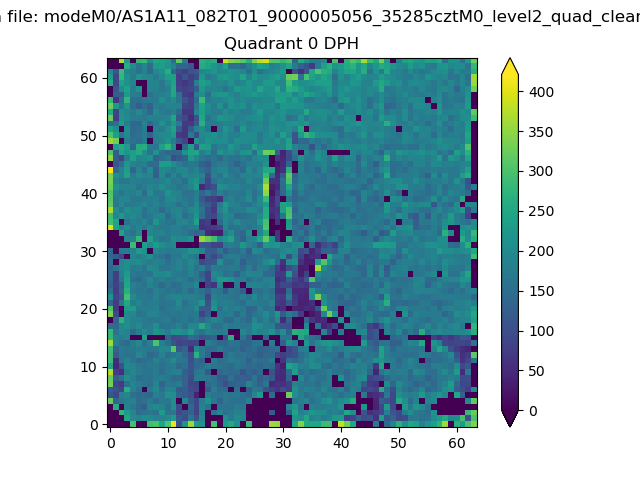 |
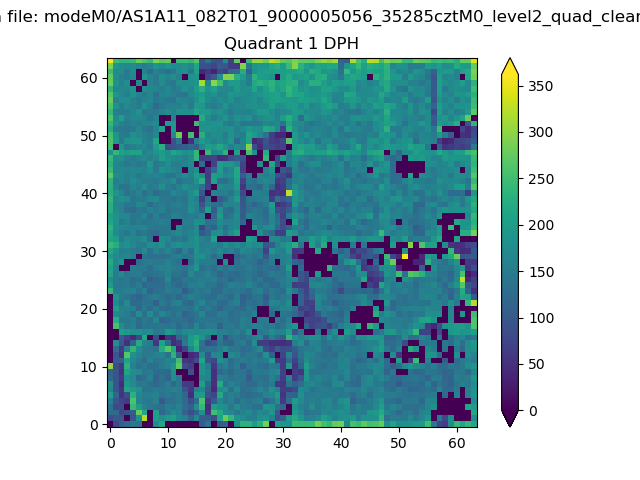 |
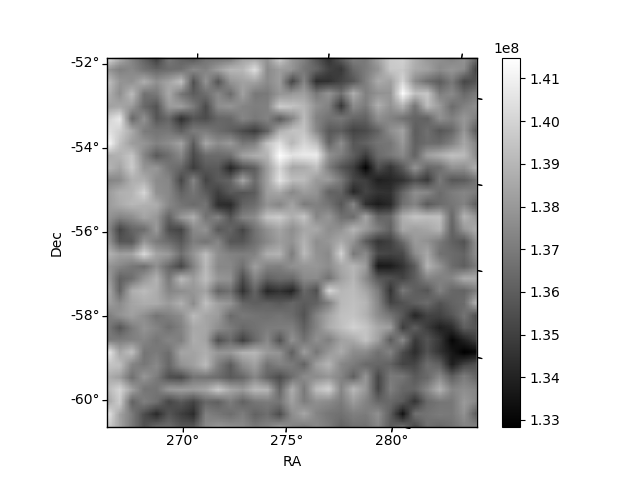
Quadrant B |
|---|---|---|---|
| Quadrant D | 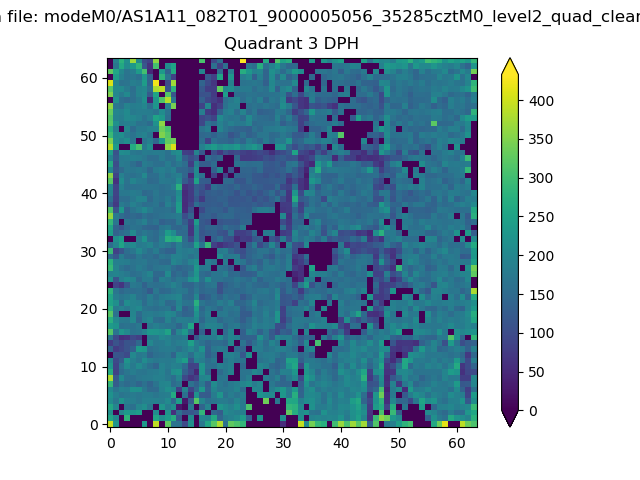 |
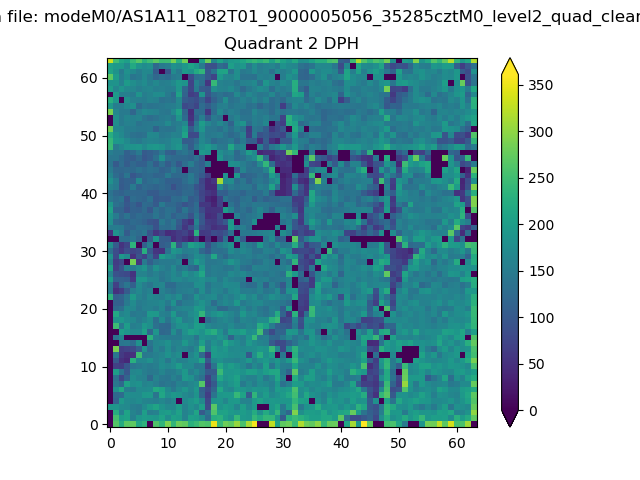 |
Quadrant C |
| Plot type | Count rate plots | Images |
|---|---|---|
| Comparison with Poisson distribution Blue bars denote a histogram of data divided into 1 sec bins. Red curve is a Poisson curve with rate = median count rate of data. |
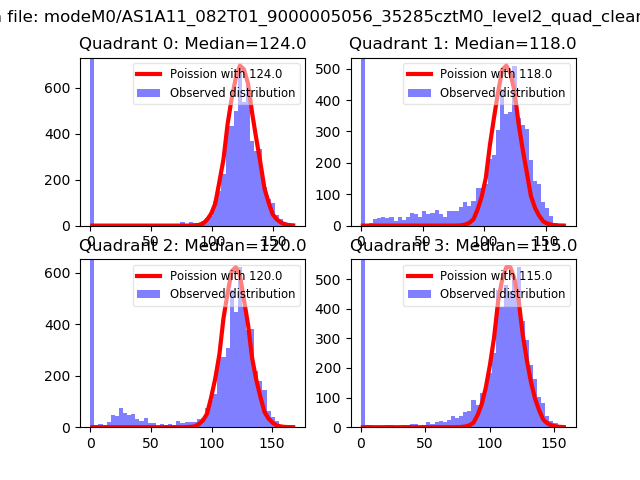 |
 |
| Quadrant-wise count rates Data is divided into 100 sec bins |
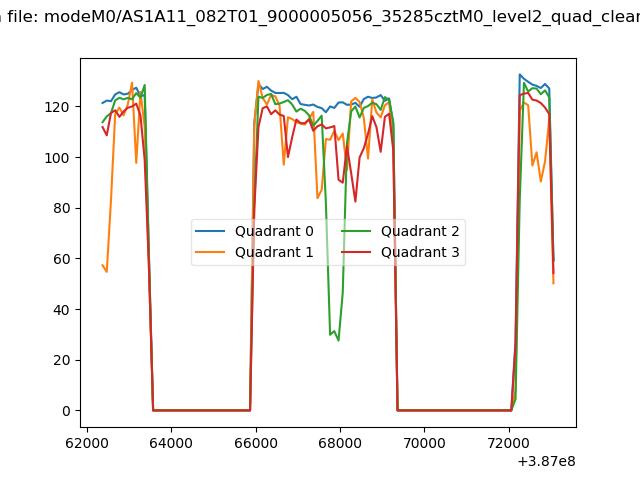 |
|
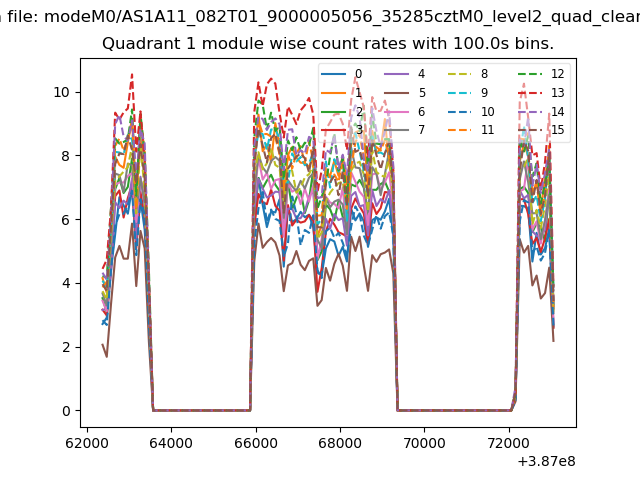
| Module-wise count rates for Quadrant A Data is divided into 100 sec bins |
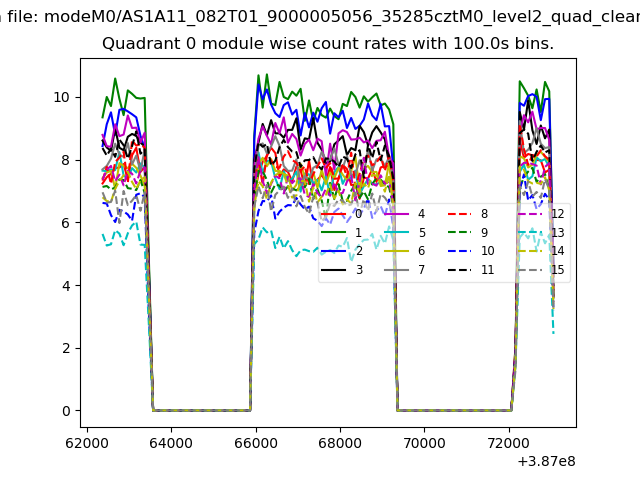 |
 |
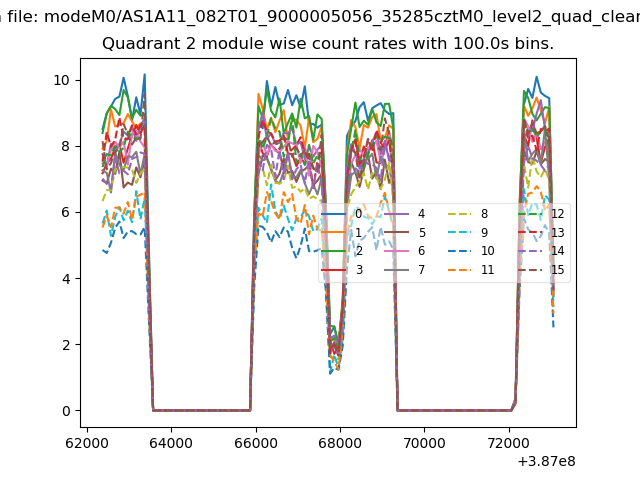
| Module-wise count rates for Quadrant B Data is divided into 100 sec bins |
 |
 |
| Module-wise count rates for Quadrant C Data is divided into 100 sec bins |
 |
 |
| Module-wise count rates for Quadrant D Data is divided into 100 sec bins |
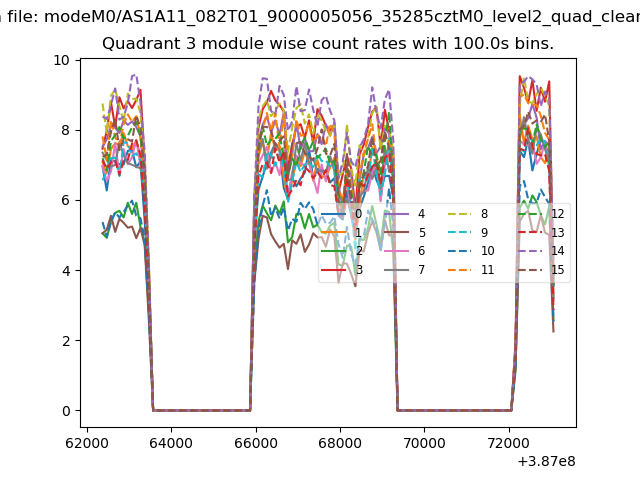 |
 |
| Parameter | Plot |
|---|---|
| CZT HV Monitor | 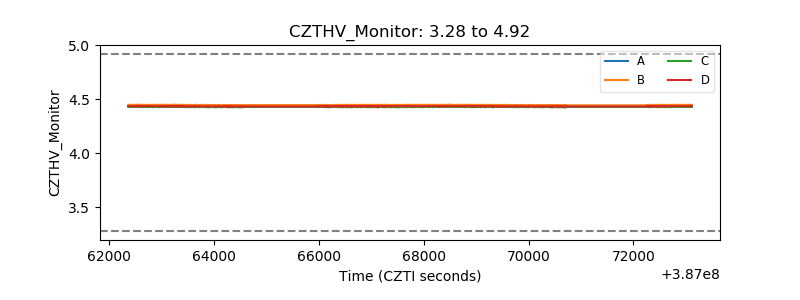 |
| D_VDD | 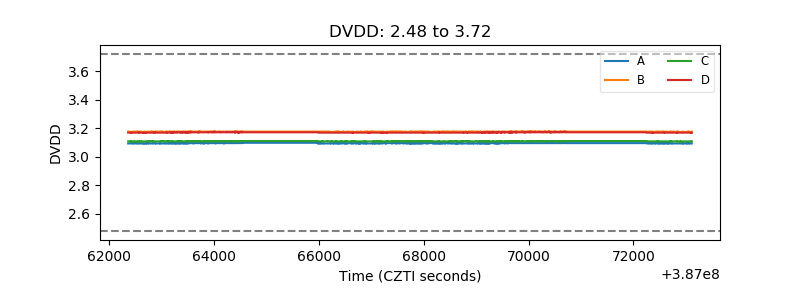 |
| Temperature 1 | 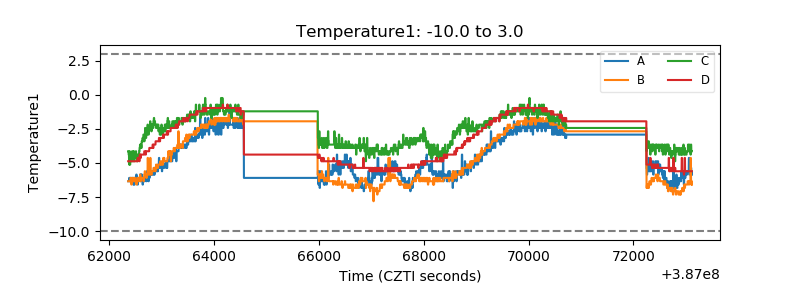 |
| Veto HV Monitor | 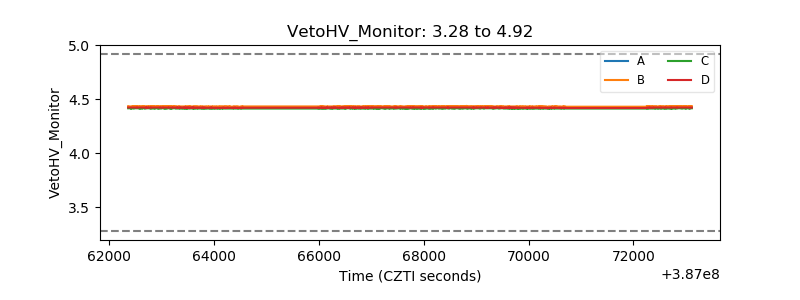 |
| Veto LLD | 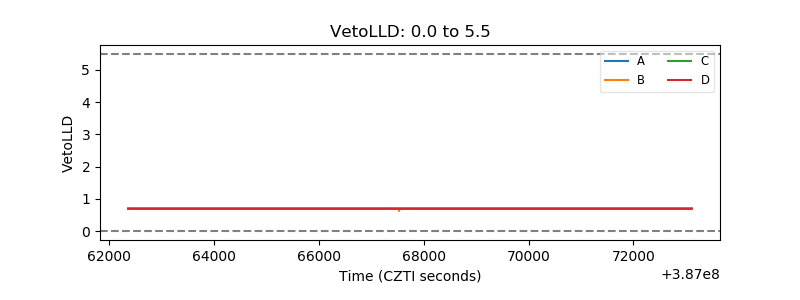 |
| Alpha Counter | 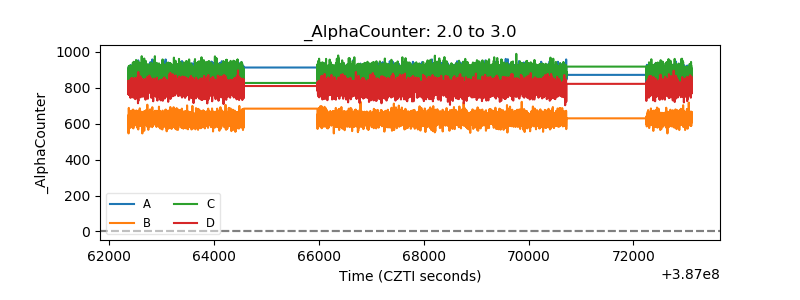 |
| _CPM_Rate | 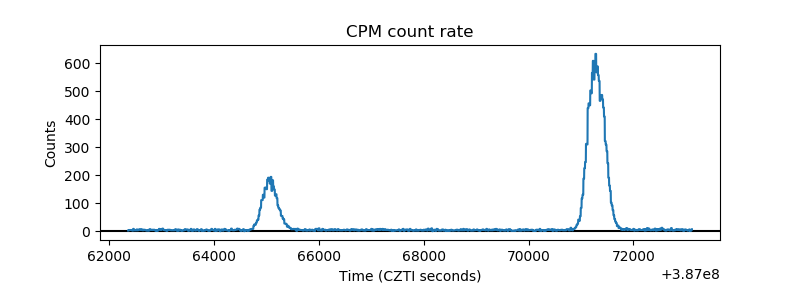 |
| CZT Counter | 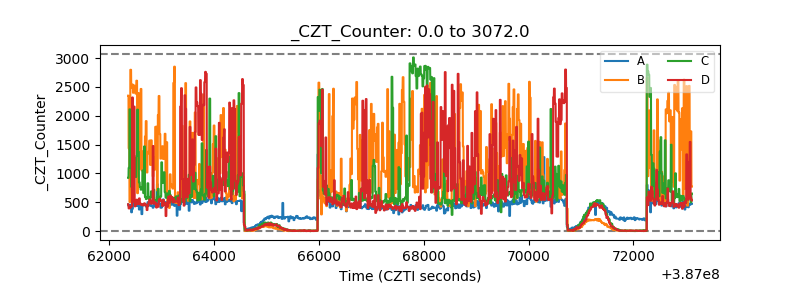 |
| +2.5 Volts monitor | 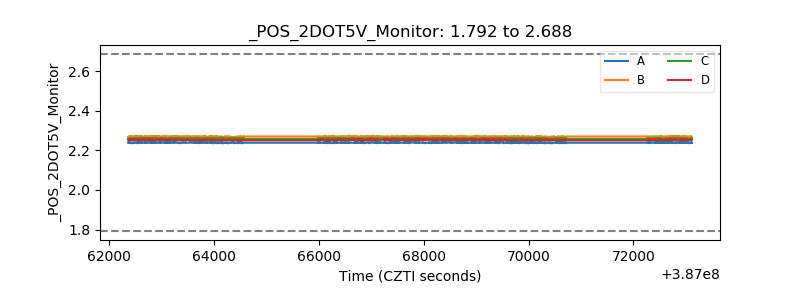 |
| +5 Volts monitor | 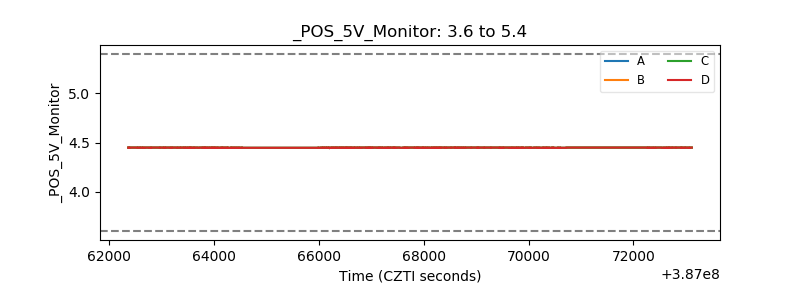 |
| _ROLL_ROT | 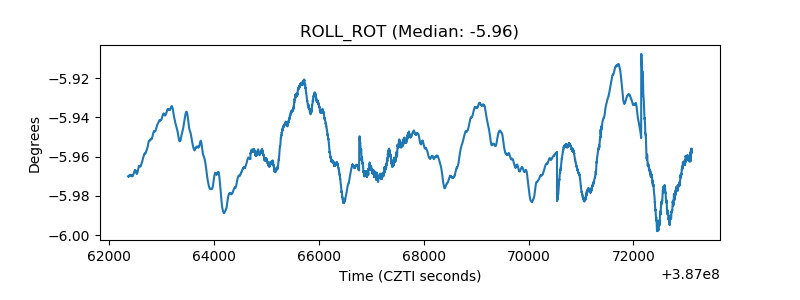 |
| _Roll_DEC | 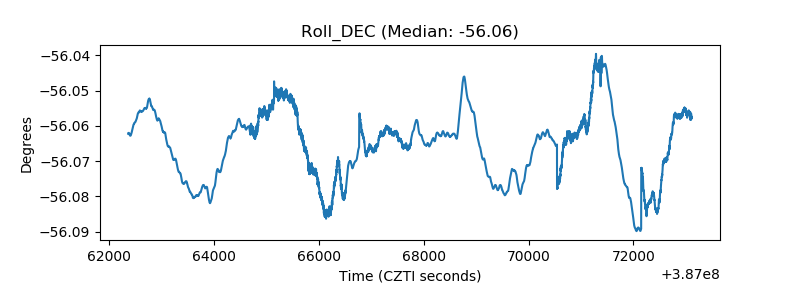 |
| _Roll_RA | 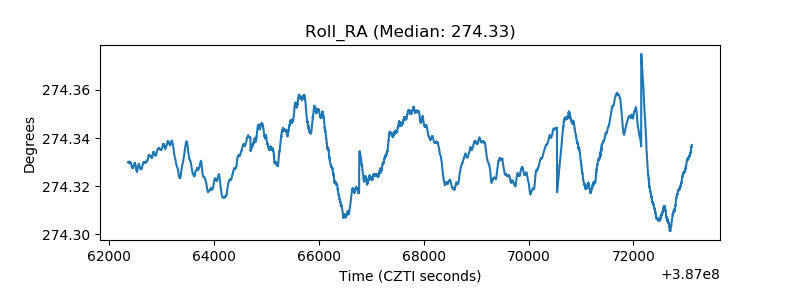 |
| Veto Counter | 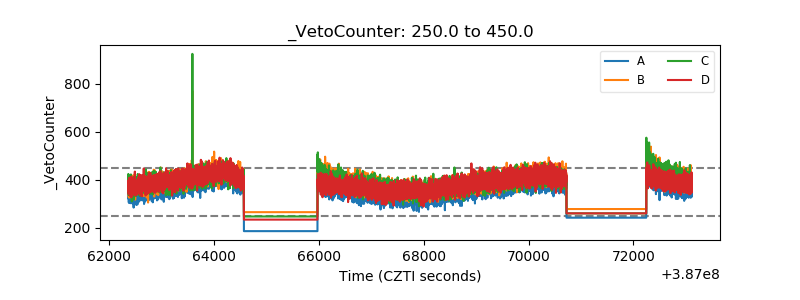 |