| Param | Original file | Final file |
|---|---|---|
| Filename | modeM0/AS1A11_082T01_9000005056_35267cztM0_level2.evt | modeM0/AS1A11_082T01_9000005056_35267cztM0_level2_quad_clean.evt |
| Size (bytes) | 290,681,280 | 39,784,320 |
| Size | 277.2 MB | 37.9 MB |
| Events in quadrant A | 1,288,144 | 268,042 |
| Events in quadrant B | 2,917,250 | 242,500 |
| Events in quadrant C | 1,660,847 | 262,036 |
| Events in quadrant D | 2,758,682 | 244,451 |
| Mode M0 | |||
|---|---|---|---|
| Quadrant | BADHDUFLAG | Total packets | Discarded packets |
| A | 0 | 5376 | 2 |
| B | 0 | 10394 | 1 |
| C | 0 | 6451 | 1 |
| D | 0 | 9958 | 1 |
| Mode SS | |||
|---|---|---|---|
| Quadrant | BADHDUFLAG | Total packets | Discarded packets |
| A | 0 | 54 | 0 |
| B | 0 | 54 | 0 |
| C | 0 | 54 | 0 |
| D | 0 | 54 | 0 |
| Mode M9 | |||
|---|---|---|---|
| Quadrant | BADHDUFLAG | Total packets | Discarded packets |
| A | 0 | 13 | 0 |
| B | 0 | 13 | 0 |
| C | 0 | 13 | 0 |
| D | 0 | 13 | 0 |
| Quadrant | Total seconds | Saturated seconds | Saturation percentage |
|---|---|---|---|
| A | 2611 | 3 | 0.114899% |
| B | 2611 | 563 | 21.562620% |
| C | 2611 | 63 | 2.412869% |
| D | 2611 | 375 | 14.362313% |
Noise dominated data is calculated using 1-second bins in cleaned event files. If a bin has >2000 counts, and if more than 50% of those come from <1% of pixels, then it is considered to be noise-dominated and hence unusable.
| Quadrant | # 1 sec bins | Bins with >0 counts | Bins with >2000 counts | High rate bins dominated by noise | Noise dominated (total time) | Noise dominated (detector-on time) | Marked lightcurve |
|---|---|---|---|---|---|---|---|
| A | 3925 | 2612 | 1 | 1 | 0.03% | 0.04% | 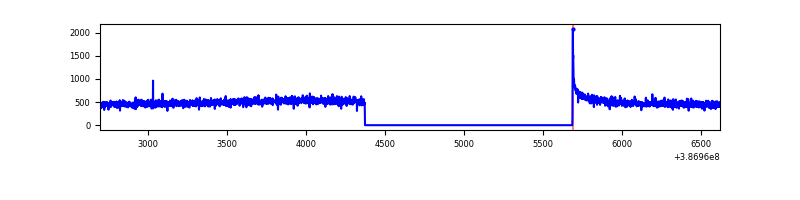 |
| B | 3925 | 2612 | 409 | 409 | 10.42% | 15.66% | 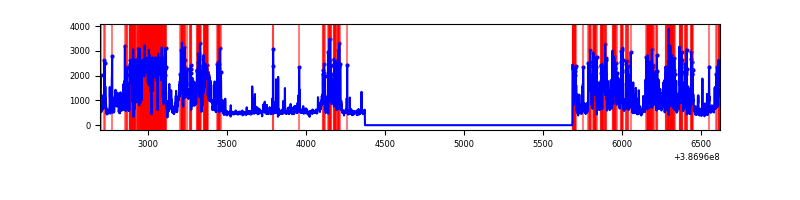 |
| C | 3925 | 2612 | 50 | 50 | 1.27% | 1.91% | 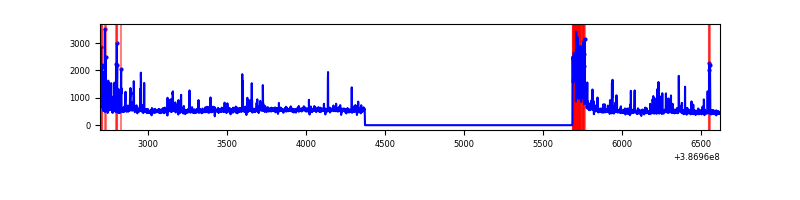 |
| D | 3925 | 2612 | 307 | 307 | 7.82% | 11.75% | 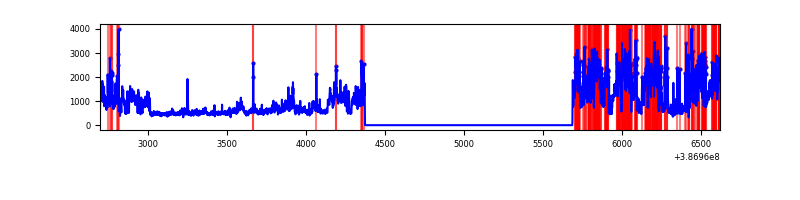 |
Top three noisy pixels from each quadrant. If the there are fewer than three noisy pixels in the level2.evt file, extra rows are filled as -1
| Pixel properties | Quadrant properties | ||||||
|---|---|---|---|---|---|---|---|
| Quadrant | DetID | PixID | Counts | Sigma | Mean | Median | Sigma |
| A | 10 | 83 | 50488 | 768.12 | 317 | 309 | 65.3 |
| A | 13 | 254 | 4933 | 70.78 | 317 | 309 | 65.3 |
| A | 15 | 223 | 3465 | 48.31 | 317 | 309 | 65.3 |
| B | 5 | 236 | 1541930 | 27188.49 | 288 | 280 | 56.7 |
| B | 5 | 172 | 207155 | 3648.44 | 288 | 280 | 56.7 |
| B | 4 | 232 | 13616 | 235.19 | 288 | 280 | 56.7 |
| C | 0 | 10 | 272331 | 3770.69 | 305 | 306 | 72.1 |
| C | 15 | 214 | 108721 | 1502.8 | 305 | 306 | 72.1 |
| C | 15 | 208 | 40256 | 553.77 | 305 | 306 | 72.1 |
| D | 12 | 227 | 847542 | 11578.02 | 293 | 283 | 73.2 |
| D | 10 | 118 | 433279 | 5917.0 | 293 | 283 | 73.2 |
| D | 8 | 195 | 106308 | 1448.86 | 293 | 283 | 73.2 |
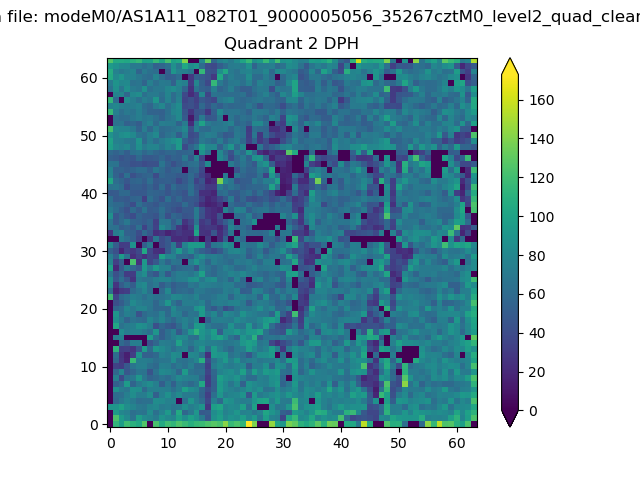
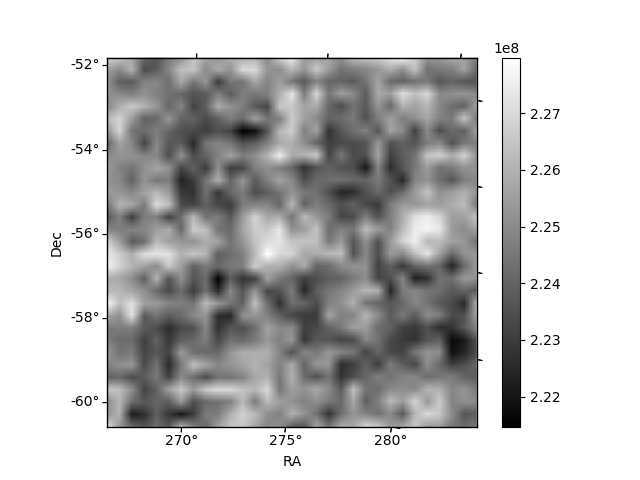
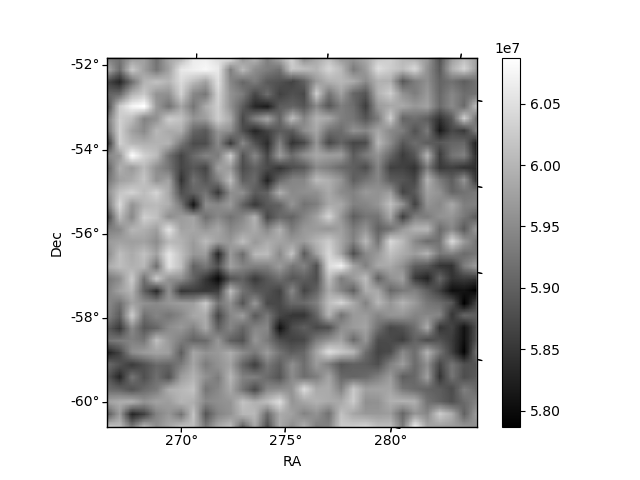
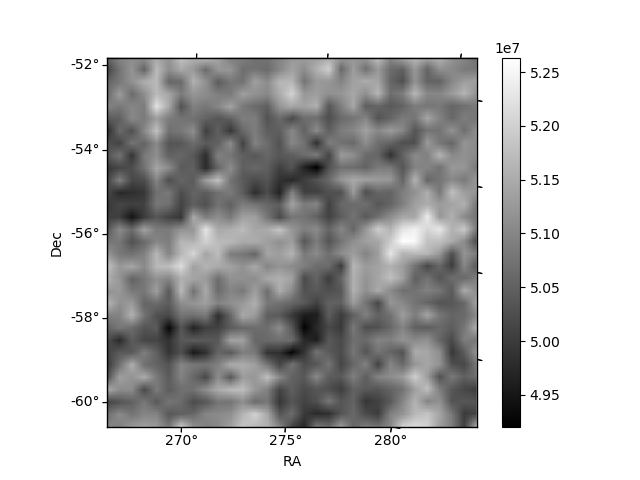
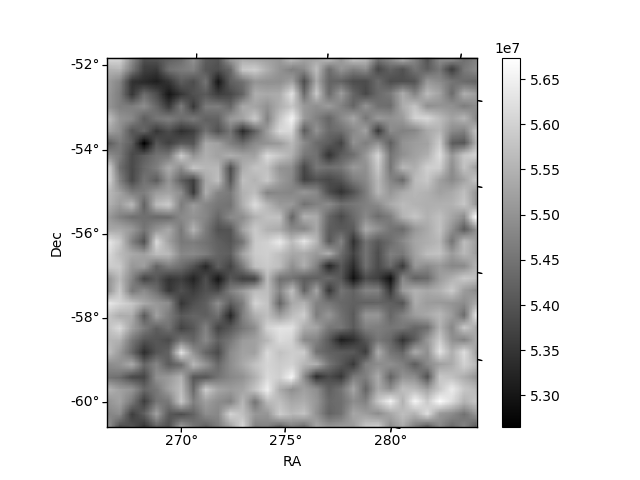
Histogram calculated using DETX and DETY for each event in the final _common_clean file
| Quadrant A | 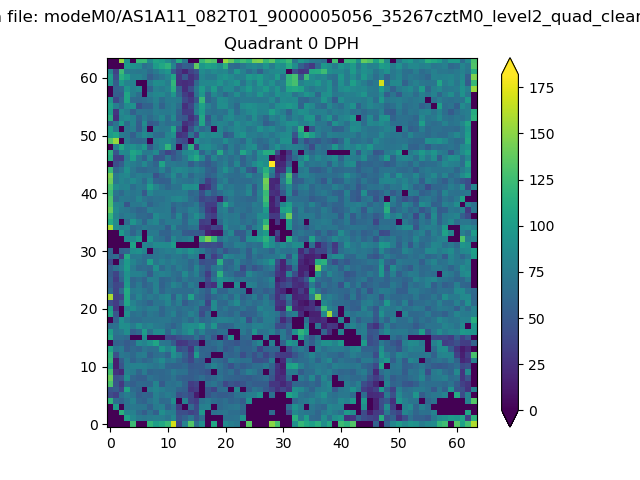 |
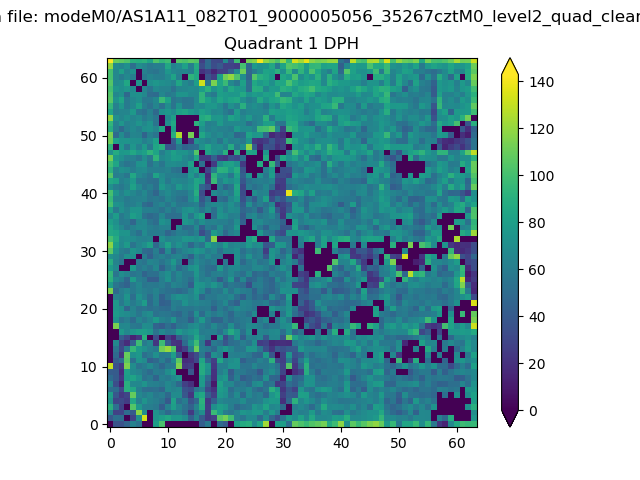 |
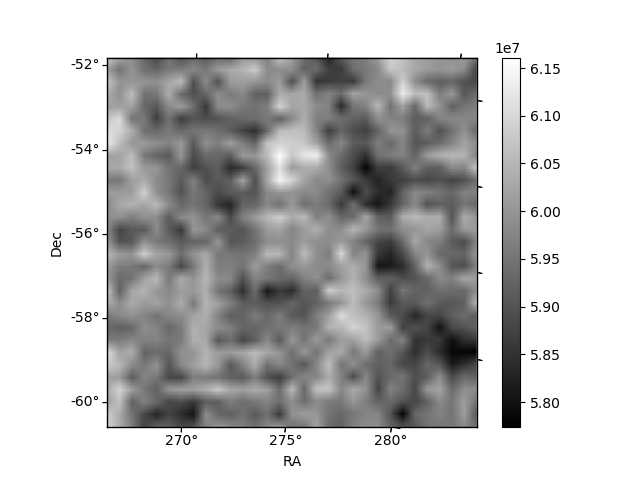
Quadrant B |
|---|---|---|---|
| Quadrant D | 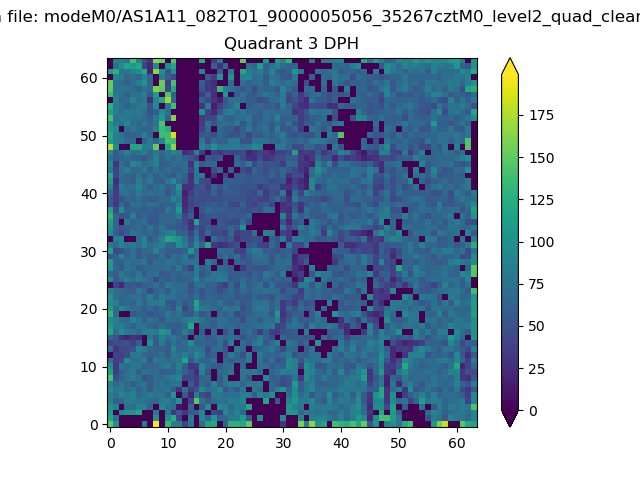 |
 |
Quadrant C |
| Plot type | Count rate plots | Images |
|---|---|---|
| Comparison with Poisson distribution Blue bars denote a histogram of data divided into 1 sec bins. Red curve is a Poisson curve with rate = median count rate of data. |
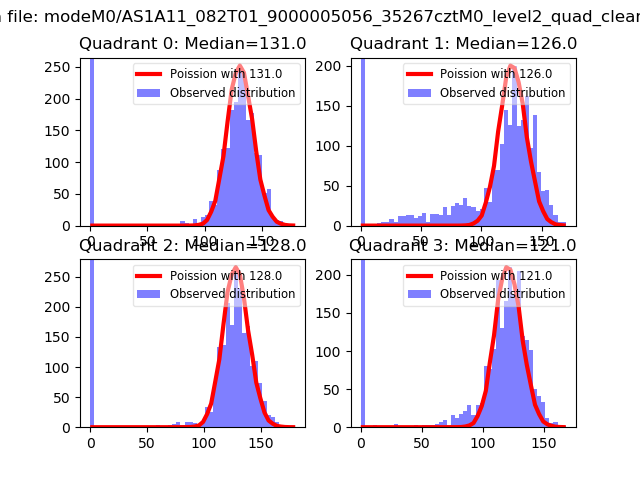 |
 |
| Quadrant-wise count rates Data is divided into 100 sec bins |
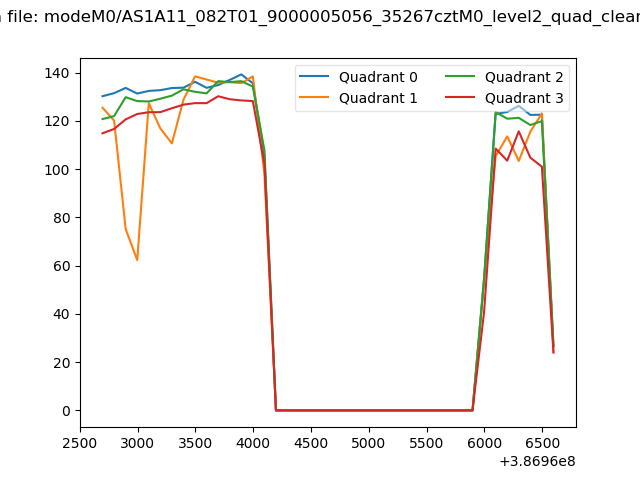 |
|
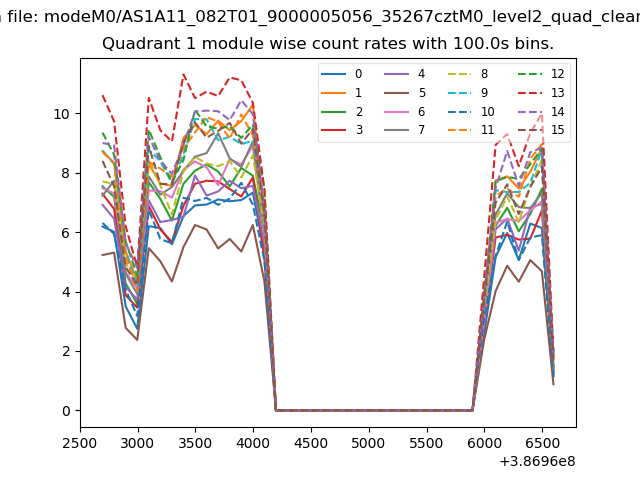
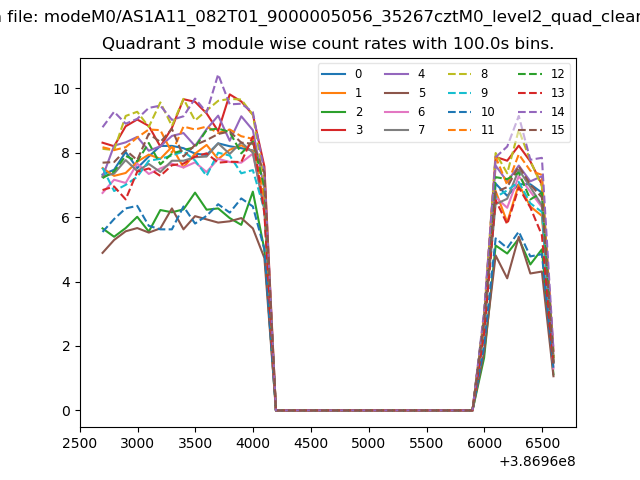
| Module-wise count rates for Quadrant A Data is divided into 100 sec bins |
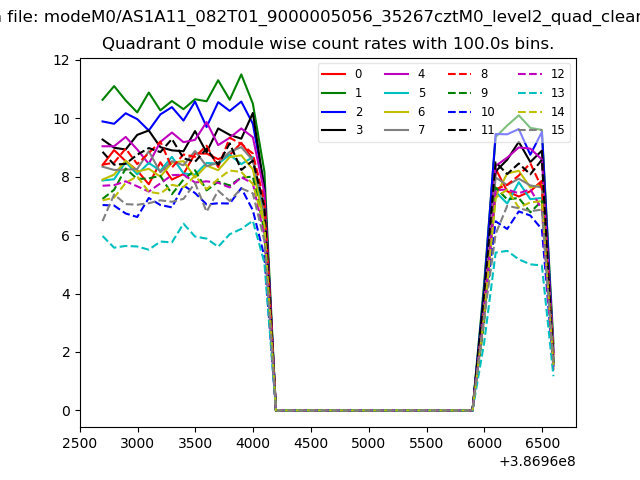 |
 |
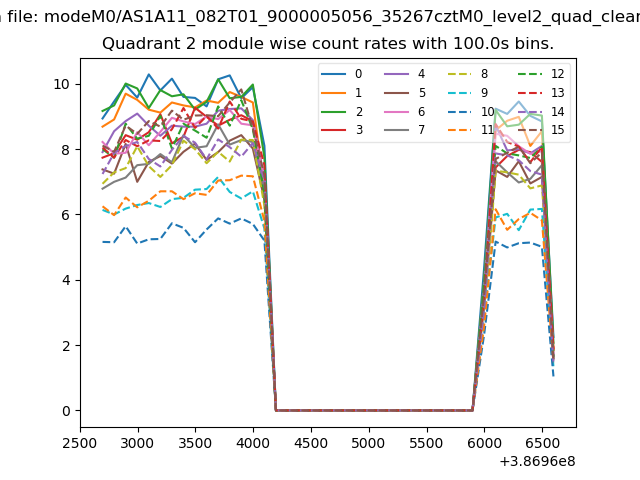
| Module-wise count rates for Quadrant B Data is divided into 100 sec bins |
 |
 |
| Module-wise count rates for Quadrant C Data is divided into 100 sec bins |
 |
 |
| Module-wise count rates for Quadrant D Data is divided into 100 sec bins |
 |
 |
| Parameter | Plot |
|---|---|
| CZT HV Monitor | 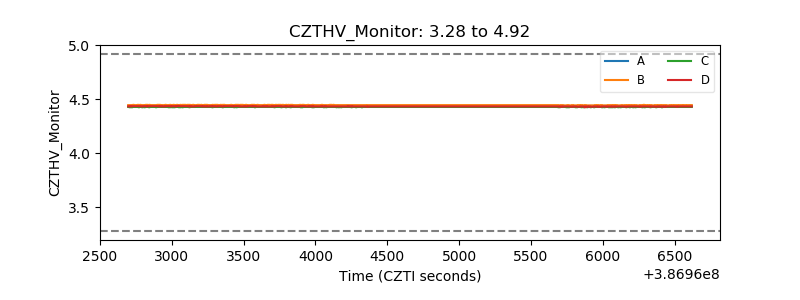 |
| D_VDD | 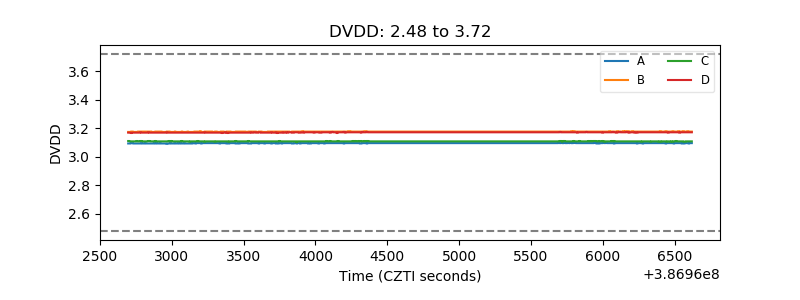 |
| Temperature 1 | 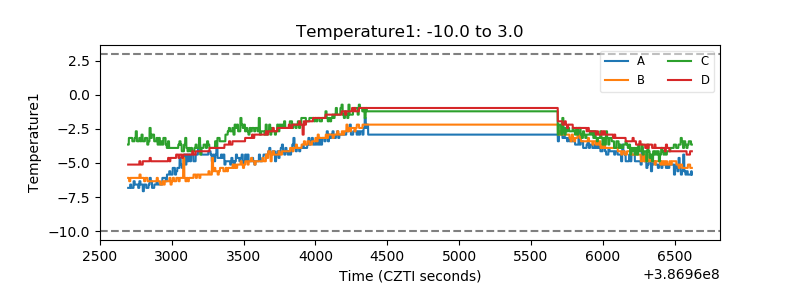 |
| Veto HV Monitor | 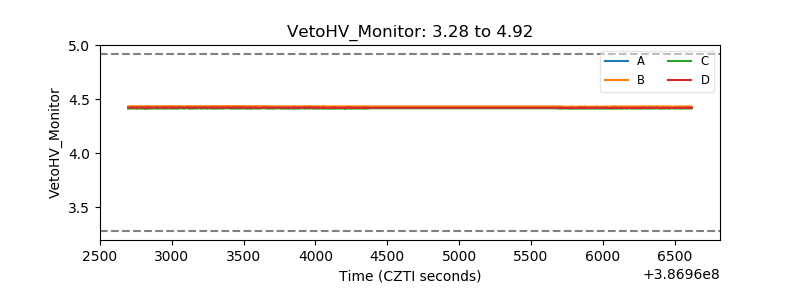 |
| Veto LLD | 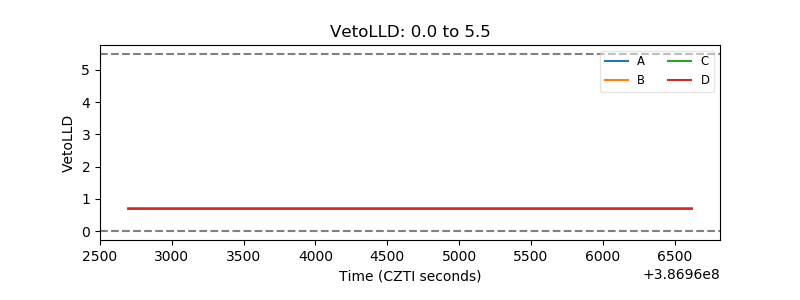 |
| Alpha Counter | 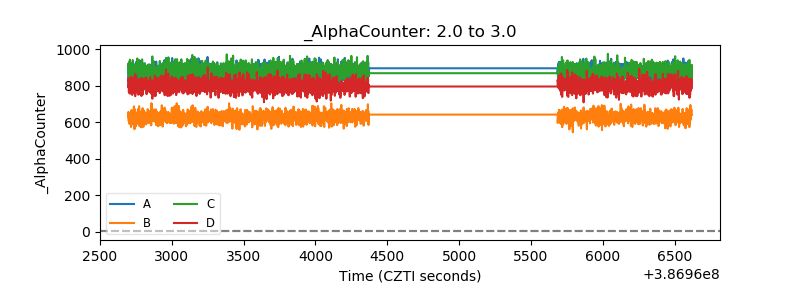 |
| _CPM_Rate | 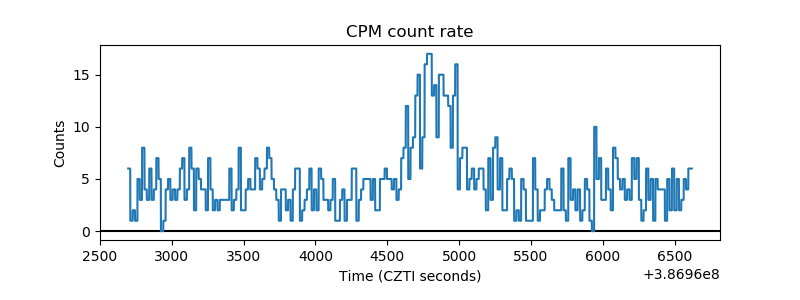 |
| CZT Counter | 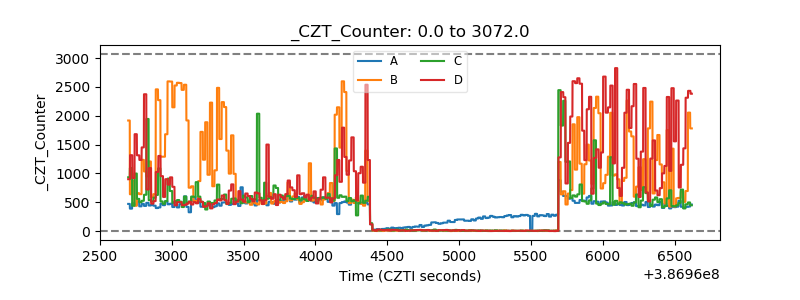 |
| +2.5 Volts monitor | 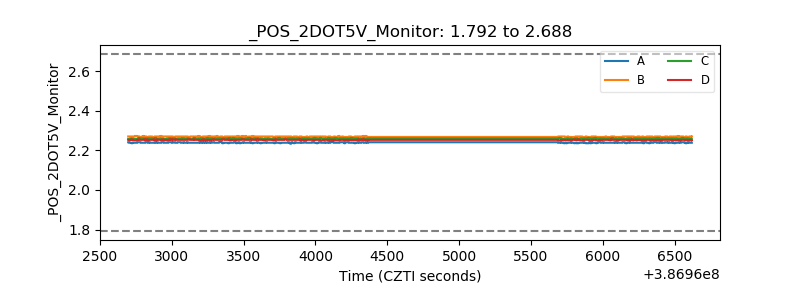 |
| +5 Volts monitor | 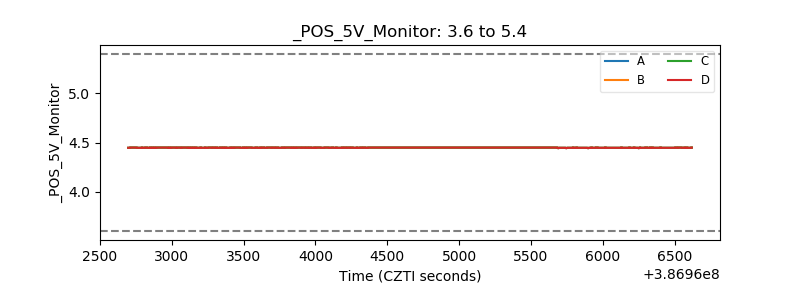 |
| _ROLL_ROT | 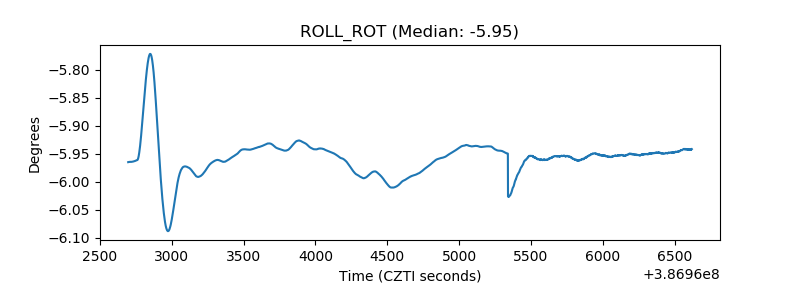 |
| _Roll_DEC | 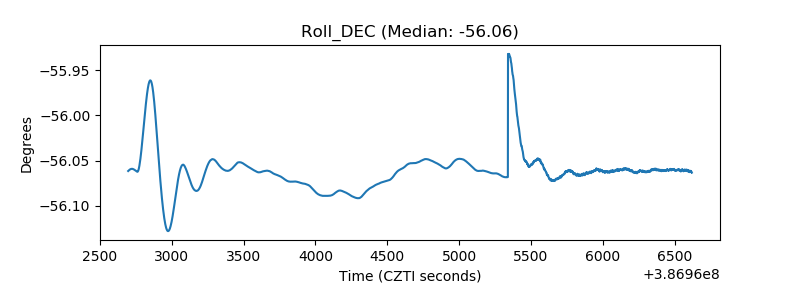 |
| _Roll_RA | 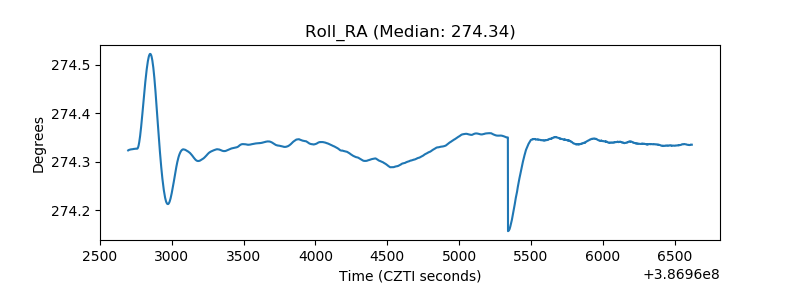 |
| Veto Counter | 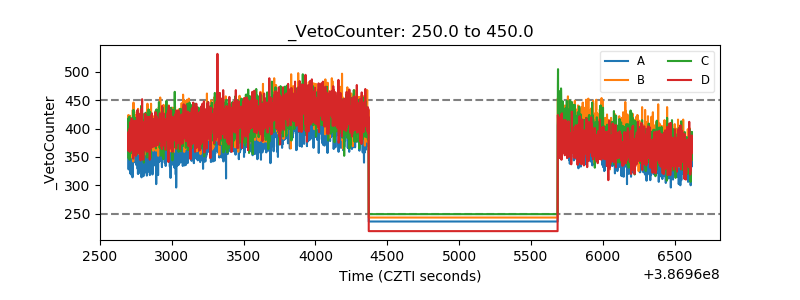 |