| Param | Original file | Final file |
|---|---|---|
| Filename | modeM0/AS1A11_047T09_9000005054_35267cztM0_level2.evt | modeM0/AS1A11_047T09_9000005054_35267cztM0_level2_quad_clean.evt |
| Size (bytes) | 242,513,280 | 32,019,840 |
| Size | 231.3 MB | 30.5 MB |
| Events in quadrant A | 853,773 | 231,123 |
| Events in quadrant B | 3,021,356 | 184,500 |
| Events in quadrant C | 2,147,773 | 201,660 |
| Events in quadrant D | 1,193,737 | 215,713 |
| Mode M9 | |||
|---|---|---|---|
| Quadrant | BADHDUFLAG | Total packets | Discarded packets |
| A | 0 | 7 | 0 |
| B | 0 | 7 | 0 |
| C | 0 | 7 | 0 |
| D | 0 | 8 | 0 |
| Mode M0 | |||
|---|---|---|---|
| Quadrant | BADHDUFLAG | Total packets | Discarded packets |
| A | 0 | 3828 | 1 |
| B | 0 | 10279 | 1 |
| C | 0 | 7630 | 1 |
| D | 0 | 4713 | 1 |
| Mode SS | |||
|---|---|---|---|
| Quadrant | BADHDUFLAG | Total packets | Discarded packets |
| A | 0 | 38 | 0 |
| B | 0 | 38 | 0 |
| C | 0 | 38 | 0 |
| D | 0 | 38 | 0 |
| Quadrant | Total seconds | Saturated seconds | Saturation percentage |
|---|---|---|---|
| A | 1854 | 4 | 0.215750% |
| B | 1854 | 740 | 39.913700% |
| C | 1854 | 385 | 20.765912% |
| D | 1854 | 52 | 2.804746% |
Noise dominated data is calculated using 1-second bins in cleaned event files. If a bin has >2000 counts, and if more than 50% of those come from <1% of pixels, then it is considered to be noise-dominated and hence unusable.
| Quadrant | # 1 sec bins | Bins with >0 counts | Bins with >2000 counts | High rate bins dominated by noise | Noise dominated (total time) | Noise dominated (detector-on time) | Marked lightcurve |
|---|---|---|---|---|---|---|---|
| A | 1854 | 1854 | 0 | 0 | 0.00% | 0.00% | 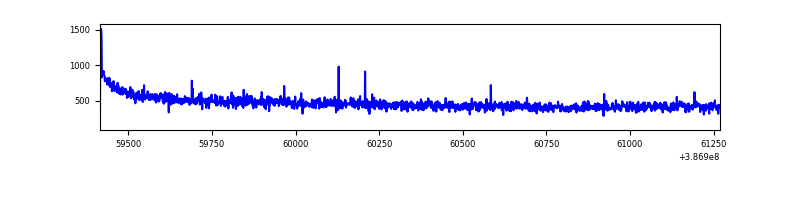 |
| B | 1854 | 1854 | 634 | 634 | 34.20% | 34.20% | 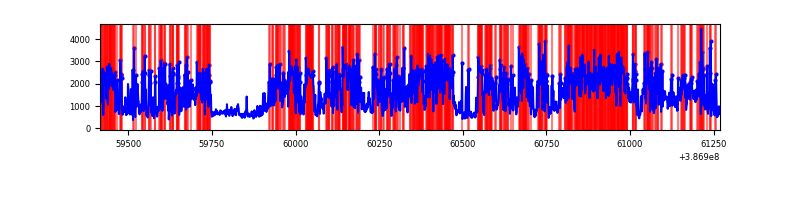 |
| C | 1854 | 1854 | 345 | 345 | 18.61% | 18.61% | 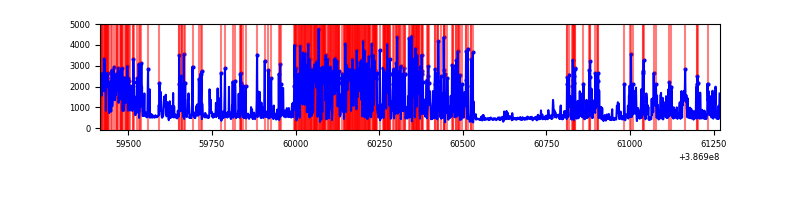 |
| D | 1854 | 1854 | 36 | 36 | 1.94% | 1.94% | 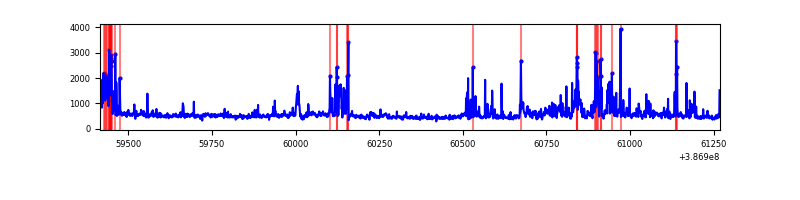 |
Top three noisy pixels from each quadrant. If the there are fewer than three noisy pixels in the level2.evt file, extra rows are filled as -1
| Pixel properties | Quadrant properties | ||||||
|---|---|---|---|---|---|---|---|
| Quadrant | DetID | PixID | Counts | Sigma | Mean | Median | Sigma |
| A | 10 | 83 | 46257 | 1046.79 | 206 | 201 | 44.0 |
| A | 13 | 254 | 3457 | 74.0 | 206 | 201 | 44.0 |
| A | 13 | 6 | 3321 | 70.91 | 206 | 201 | 44.0 |
| B | 5 | 236 | 2044747 | 59208.24 | 171 | 166 | 34.5 |
| B | 5 | 172 | 159877 | 4625.01 | 171 | 166 | 34.5 |
| B | 4 | 232 | 66158 | 1911.04 | 171 | 166 | 34.5 |
| C | 0 | 10 | 1339708 | 30320.84 | 183 | 184 | 44.2 |
| C | 15 | 214 | 74657 | 1685.74 | 183 | 184 | 44.2 |
| C | 14 | 67 | 6482 | 142.56 | 183 | 184 | 44.2 |
| D | 12 | 227 | 100847 | 1998.59 | 200 | 194 | 50.4 |
| D | 8 | 195 | 69674 | 1379.61 | 200 | 194 | 50.4 |
| D | 10 | 118 | 62731 | 1241.75 | 200 | 194 | 50.4 |
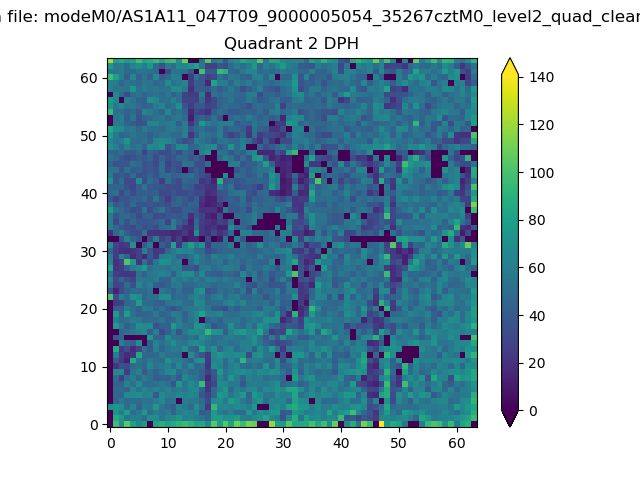
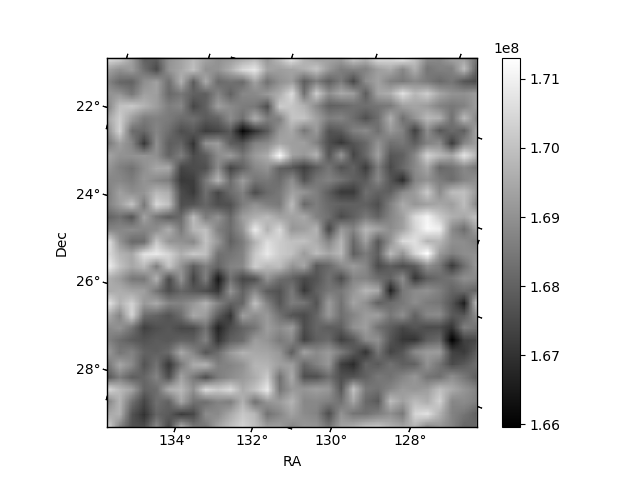
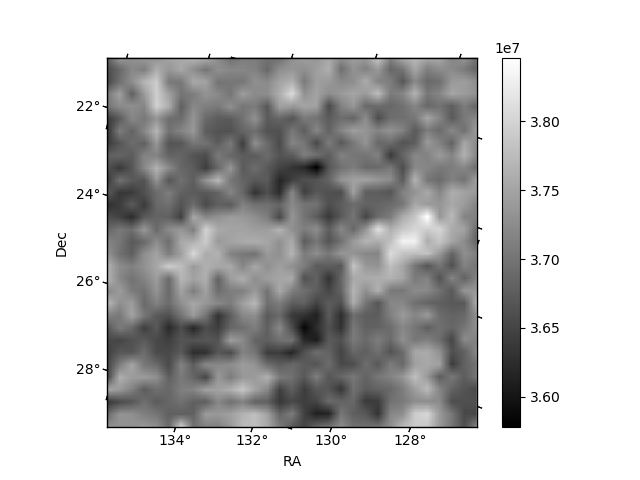
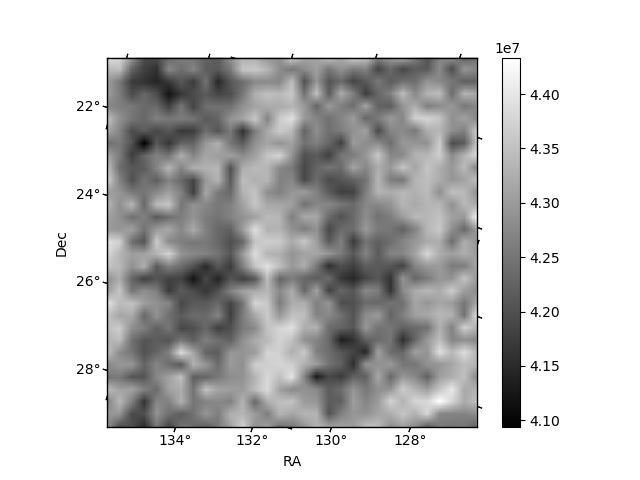
Histogram calculated using DETX and DETY for each event in the final _common_clean file
| Quadrant A | 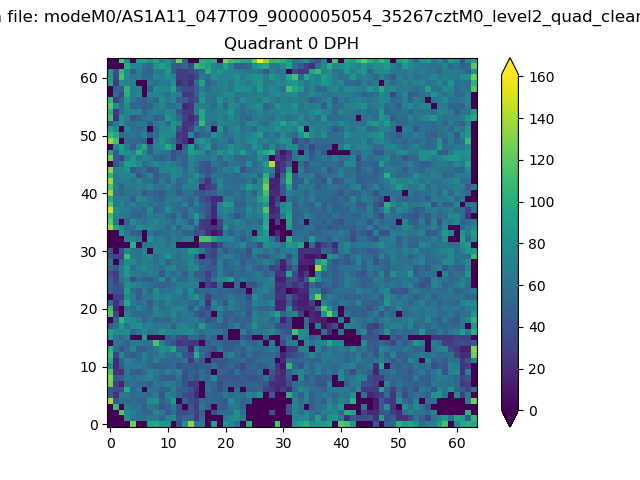 |
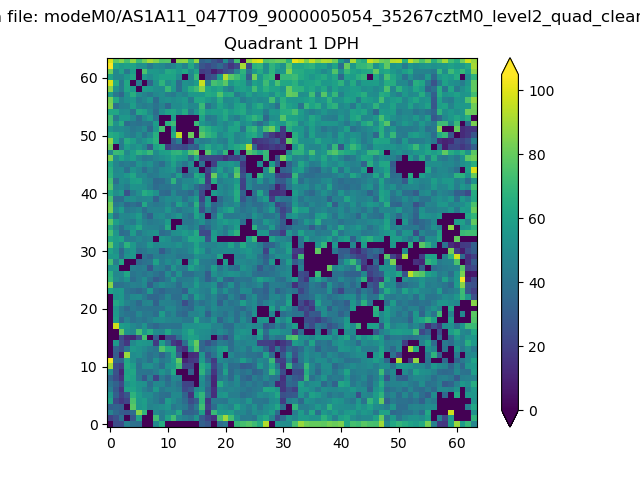 |
Quadrant B |
|---|---|---|---|
| Quadrant D | 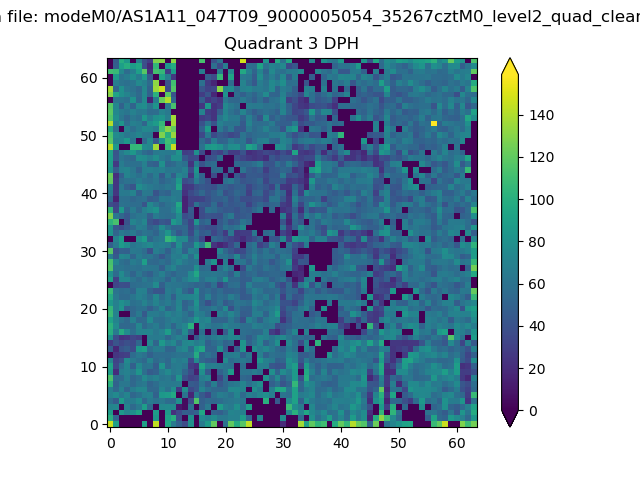 |
 |
Quadrant C |
| Plot type | Count rate plots | Images |
|---|---|---|
| Comparison with Poisson distribution Blue bars denote a histogram of data divided into 1 sec bins. Red curve is a Poisson curve with rate = median count rate of data. |
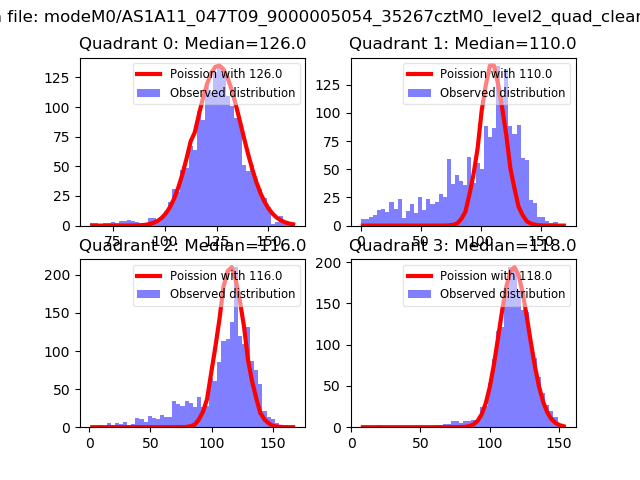 |
 |
| Quadrant-wise count rates Data is divided into 100 sec bins |
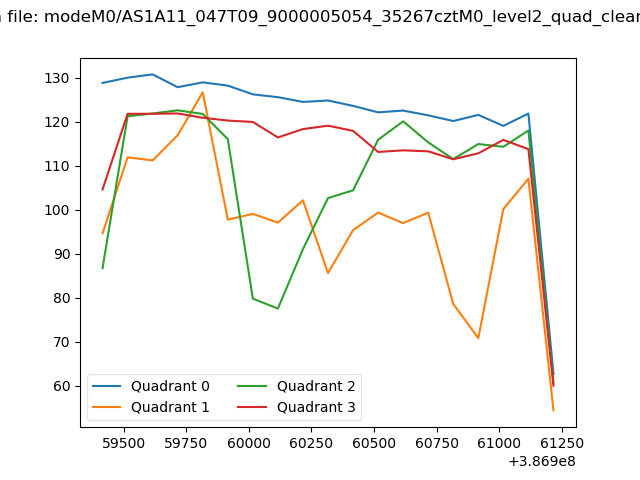 |
|
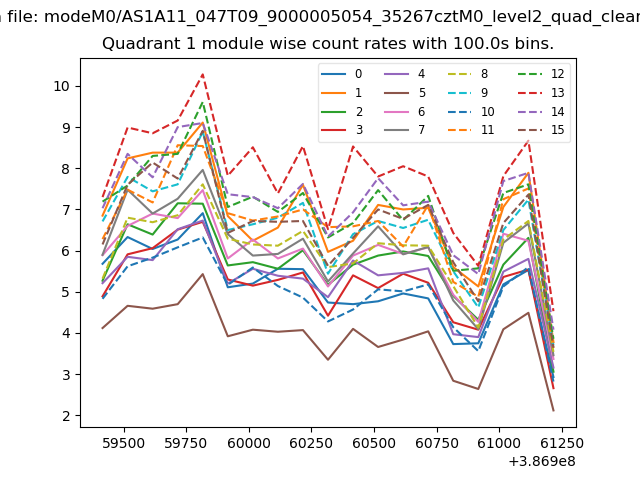
| Module-wise count rates for Quadrant A Data is divided into 100 sec bins |
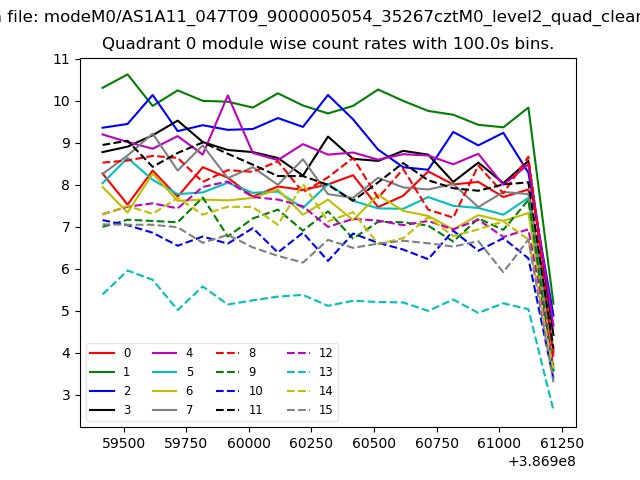 |
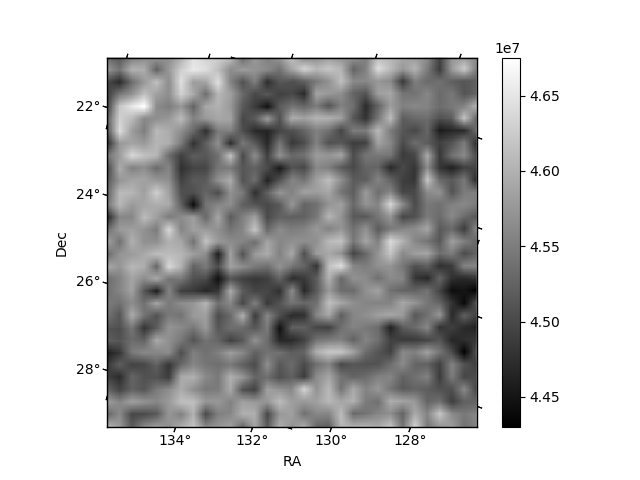 |
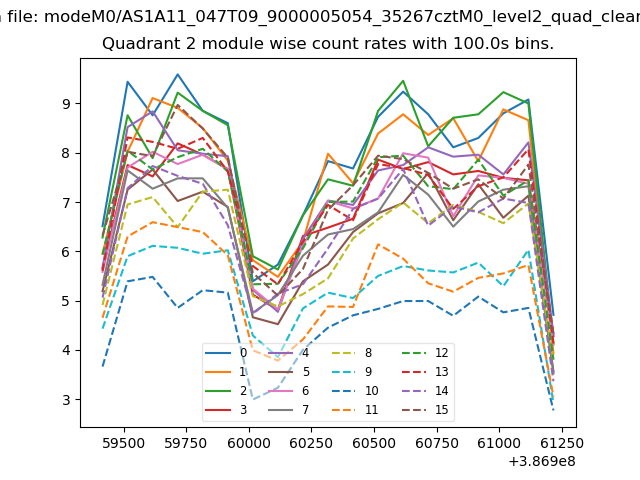
| Module-wise count rates for Quadrant B Data is divided into 100 sec bins |
 |
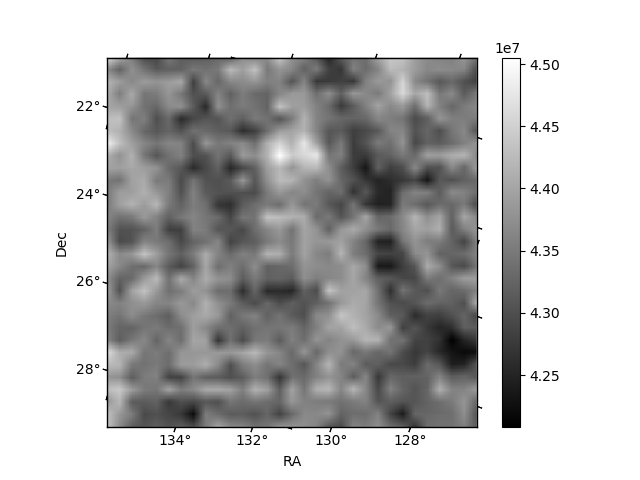 |
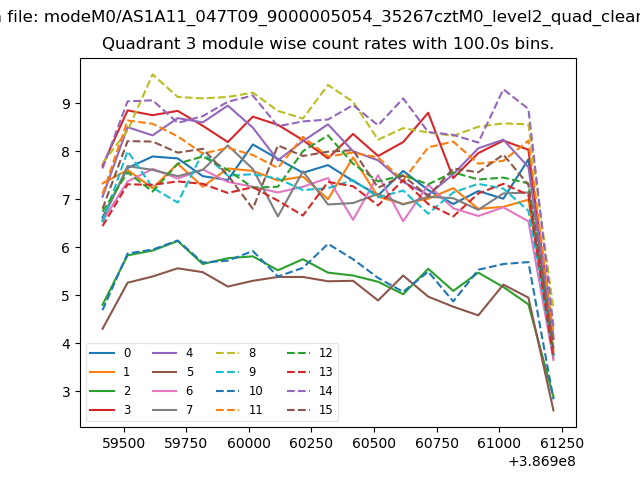
| Module-wise count rates for Quadrant C Data is divided into 100 sec bins |
 |
 |
| Module-wise count rates for Quadrant D Data is divided into 100 sec bins |
 |
 |
| Parameter | Plot |
|---|---|
| CZT HV Monitor | 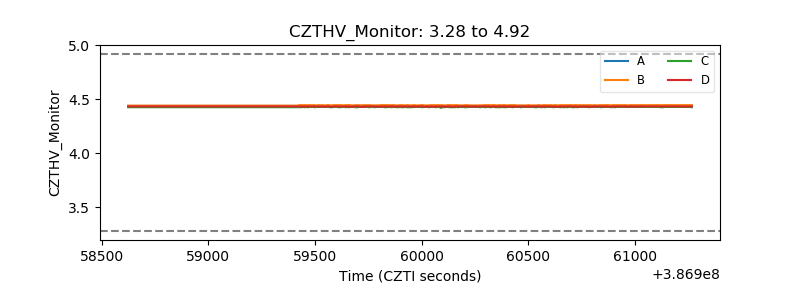 |
| D_VDD | 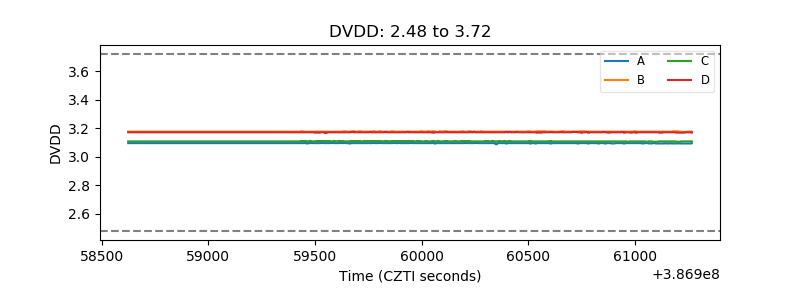 |
| Temperature 1 | 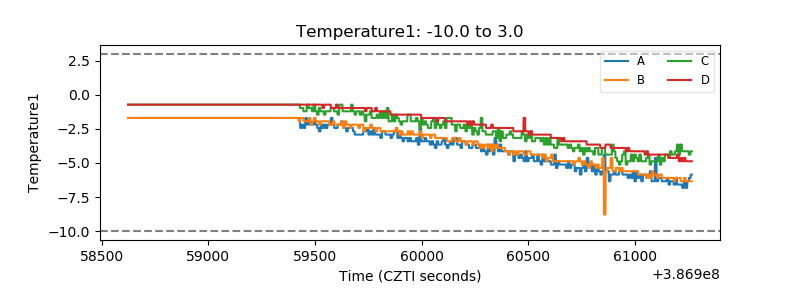 |
| Veto HV Monitor | 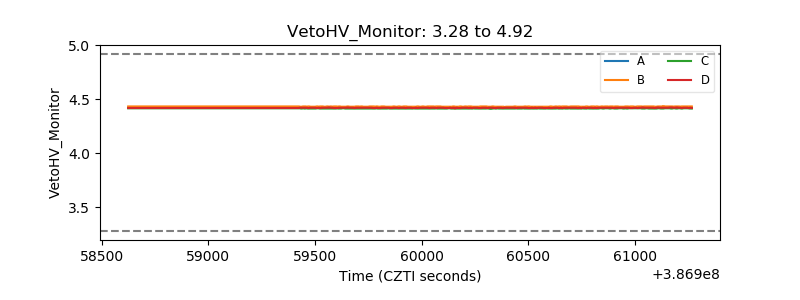 |
| Veto LLD | 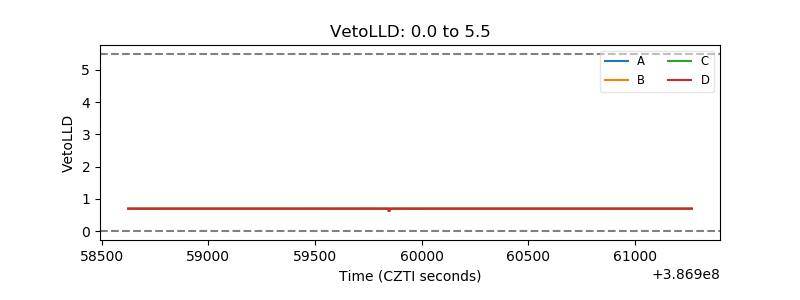 |
| Alpha Counter | 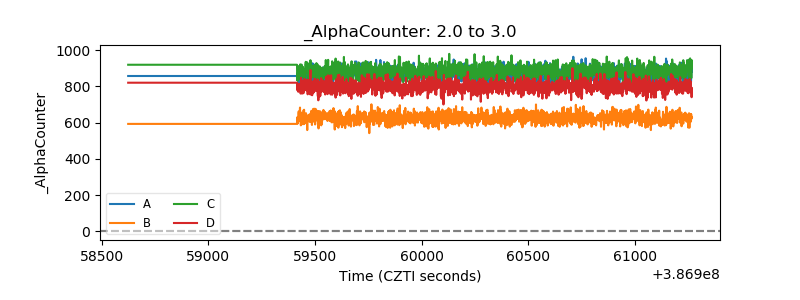 |
| _CPM_Rate | 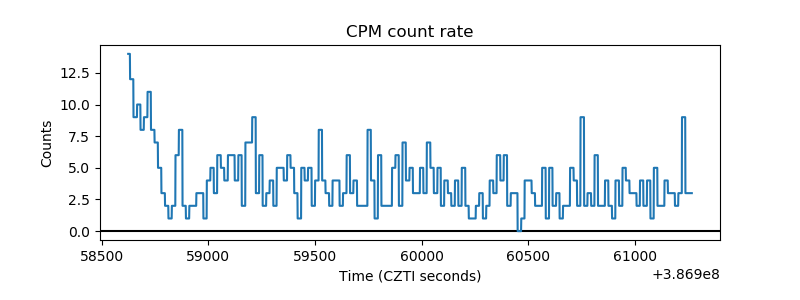 |
| CZT Counter |  |
| +2.5 Volts monitor | 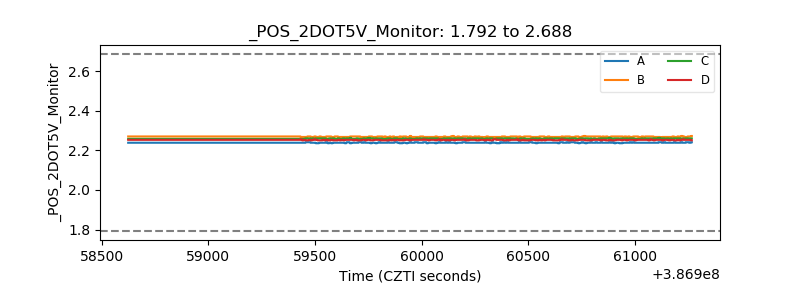 |
| +5 Volts monitor | 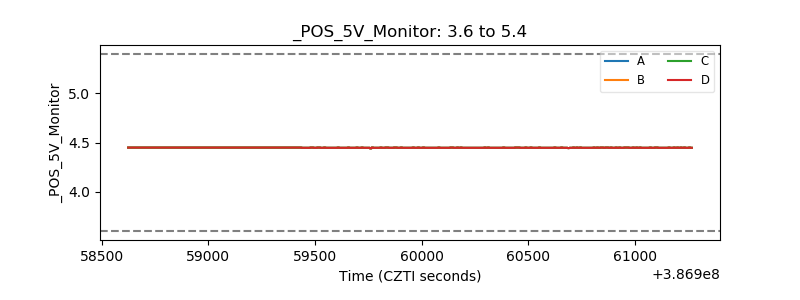 |
| _ROLL_ROT | 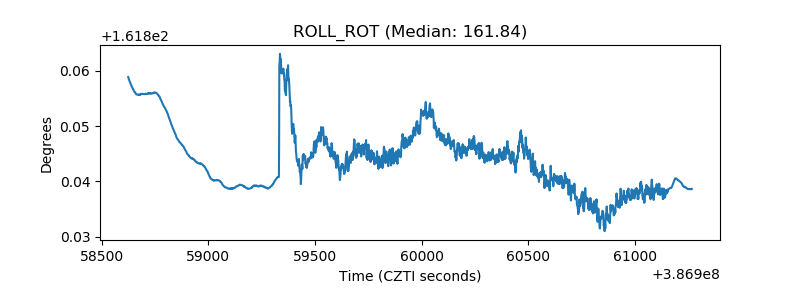 |
| _Roll_DEC | 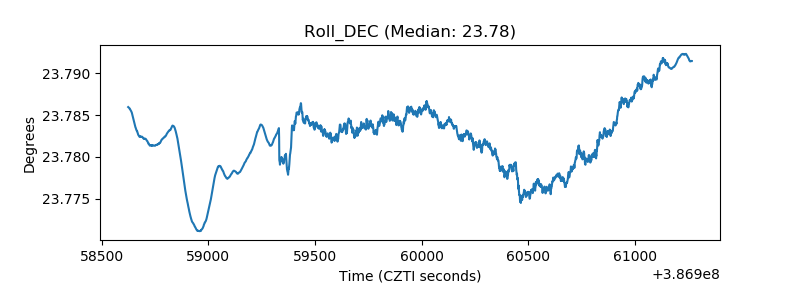 |
| _Roll_RA | 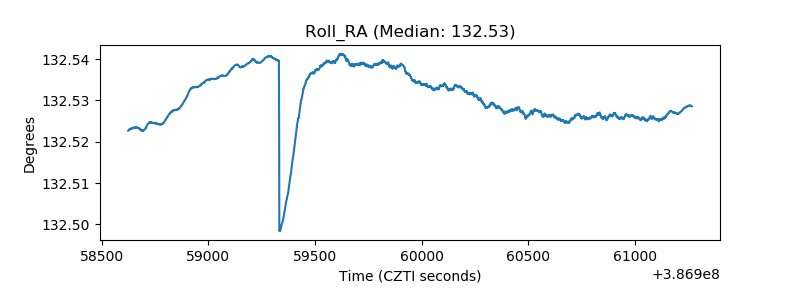 |
| Veto Counter | 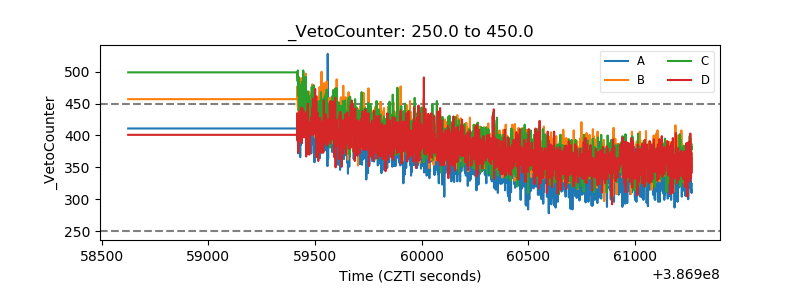 |