| Param | Original file | Final file |
|---|---|---|
| Filename | modeM0/AS1A11_047T09_9000005054_35260cztM0_level2.evt | modeM0/AS1A11_047T09_9000005054_35260cztM0_level2_quad_clean.evt |
| Size (bytes) | 598,417,920 | 56,514,240 |
| Size | 570.7 MB | 53.9 MB |
| Events in quadrant A | 2,788,043 | 367,048 |
| Events in quadrant B | 6,537,841 | 334,058 |
| Events in quadrant C | 3,277,076 | 359,053 |
| Events in quadrant D | 5,160,668 | 278,148 |
| Mode M9 | |||
|---|---|---|---|
| Quadrant | BADHDUFLAG | Total packets | Discarded packets |
| A | 0 | 25 | 0 |
| B | 0 | 25 | 0 |
| C | 0 | 25 | 0 |
| D | 0 | 26 | 0 |
| Mode M0 | |||
|---|---|---|---|
| Quadrant | BADHDUFLAG | Total packets | Discarded packets |
| A | 0 | 11314 | 3 |
| B | 0 | 23149 | 2 |
| C | 0 | 12703 | 2 |
| D | 0 | 18741 | 2 |
| Mode SS | |||
|---|---|---|---|
| Quadrant | BADHDUFLAG | Total packets | Discarded packets |
| A | 0 | 108 | 0 |
| B | 0 | 108 | 0 |
| C | 0 | 108 | 0 |
| D | 0 | 108 | 0 |
| Quadrant | Total seconds | Saturated seconds | Saturation percentage |
|---|---|---|---|
| A | 5314 | 8 | 0.150546% |
| B | 5314 | 1216 | 22.882951% |
| C | 5314 | 149 | 2.803914% |
| D | 5314 | 911 | 17.143395% |
Noise dominated data is calculated using 1-second bins in cleaned event files. If a bin has >2000 counts, and if more than 50% of those come from <1% of pixels, then it is considered to be noise-dominated and hence unusable.
| Quadrant | # 1 sec bins | Bins with >0 counts | Bins with >2000 counts | High rate bins dominated by noise | Noise dominated (total time) | Noise dominated (detector-on time) | Marked lightcurve |
|---|---|---|---|---|---|---|---|
| A | 7227 | 5315 | 1 | 1 | 0.01% | 0.02% | 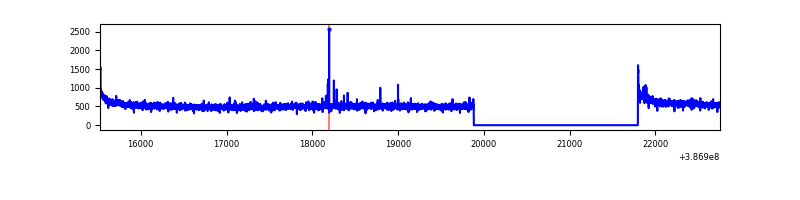 |
| B | 7227 | 5315 | 786 | 786 | 10.88% | 14.79% | 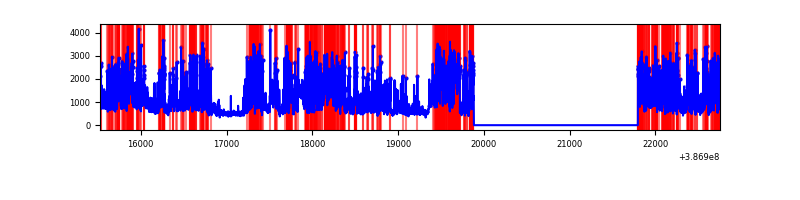 |
| C | 7227 | 5315 | 123 | 123 | 1.70% | 2.31% | 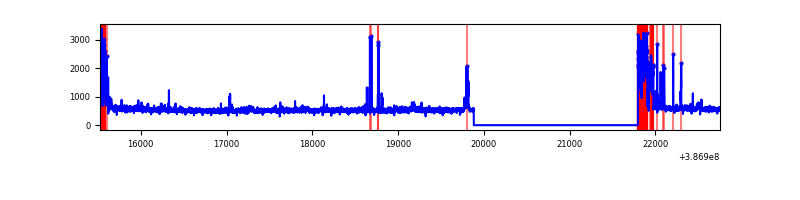 |
| D | 7227 | 5315 | 668 | 668 | 9.24% | 12.57% | 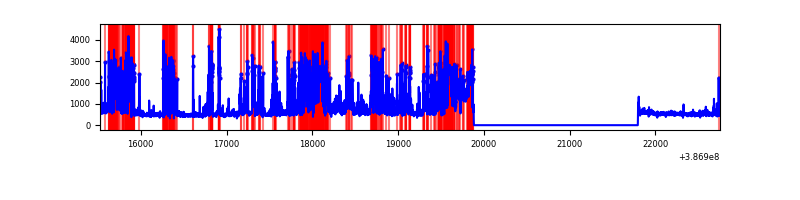 |
Top three noisy pixels from each quadrant. If the there are fewer than three noisy pixels in the level2.evt file, extra rows are filled as -1
| Pixel properties | Quadrant properties | ||||||
|---|---|---|---|---|---|---|---|
| Quadrant | DetID | PixID | Counts | Sigma | Mean | Median | Sigma |
| A | 10 | 83 | 97681 | 705.1 | 688 | 677 | 137.6 |
| A | 13 | 6 | 11343 | 77.53 | 688 | 677 | 137.6 |
| A | 7 | 191 | 9700 | 65.59 | 688 | 677 | 137.6 |
| B | 5 | 236 | 3486715 | 29203.39 | 632 | 618 | 119.4 |
| B | 5 | 172 | 352949 | 2951.51 | 632 | 618 | 119.4 |
| B | 3 | 112 | 96054 | 799.48 | 632 | 618 | 119.4 |
| C | 0 | 10 | 235902 | 1564.55 | 650 | 654 | 150.4 |
| C | 15 | 214 | 224552 | 1489.07 | 650 | 654 | 150.4 |
| C | 10 | 49 | 178684 | 1184.02 | 650 | 654 | 150.4 |
| D | 12 | 235 | 1384326 | 9585.46 | 593 | 578 | 144.4 |
| D | 7 | 80 | 795140 | 5504.07 | 593 | 578 | 144.4 |
| D | 7 | 223 | 187581 | 1295.4 | 593 | 578 | 144.4 |
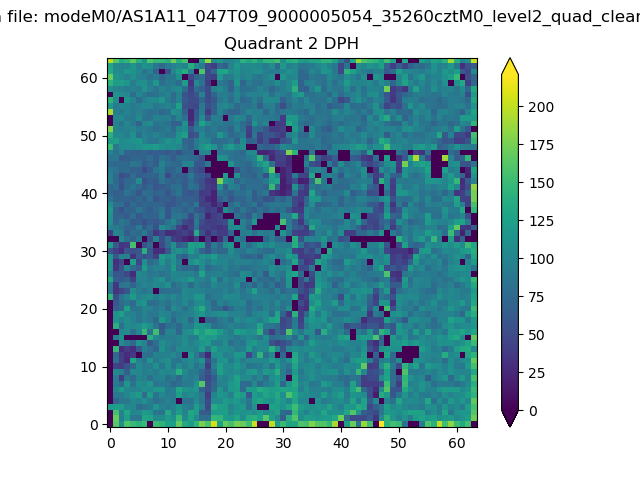
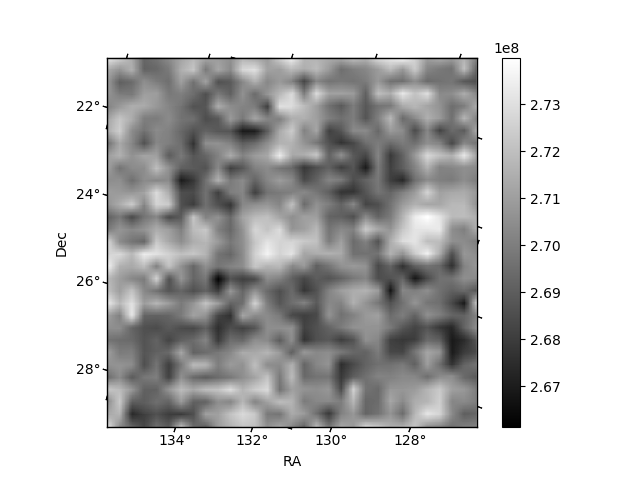
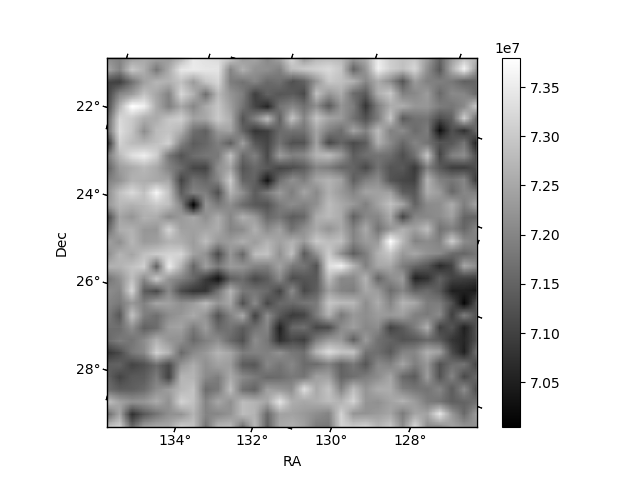
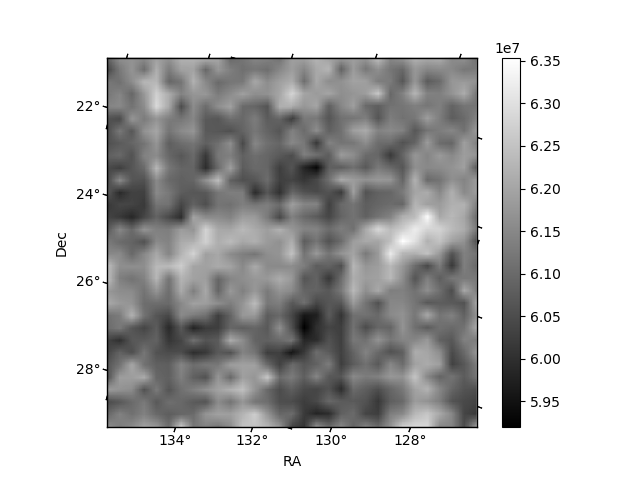
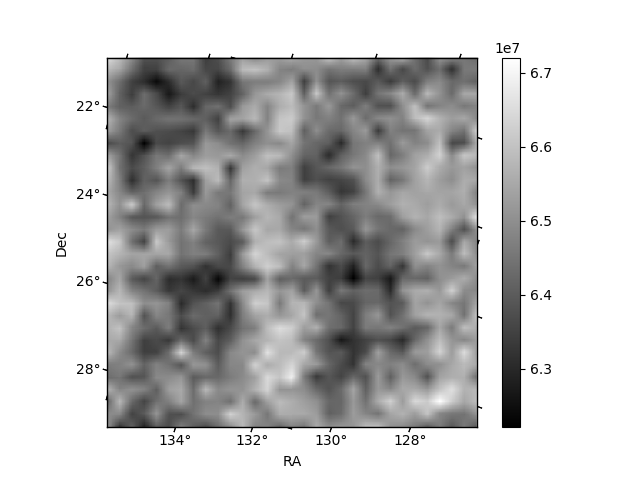
Histogram calculated using DETX and DETY for each event in the final _common_clean file
| Quadrant A | 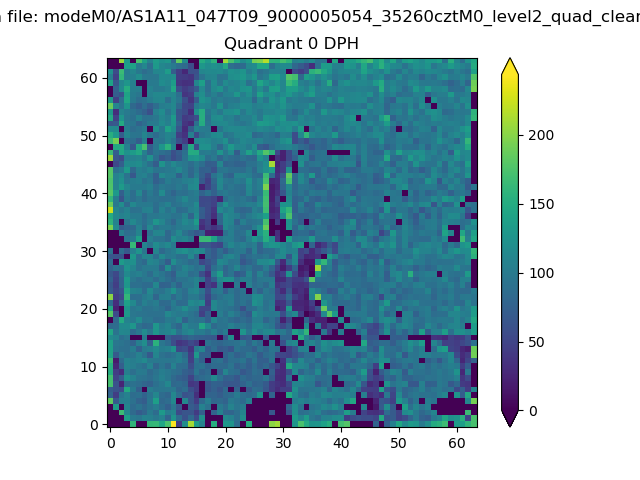 |
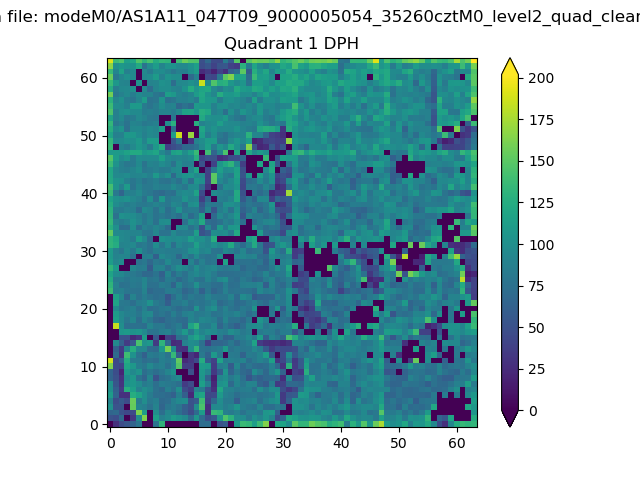 |
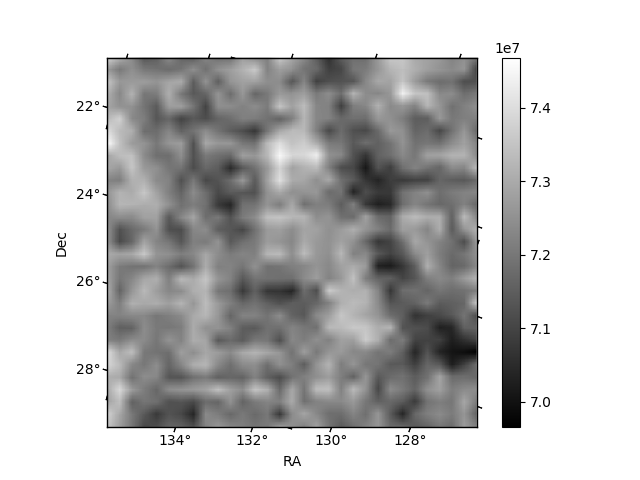
Quadrant B |
|---|---|---|---|
| Quadrant D | 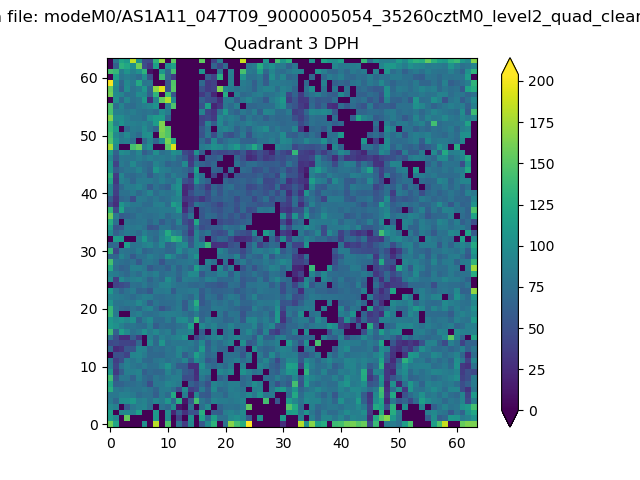 |
 |
Quadrant C |
| Plot type | Count rate plots | Images |
|---|---|---|
| Comparison with Poisson distribution Blue bars denote a histogram of data divided into 1 sec bins. Red curve is a Poisson curve with rate = median count rate of data. |
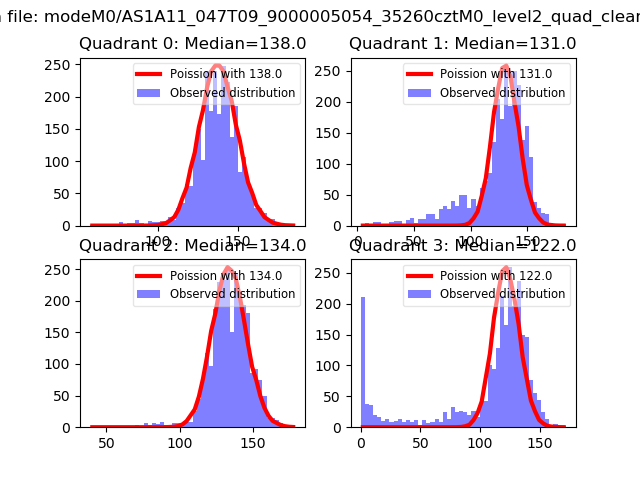 |
 |
| Quadrant-wise count rates Data is divided into 100 sec bins |
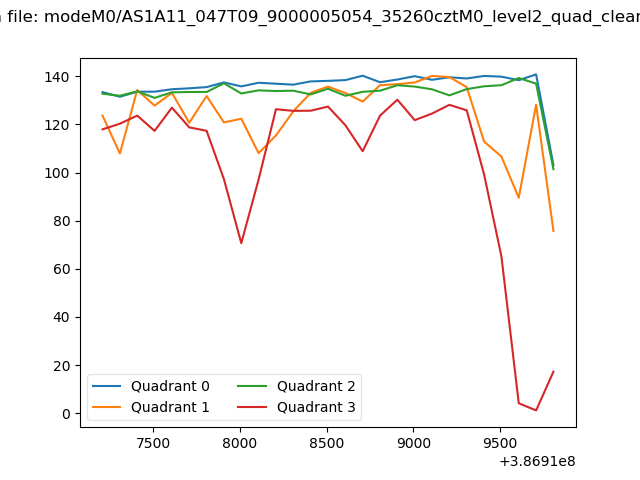 |
|
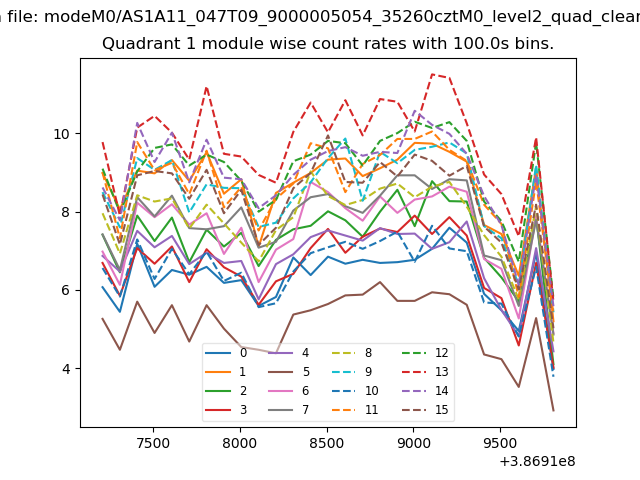
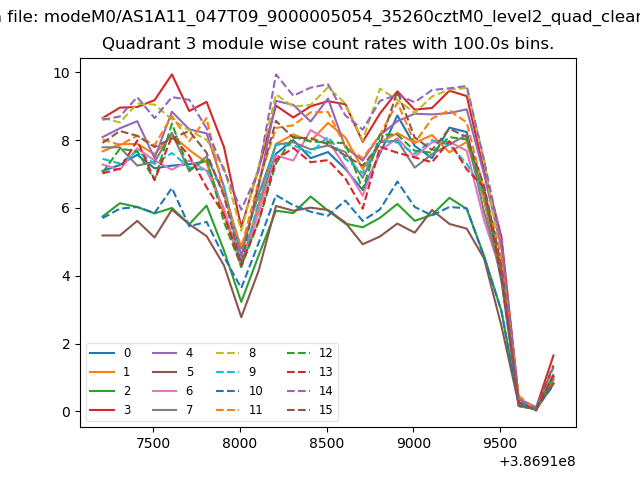
| Module-wise count rates for Quadrant A Data is divided into 100 sec bins |
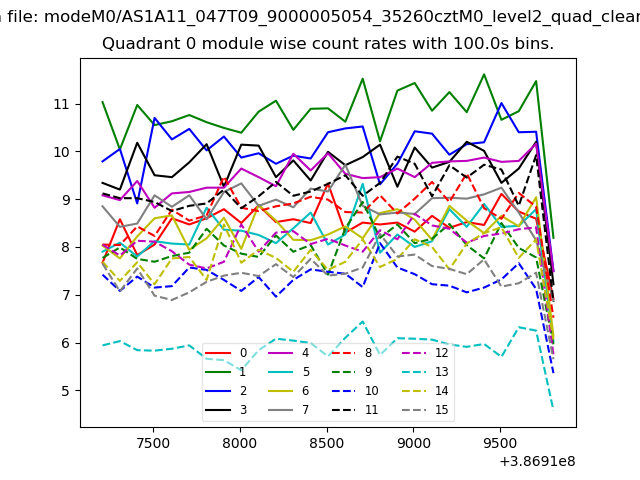 |
 |
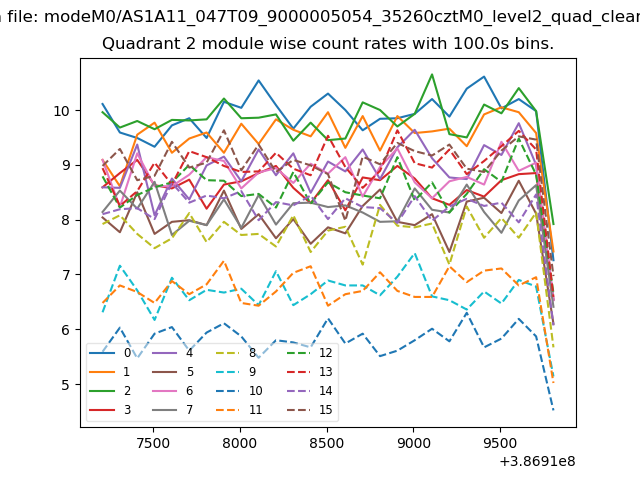
| Module-wise count rates for Quadrant B Data is divided into 100 sec bins |
 |
 |
| Module-wise count rates for Quadrant C Data is divided into 100 sec bins |
 |
 |
| Module-wise count rates for Quadrant D Data is divided into 100 sec bins |
 |
 |
| Parameter | Plot |
|---|---|
| CZT HV Monitor | 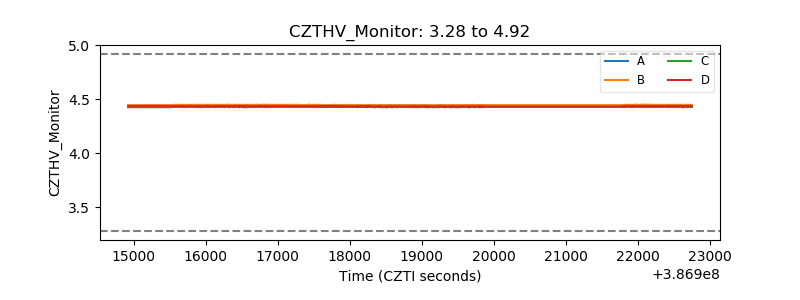 |
| D_VDD | 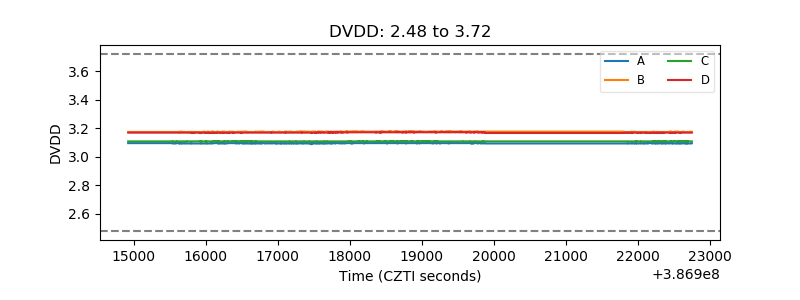 |
| Temperature 1 | 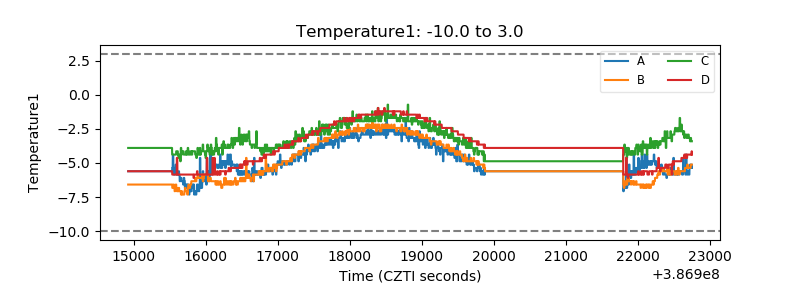 |
| Veto HV Monitor | 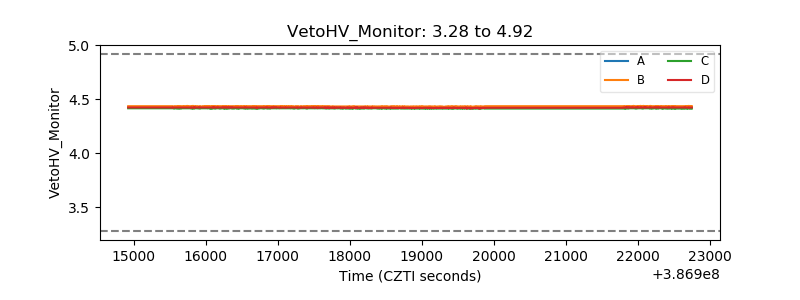 |
| Veto LLD | 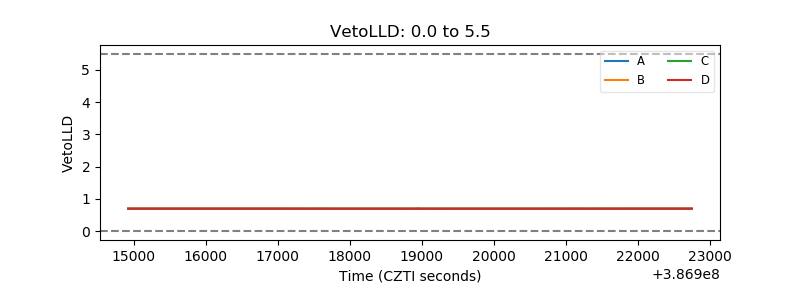 |
| Alpha Counter | 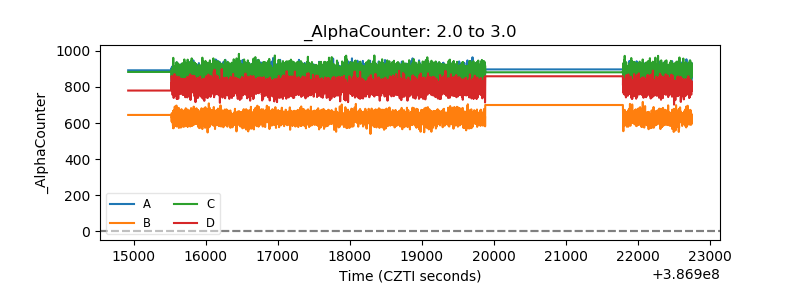 |
| _CPM_Rate | 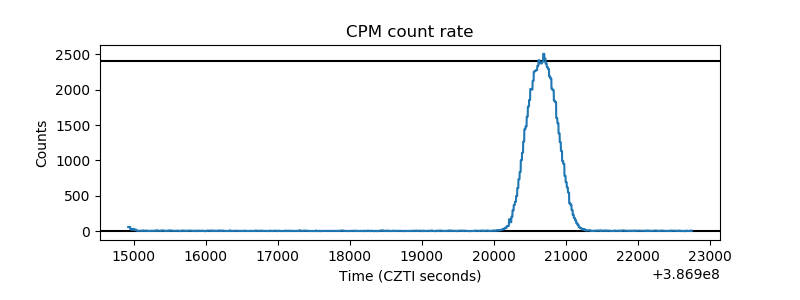 |
| CZT Counter | 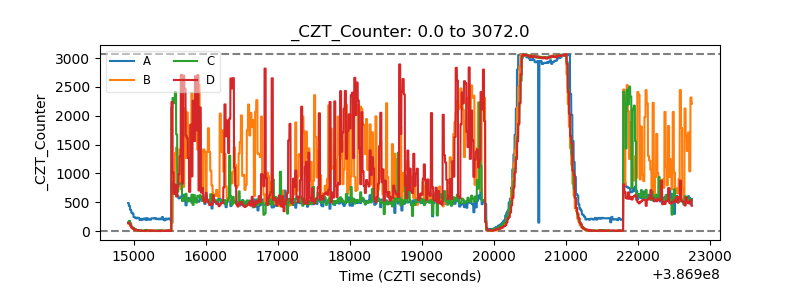 |
| +2.5 Volts monitor | 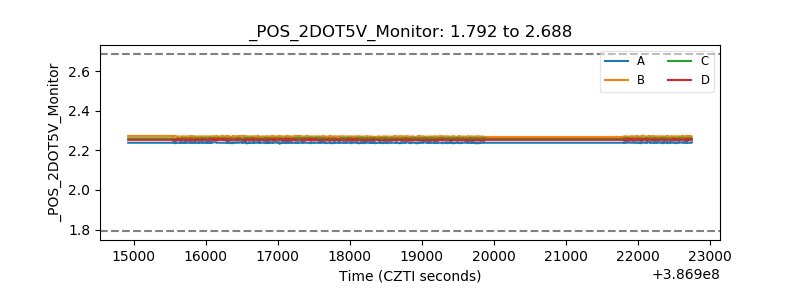 |
| +5 Volts monitor | 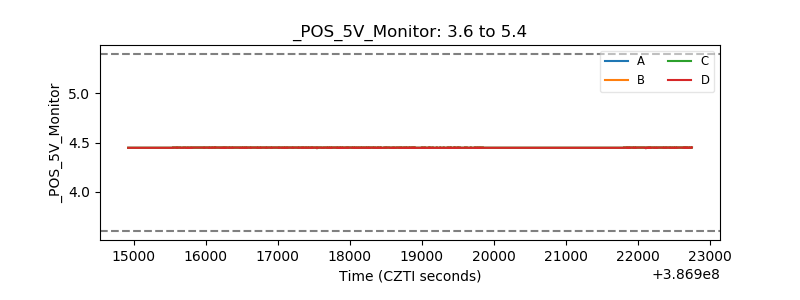 |
| _ROLL_ROT | 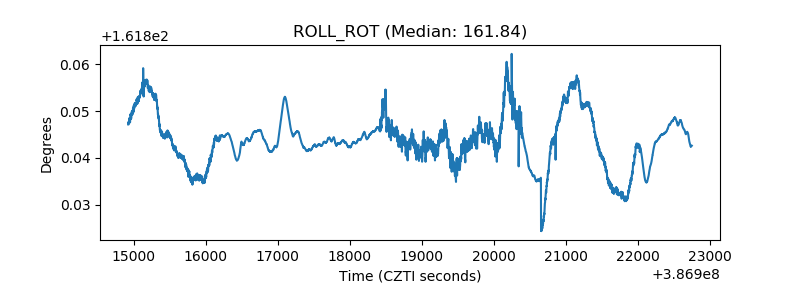 |
| _Roll_DEC | 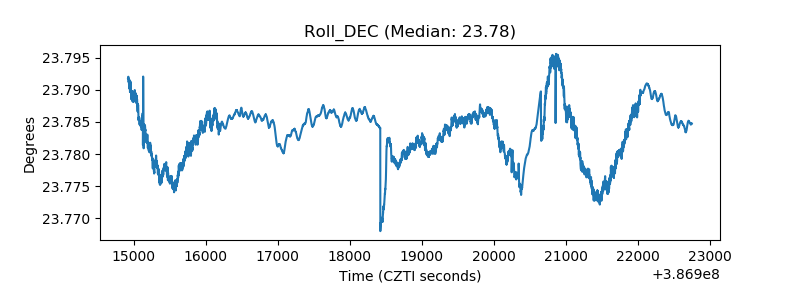 |
| _Roll_RA | 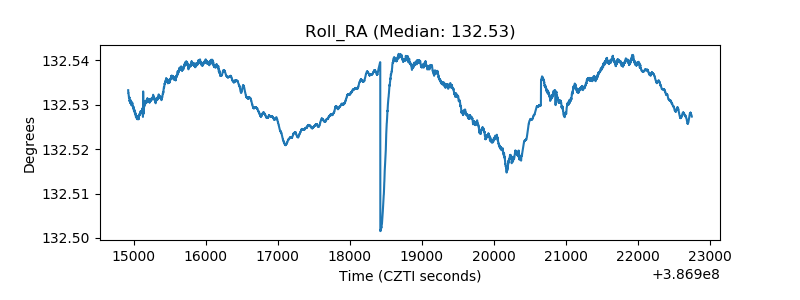 |
| Veto Counter | 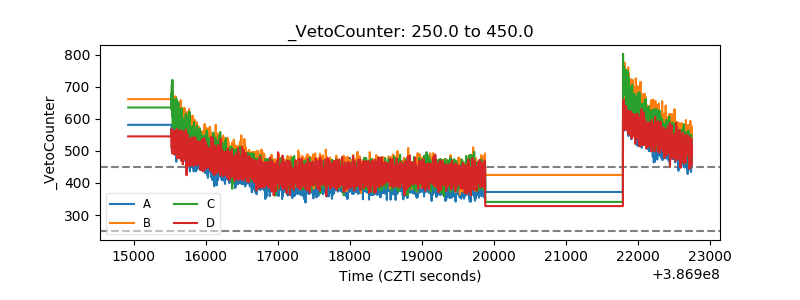 |