| Param | Original file | Final file |
|---|---|---|
| Filename | modeM0/AS1A11_047T09_9000005054_35253cztM0_level2.evt | modeM0/AS1A11_047T09_9000005054_35253cztM0_level2_quad_clean.evt |
| Size (bytes) | 670,573,440 | 70,686,720 |
| Size | 639.5 MB | 67.4 MB |
| Events in quadrant A | 2,840,868 | 476,656 |
| Events in quadrant B | 8,784,458 | 356,172 |
| Events in quadrant C | 3,283,012 | 466,750 |
| Events in quadrant D | 4,991,182 | 417,558 |
| Mode M9 | |||
|---|---|---|---|
| Quadrant | BADHDUFLAG | Total packets | Discarded packets |
| A | 0 | 21 | 0 |
| B | 0 | 21 | 0 |
| C | 0 | 21 | 0 |
| D | 0 | 22 | 0 |
| Mode M0 | |||
|---|---|---|---|
| Quadrant | BADHDUFLAG | Total packets | Discarded packets |
| A | 0 | 12454 | 3 |
| B | 0 | 30258 | 2 |
| C | 0 | 13341 | 2 |
| D | 0 | 18946 | 2 |
| Mode SS | |||
|---|---|---|---|
| Quadrant | BADHDUFLAG | Total packets | Discarded packets |
| A | 0 | 124 | 0 |
| B | 0 | 124 | 0 |
| C | 0 | 124 | 0 |
| D | 0 | 124 | 0 |
| Quadrant | Total seconds | Saturated seconds | Saturation percentage |
|---|---|---|---|
| A | 6040 | 10 | 0.165563% |
| B | 6040 | 2238 | 37.052980% |
| C | 6040 | 109 | 1.804636% |
| D | 6040 | 512 | 8.476821% |
Noise dominated data is calculated using 1-second bins in cleaned event files. If a bin has >2000 counts, and if more than 50% of those come from <1% of pixels, then it is considered to be noise-dominated and hence unusable.
| Quadrant | # 1 sec bins | Bins with >0 counts | Bins with >2000 counts | High rate bins dominated by noise | Noise dominated (total time) | Noise dominated (detector-on time) | Marked lightcurve |
|---|---|---|---|---|---|---|---|
| A | 7323 | 6041 | 1 | 1 | 0.01% | 0.02% | 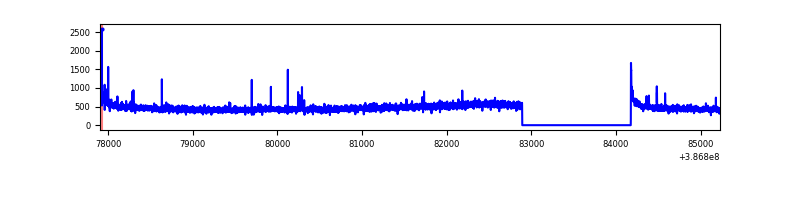 |
| B | 7323 | 6041 | 1693 | 1693 | 23.12% | 28.03% | 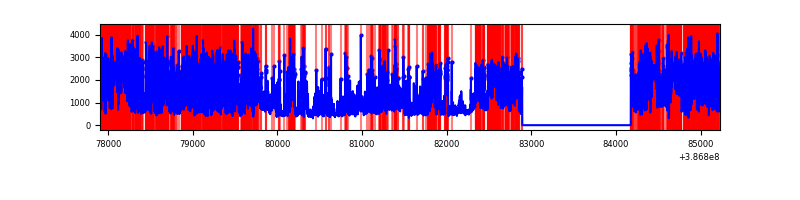 |
| C | 7323 | 6041 | 85 | 85 | 1.16% | 1.41% | 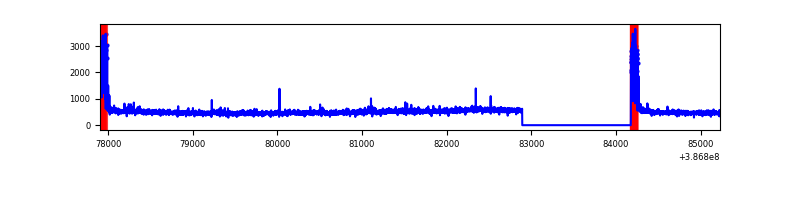 |
| D | 7323 | 6041 | 457 | 457 | 6.24% | 7.56% | 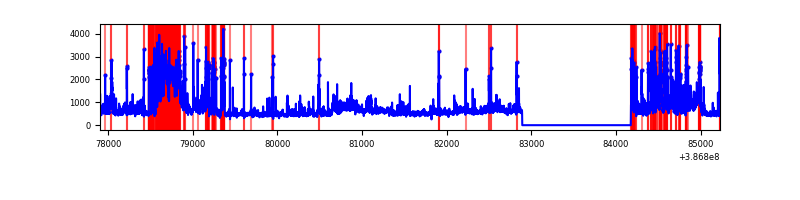 |
Top three noisy pixels from each quadrant. If the there are fewer than three noisy pixels in the level2.evt file, extra rows are filled as -1
| Pixel properties | Quadrant properties | ||||||
|---|---|---|---|---|---|---|---|
| Quadrant | DetID | PixID | Counts | Sigma | Mean | Median | Sigma |
| A | 10 | 83 | 104321 | 730.49 | 696 | 683 | 141.9 |
| A | 9 | 143 | 17862 | 121.09 | 696 | 683 | 141.9 |
| A | 13 | 6 | 16743 | 113.2 | 696 | 683 | 141.9 |
| B | 5 | 236 | 5514903 | 48715.82 | 588 | 573 | 113.2 |
| B | 5 | 172 | 649448 | 5732.42 | 588 | 573 | 113.2 |
| B | 4 | 232 | 179378 | 1579.64 | 588 | 573 | 113.2 |
| C | 0 | 10 | 344445 | 2181.96 | 676 | 681 | 157.5 |
| C | 15 | 214 | 252075 | 1595.66 | 676 | 681 | 157.5 |
| C | 14 | 67 | 33528 | 208.49 | 676 | 681 | 157.5 |
| D | 10 | 118 | 997736 | 6203.74 | 656 | 637 | 160.7 |
| D | 8 | 195 | 626553 | 3894.32 | 656 | 637 | 160.7 |
| D | 7 | 80 | 359441 | 2232.4 | 656 | 637 | 160.7 |
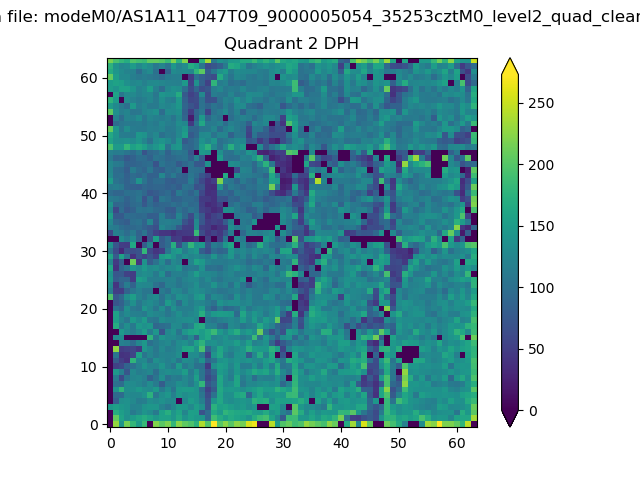
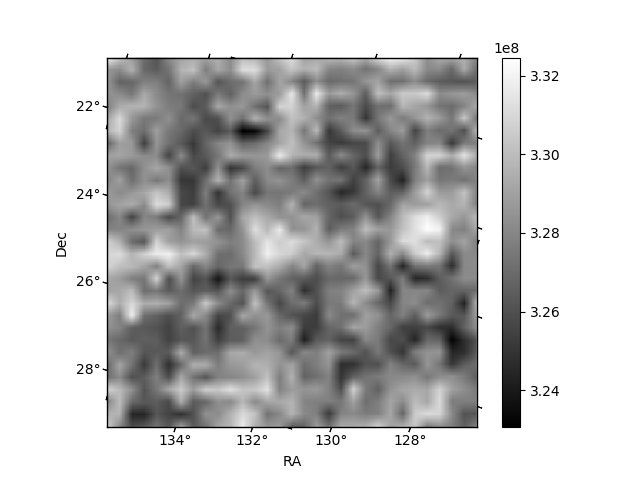
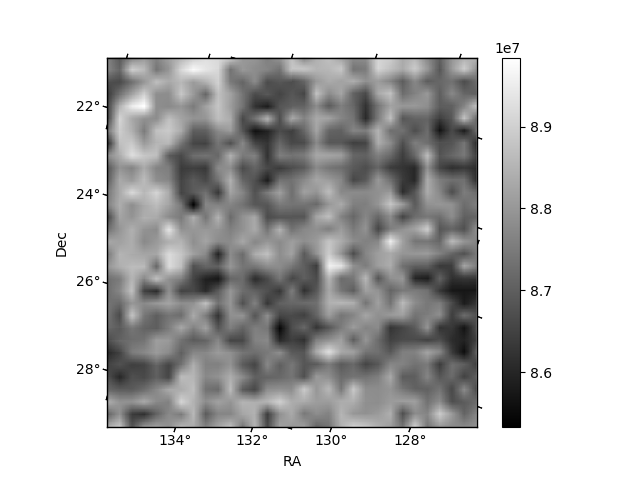
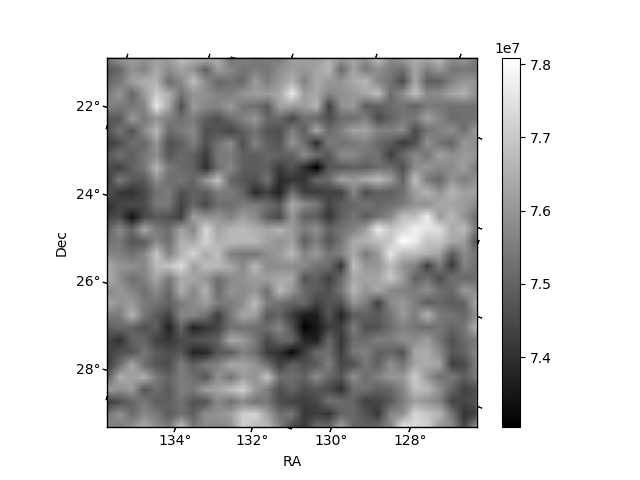
Histogram calculated using DETX and DETY for each event in the final _common_clean file
| Quadrant A | 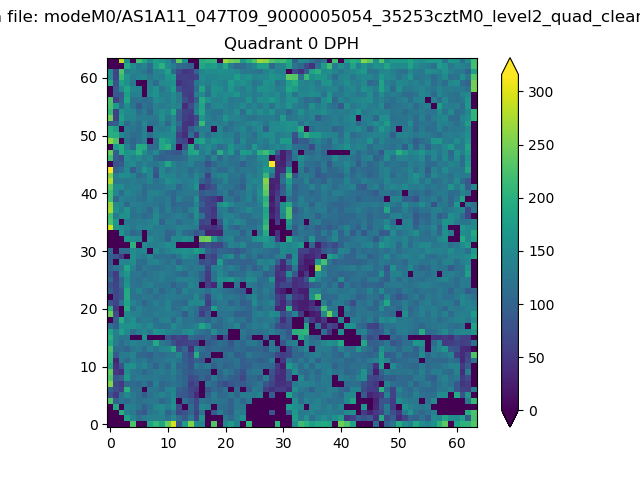 |
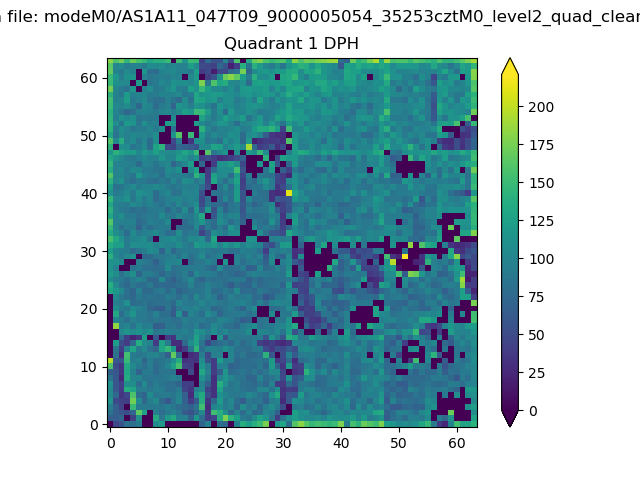 |
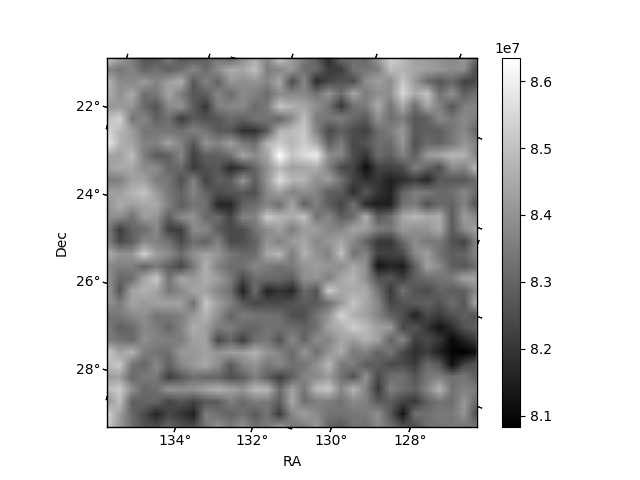
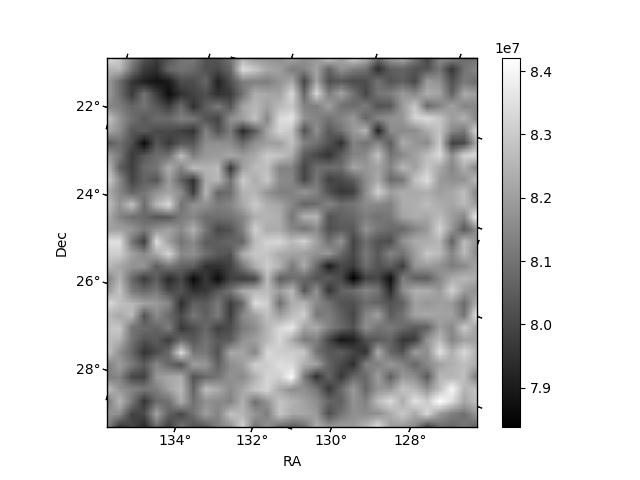
Quadrant B |
|---|---|---|---|
| Quadrant D | 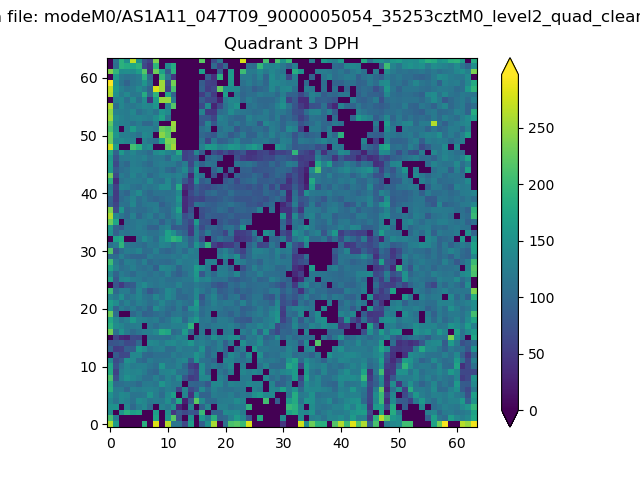 |
 |
Quadrant C |
| Plot type | Count rate plots | Images |
|---|---|---|
| Comparison with Poisson distribution Blue bars denote a histogram of data divided into 1 sec bins. Red curve is a Poisson curve with rate = median count rate of data. |
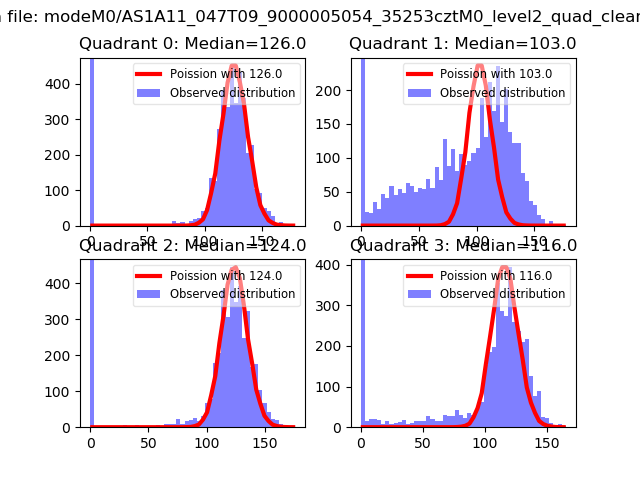 |
 |
| Quadrant-wise count rates Data is divided into 100 sec bins |
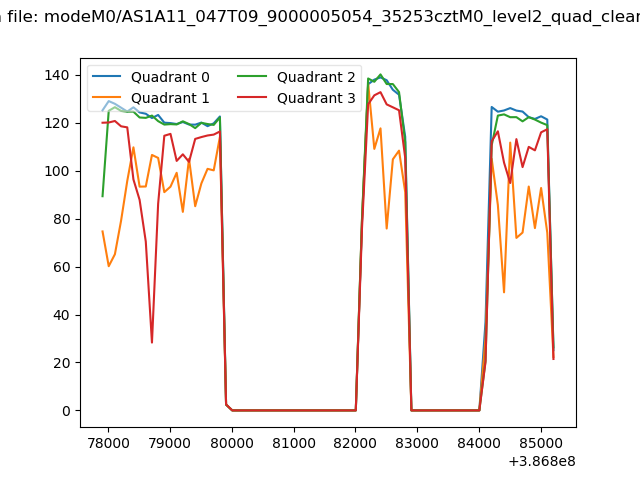 |
|
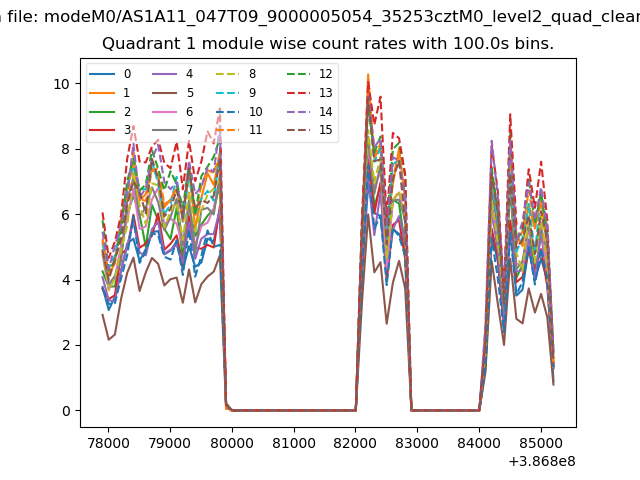
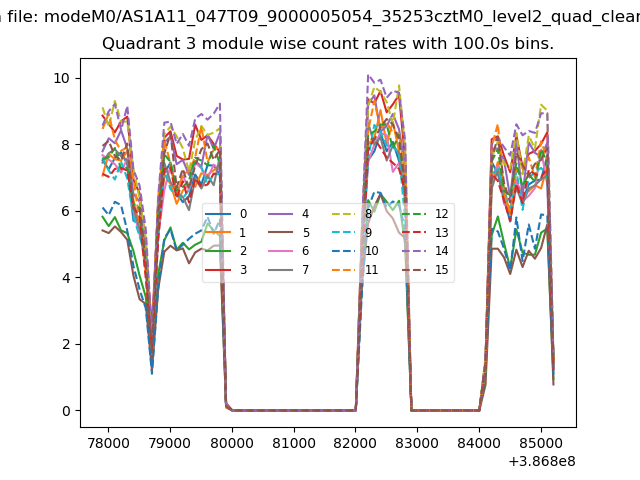
| Module-wise count rates for Quadrant A Data is divided into 100 sec bins |
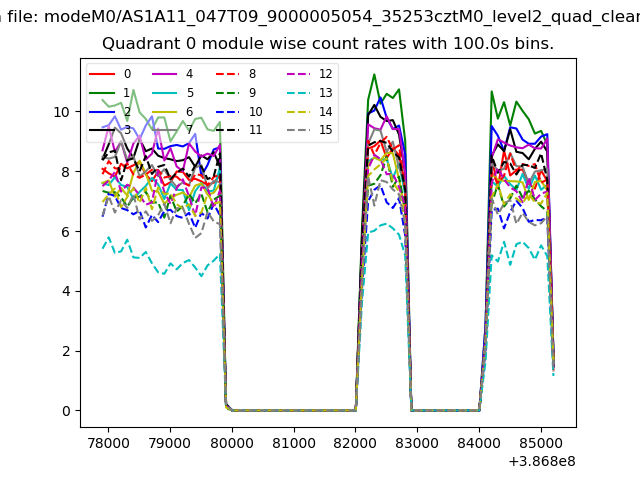 |
 |
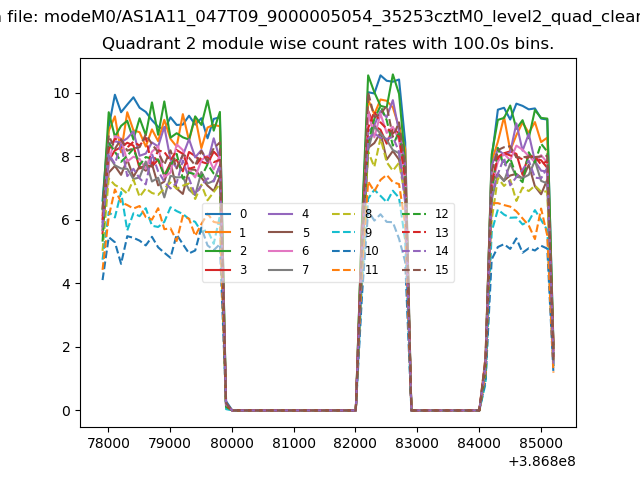
| Module-wise count rates for Quadrant B Data is divided into 100 sec bins |
 |
 |
| Module-wise count rates for Quadrant C Data is divided into 100 sec bins |
 |
 |
| Module-wise count rates for Quadrant D Data is divided into 100 sec bins |
 |
 |
| Parameter | Plot |
|---|---|
| CZT HV Monitor | 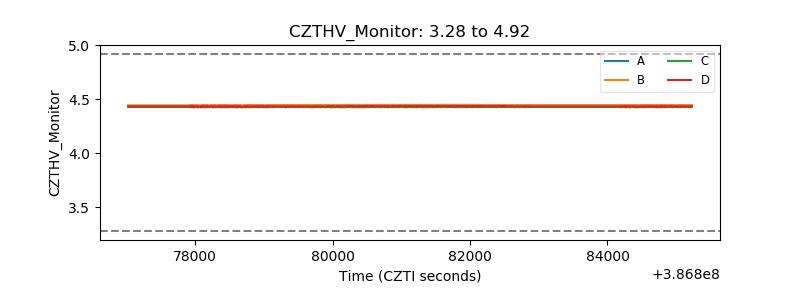 |
| D_VDD | 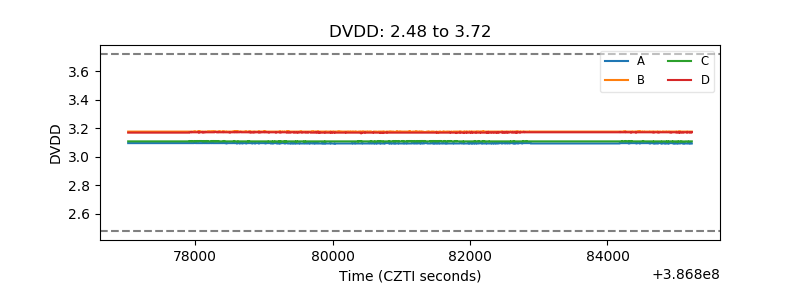 |
| Temperature 1 | 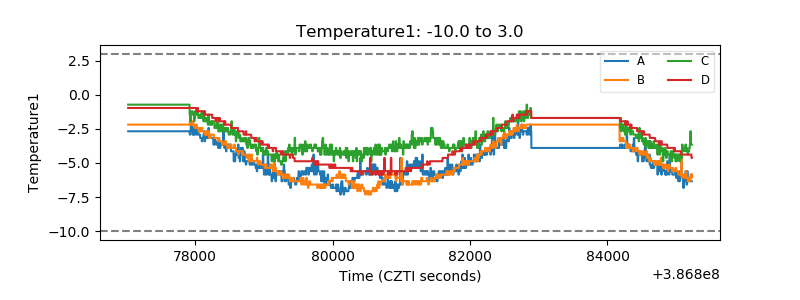 |
| Veto HV Monitor | 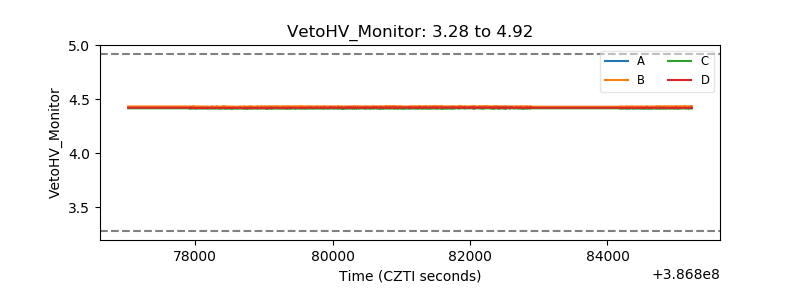 |
| Veto LLD | 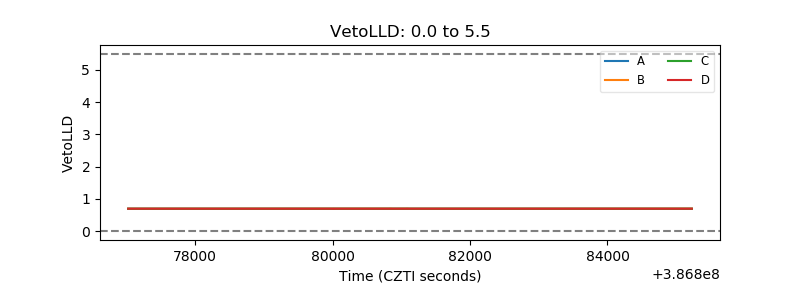 |
| Alpha Counter | 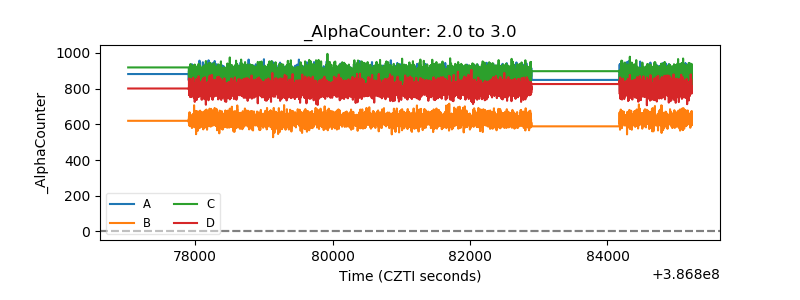 |
| _CPM_Rate | 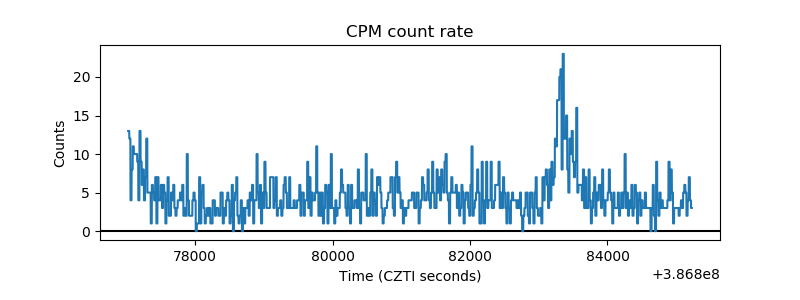 |
| CZT Counter | 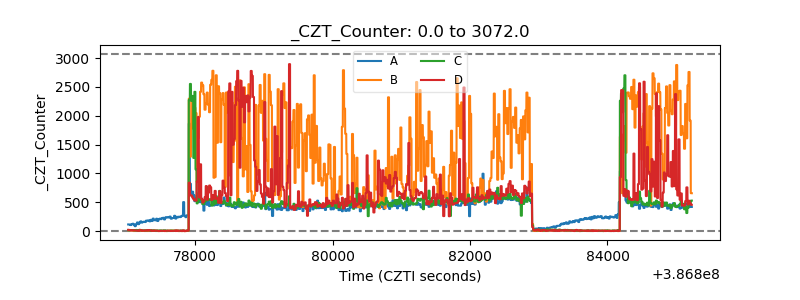 |
| +2.5 Volts monitor | 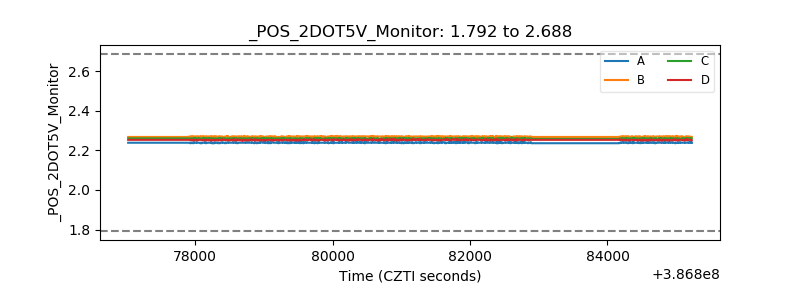 |
| +5 Volts monitor | 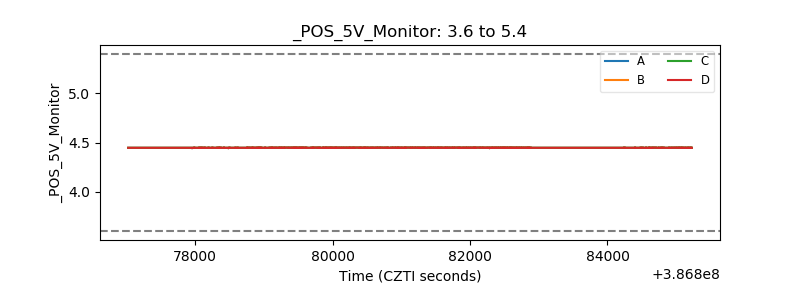 |
| _ROLL_ROT | 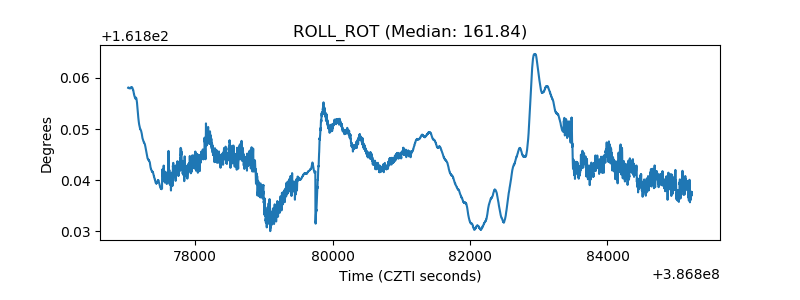 |
| _Roll_DEC | 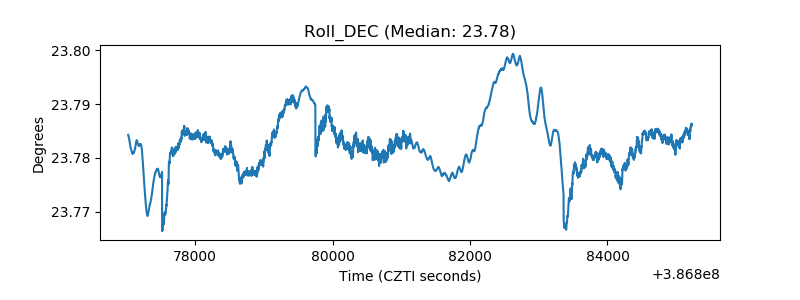 |
| _Roll_RA | 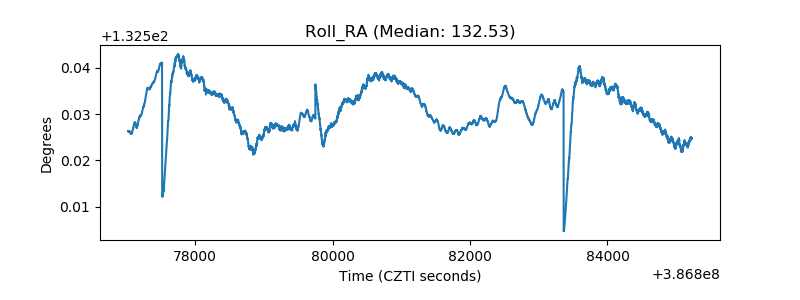 |
| Veto Counter | 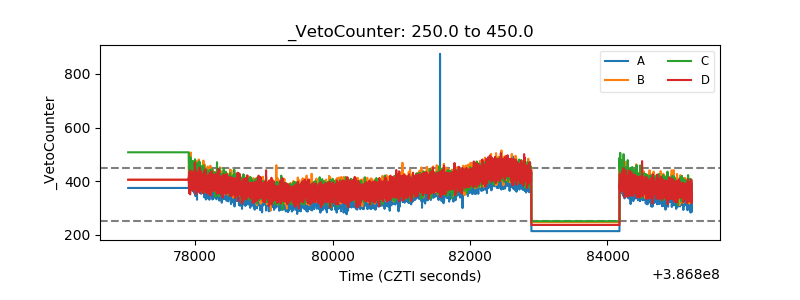 |