| Param | Original file | Final file |
|---|---|---|
| Filename | modeM0/AS1A11_047T09_9000005054_35249cztM0_level2.evt | modeM0/AS1A11_047T09_9000005054_35249cztM0_level2_quad_clean.evt |
| Size (bytes) | 697,299,840 | 87,333,120 |
| Size | 665.0 MB | 83.3 MB |
| Events in quadrant A | 3,066,121 | 627,465 |
| Events in quadrant B | 7,101,914 | 534,333 |
| Events in quadrant C | 2,975,140 | 616,482 |
| Events in quadrant D | 7,638,461 | 515,778 |
| Mode M9 | |||
|---|---|---|---|
| Quadrant | BADHDUFLAG | Total packets | Discarded packets |
| A | 0 | 26 | 0 |
| B | 0 | 26 | 0 |
| C | 0 | 26 | 0 |
| D | 0 | 27 | 0 |
| Mode M0 | |||
|---|---|---|---|
| Quadrant | BADHDUFLAG | Total packets | Discarded packets |
| A | 0 | 12133 | 3 |
| B | 0 | 24568 | 2 |
| C | 0 | 11727 | 2 |
| D | 0 | 26205 | 2 |
| Mode SS | |||
|---|---|---|---|
| Quadrant | BADHDUFLAG | Total packets | Discarded packets |
| A | 0 | 100 | 0 |
| B | 0 | 100 | 0 |
| C | 0 | 100 | 0 |
| D | 0 | 100 | 0 |
| Quadrant | Total seconds | Saturated seconds | Saturation percentage |
|---|---|---|---|
| A | 4991 | 107 | 2.143859% |
| B | 4991 | 1622 | 32.498497% |
| C | 4991 | 126 | 2.524544% |
| D | 4991 | 1434 | 28.731717% |
Noise dominated data is calculated using 1-second bins in cleaned event files. If a bin has >2000 counts, and if more than 50% of those come from <1% of pixels, then it is considered to be noise-dominated and hence unusable.
| Quadrant | # 1 sec bins | Bins with >0 counts | Bins with >2000 counts | High rate bins dominated by noise | Noise dominated (total time) | Noise dominated (detector-on time) | Marked lightcurve |
|---|---|---|---|---|---|---|---|
| A | 7084 | 4992 | 97 | 97 | 1.37% | 1.94% | 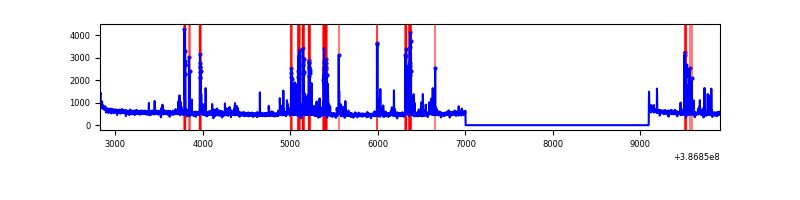 |
| B | 7084 | 4992 | 1247 | 1247 | 17.60% | 24.98% | 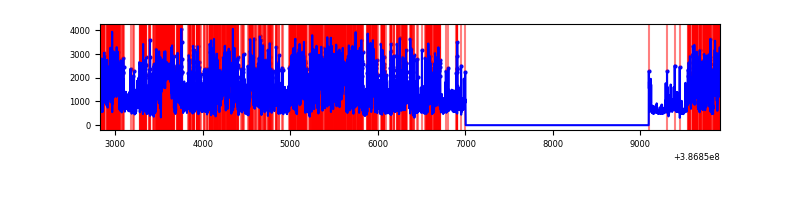 |
| C | 7084 | 4992 | 91 | 91 | 1.28% | 1.82% | 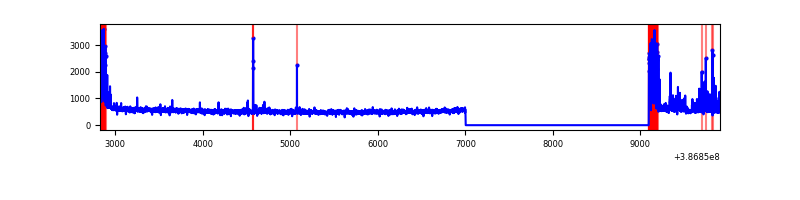 |
| D | 7084 | 4992 | 1393 | 1393 | 19.66% | 27.90% | 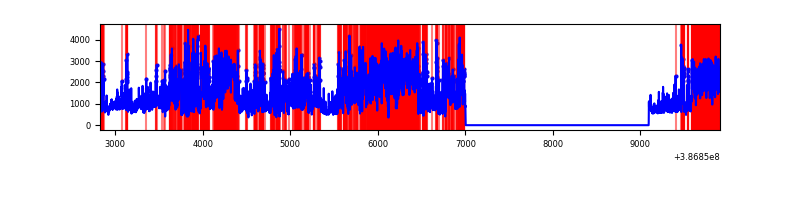 |
Top three noisy pixels from each quadrant. If the there are fewer than three noisy pixels in the level2.evt file, extra rows are filled as -1
| Pixel properties | Quadrant properties | ||||||
|---|---|---|---|---|---|---|---|
| Quadrant | DetID | PixID | Counts | Sigma | Mean | Median | Sigma |
| A | 7 | 3 | 441722 | 3531.19 | 628 | 619 | 124.9 |
| A | 10 | 83 | 95473 | 759.34 | 628 | 619 | 124.9 |
| A | 9 | 143 | 73764 | 585.55 | 628 | 619 | 124.9 |
| B | 5 | 236 | 4145784 | 39846.17 | 543 | 532 | 104.0 |
| B | 5 | 172 | 711104 | 6830.36 | 543 | 532 | 104.0 |
| B | 0 | 190 | 79072 | 754.96 | 543 | 532 | 104.0 |
| C | 0 | 10 | 400630 | 2887.48 | 600 | 605 | 138.5 |
| C | 15 | 214 | 212143 | 1526.93 | 600 | 605 | 138.5 |
| C | 15 | 159 | 15822 | 109.84 | 600 | 605 | 138.5 |
| D | 8 | 195 | 2604786 | 18211.81 | 553 | 543 | 143.0 |
| D | 7 | 80 | 1940263 | 13564.71 | 553 | 543 | 143.0 |
| D | 8 | 230 | 218208 | 1522.16 | 553 | 543 | 143.0 |
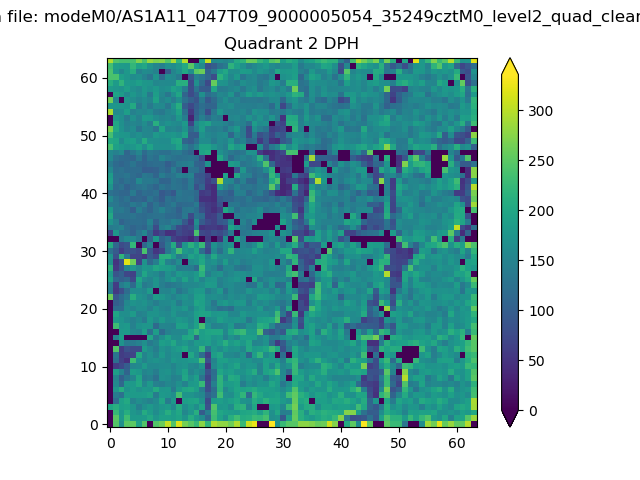
Histogram calculated using DETX and DETY for each event in the final _common_clean file
| Quadrant A | 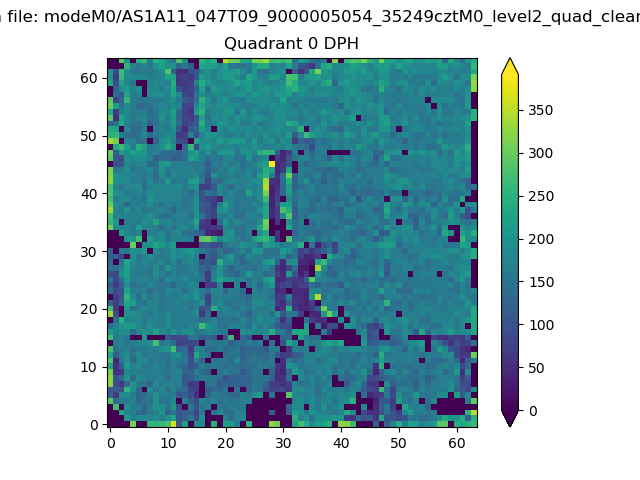 |
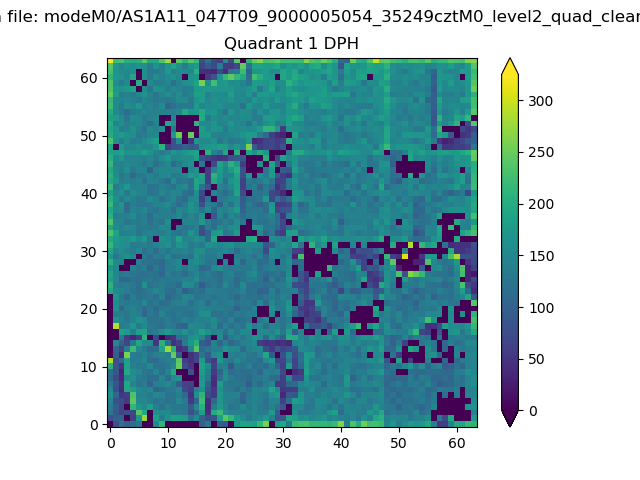 |
Quadrant B |
|---|---|---|---|
| Quadrant D | 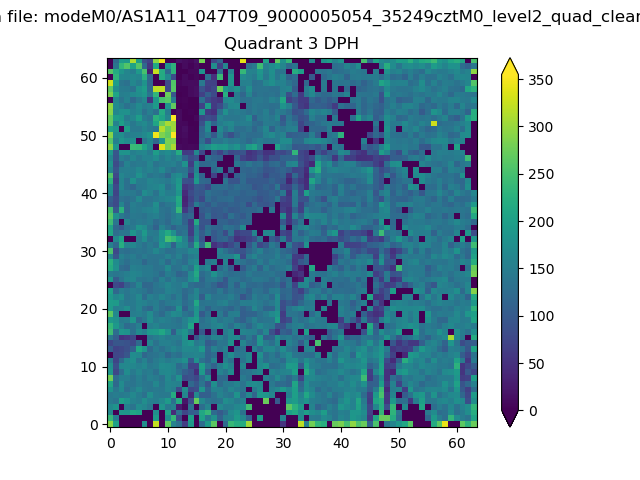 |
 |
Quadrant C |
| Plot type | Count rate plots | Images |
|---|---|---|
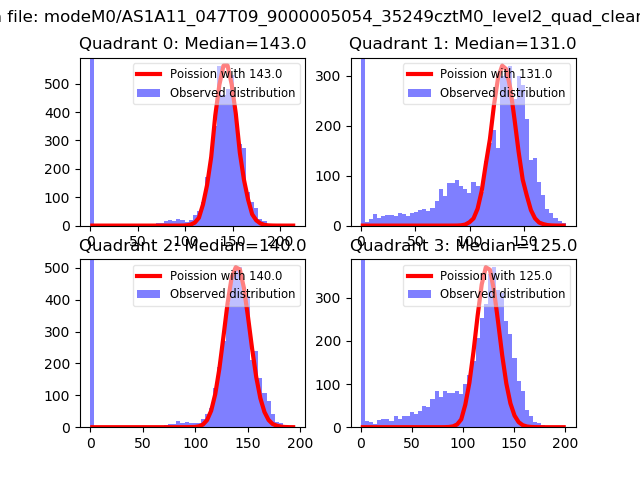
| Comparison with Poisson distribution Blue bars denote a histogram of data divided into 1 sec bins. Red curve is a Poisson curve with rate = median count rate of data. |
 |
 |
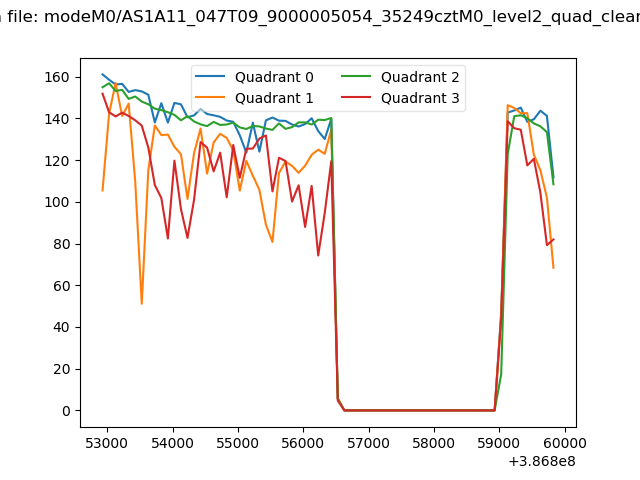
| Quadrant-wise count rates Data is divided into 100 sec bins |
 |
|
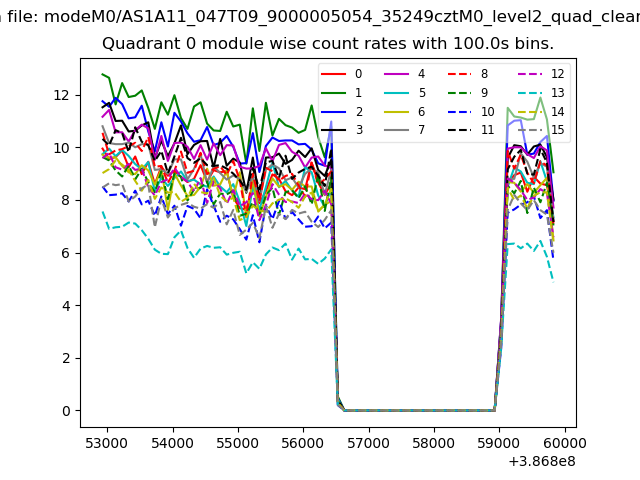
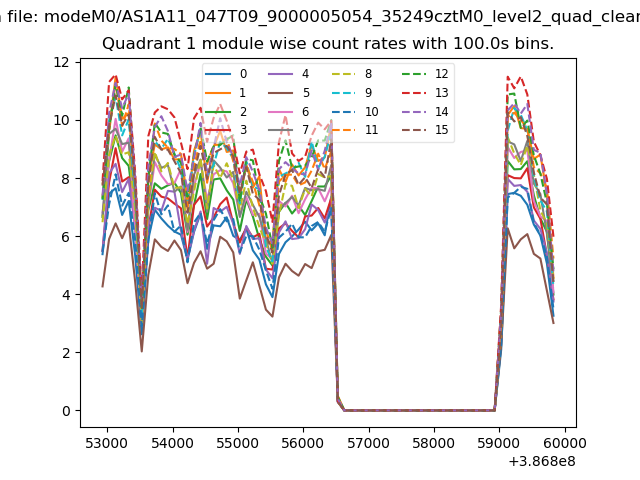
| Module-wise count rates for Quadrant A Data is divided into 100 sec bins |
 |
 |
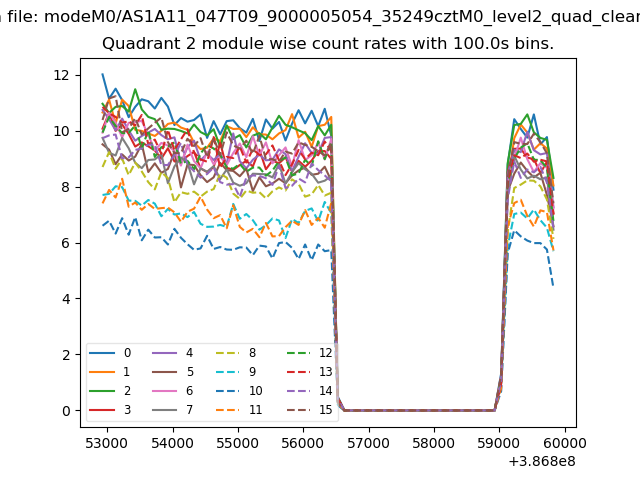
| Module-wise count rates for Quadrant B Data is divided into 100 sec bins |
 |
 |
| Module-wise count rates for Quadrant C Data is divided into 100 sec bins |
 |
 |
| Module-wise count rates for Quadrant D Data is divided into 100 sec bins |
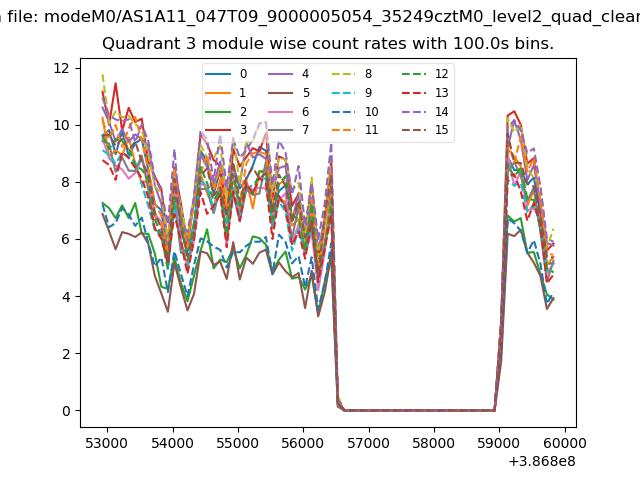 |
 |
| Parameter | Plot |
|---|---|
| CZT HV Monitor | 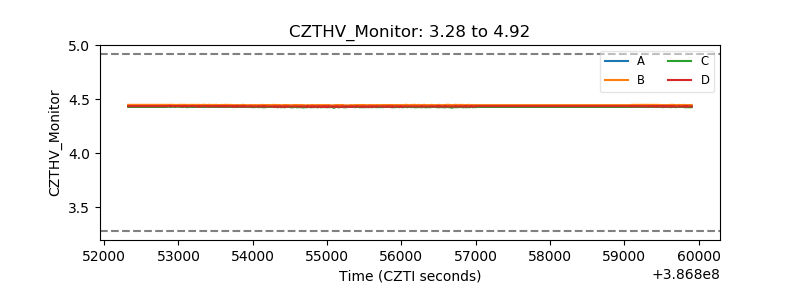 |
| D_VDD | 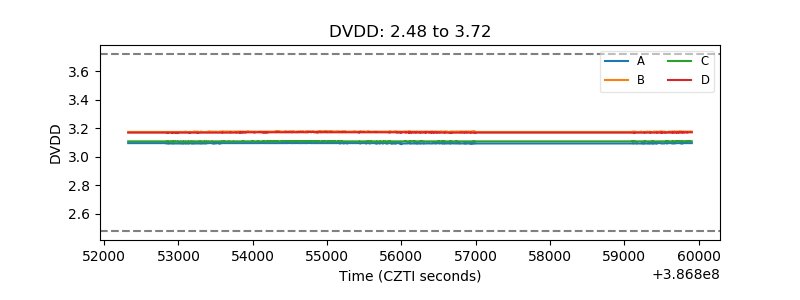 |
| Temperature 1 | 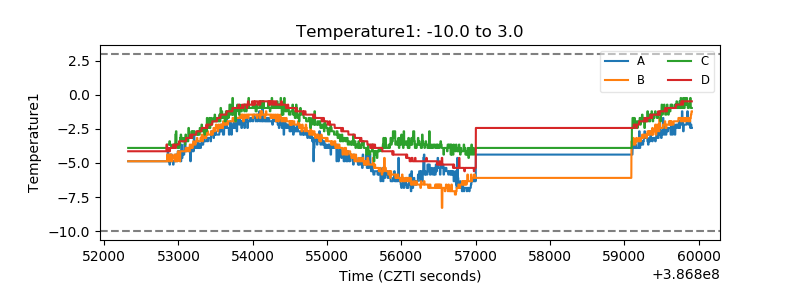 |
| Veto HV Monitor | 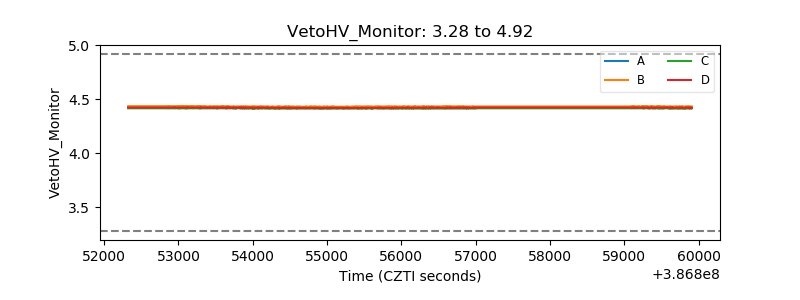 |
| Veto LLD | 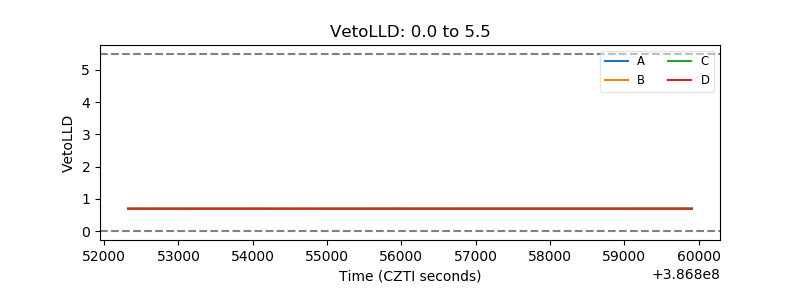 |
| Alpha Counter |  |
| _CPM_Rate | 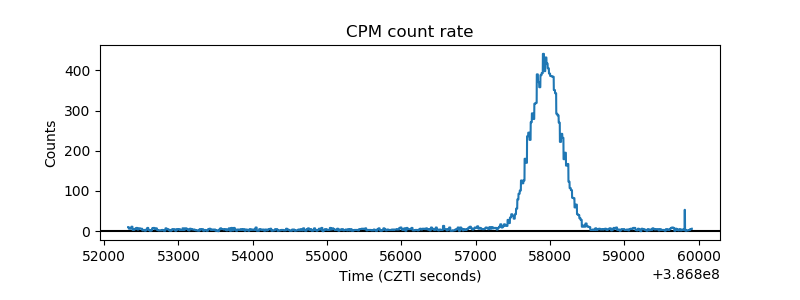 |
| CZT Counter | 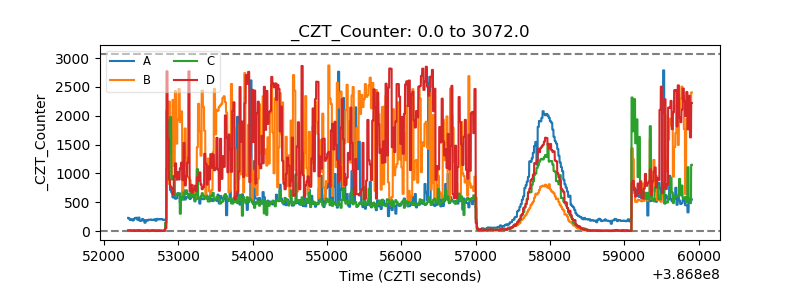 |
| +2.5 Volts monitor | 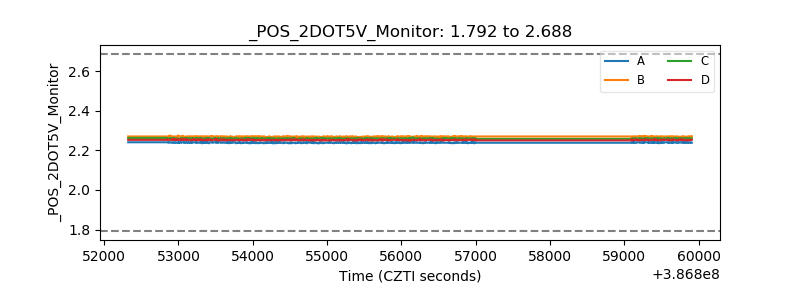 |
| +5 Volts monitor | 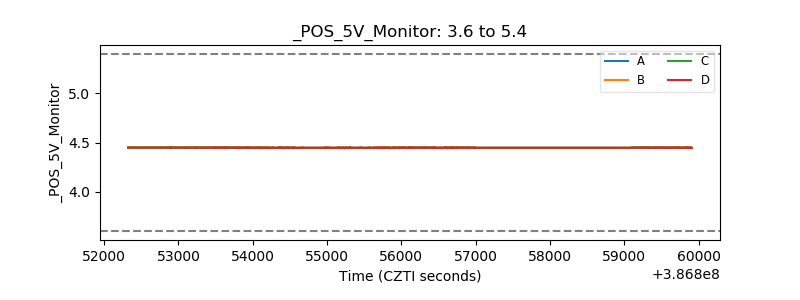 |
| _ROLL_ROT | 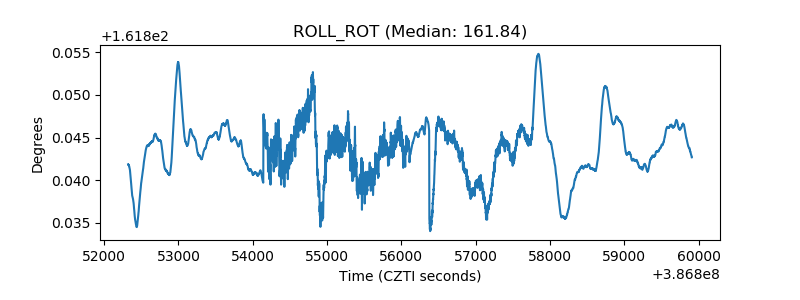 |
| _Roll_DEC | 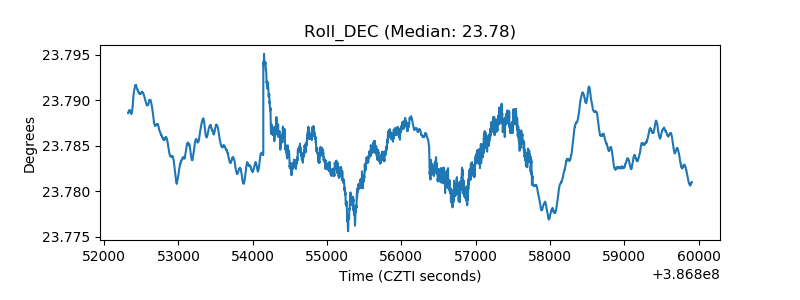 |
| _Roll_RA | 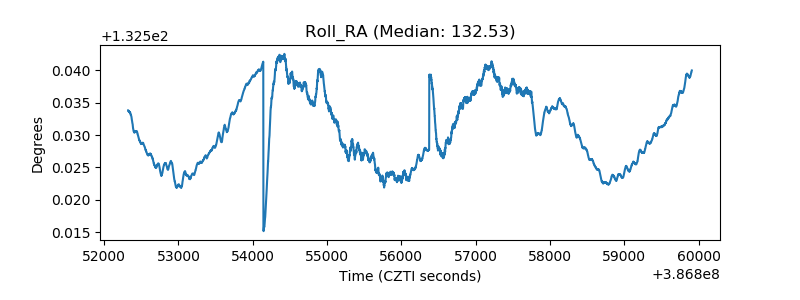 |
| Veto Counter | 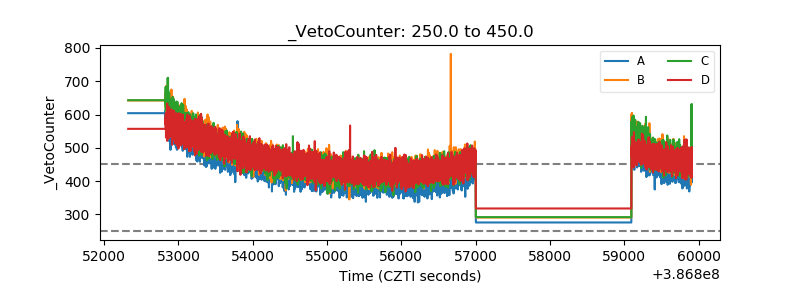 |