| Param | Original file | Final file |
|---|---|---|
| Filename | modeM0/AS1C07_004T01_9000005052_35248cztM0_level2.evt | modeM0/AS1C07_004T01_9000005052_35248cztM0_level2_quad_clean.evt |
| Size (bytes) | 356,506,560 | 49,777,920 |
| Size | 340.0 MB | 47.5 MB |
| Events in quadrant A | 1,513,077 | 356,831 |
| Events in quadrant B | 3,618,218 | 312,405 |
| Events in quadrant C | 1,549,647 | 360,834 |
| Events in quadrant D | 3,945,651 | 297,158 |
| Mode M0 | |||
|---|---|---|---|
| Quadrant | BADHDUFLAG | Total packets | Discarded packets |
| A | 0 | 6065 | 1 |
| B | 0 | 12480 | 1 |
| C | 0 | 6166 | 1 |
| D | 0 | 13492 | 1 |
| Mode SS | |||
|---|---|---|---|
| Quadrant | BADHDUFLAG | Total packets | Discarded packets |
| A | 0 | 50 | 0 |
| B | 0 | 50 | 0 |
| C | 0 | 50 | 0 |
| D | 0 | 50 | 0 |
| Mode M9 | |||
|---|---|---|---|
| Quadrant | BADHDUFLAG | Total packets | Discarded packets |
| A | 0 | 13 | 0 |
| B | 0 | 13 | 0 |
| C | 0 | 13 | 0 |
| D | 0 | 14 | 0 |
| Quadrant | Total seconds | Saturated seconds | Saturation percentage |
|---|---|---|---|
| A | 2498 | 31 | 1.240993% |
| B | 2498 | 887 | 35.508407% |
| C | 2498 | 74 | 2.962370% |
| D | 2498 | 760 | 30.424339% |
Noise dominated data is calculated using 1-second bins in cleaned event files. If a bin has >2000 counts, and if more than 50% of those come from <1% of pixels, then it is considered to be noise-dominated and hence unusable.
| Quadrant | # 1 sec bins | Bins with >0 counts | Bins with >2000 counts | High rate bins dominated by noise | Noise dominated (total time) | Noise dominated (detector-on time) | Marked lightcurve |
|---|---|---|---|---|---|---|---|
| A | 2498 | 2498 | 22 | 22 | 0.88% | 0.88% | 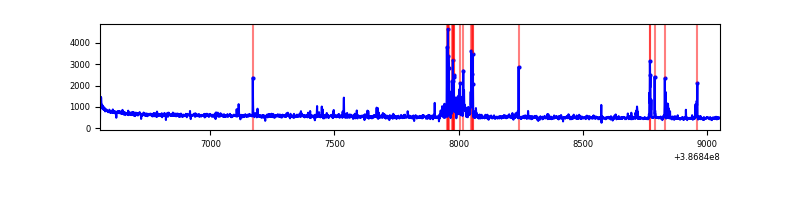 |
| B | 2497 | 2497 | 680 | 680 | 27.23% | 27.23% | 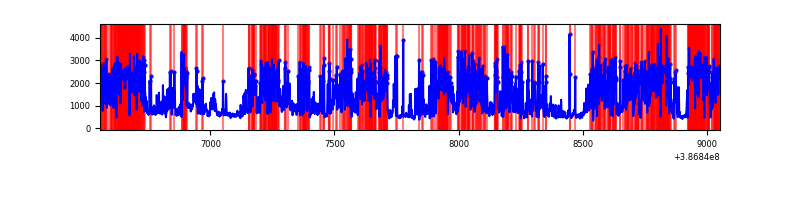 |
| C | 2498 | 2498 | 44 | 44 | 1.76% | 1.76% | 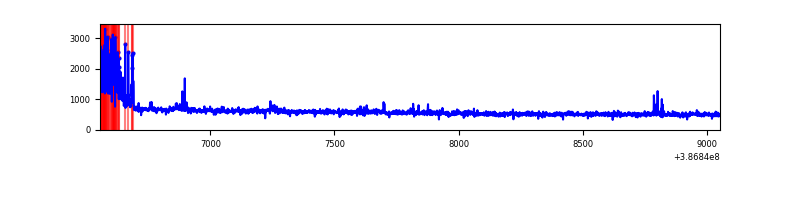 |
| D | 2498 | 2498 | 651 | 651 | 26.06% | 26.06% | 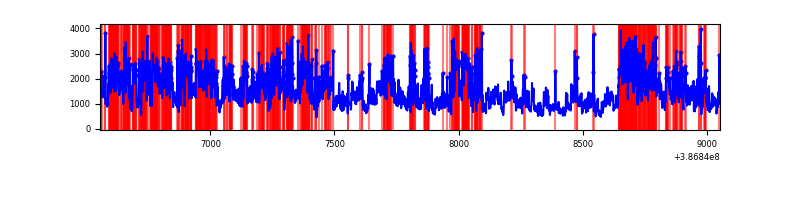 |
Top three noisy pixels from each quadrant. If the there are fewer than three noisy pixels in the level2.evt file, extra rows are filled as -1
| Pixel properties | Quadrant properties | ||||||
|---|---|---|---|---|---|---|---|
| Quadrant | DetID | PixID | Counts | Sigma | Mean | Median | Sigma |
| A | 7 | 3 | 123325 | 1805.93 | 338 | 334 | 68.1 |
| A | 10 | 83 | 47937 | 698.98 | 338 | 334 | 68.1 |
| A | 9 | 143 | 23124 | 334.64 | 338 | 334 | 68.1 |
| B | 5 | 236 | 2130512 | 38941.82 | 285 | 280 | 54.7 |
| B | 5 | 255 | 154967 | 2827.76 | 285 | 280 | 54.7 |
| B | 5 | 172 | 143662 | 2621.1 | 285 | 280 | 54.7 |
| C | 0 | 10 | 193803 | 2630.4 | 319 | 322 | 73.6 |
| C | 15 | 214 | 106012 | 1436.87 | 319 | 322 | 73.6 |
| C | 15 | 159 | 3624 | 44.89 | 319 | 322 | 73.6 |
| D | 7 | 80 | 1171662 | 15823.61 | 296 | 288 | 74.0 |
| D | 8 | 195 | 1044920 | 14111.51 | 296 | 288 | 74.0 |
| D | 1 | 47 | 142031 | 1914.75 | 296 | 288 | 74.0 |
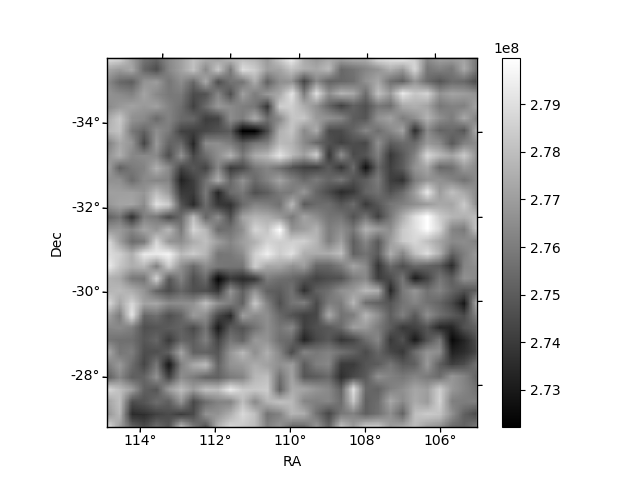
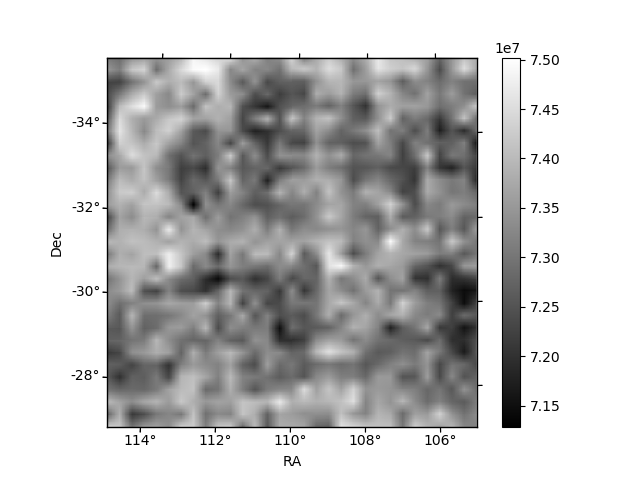
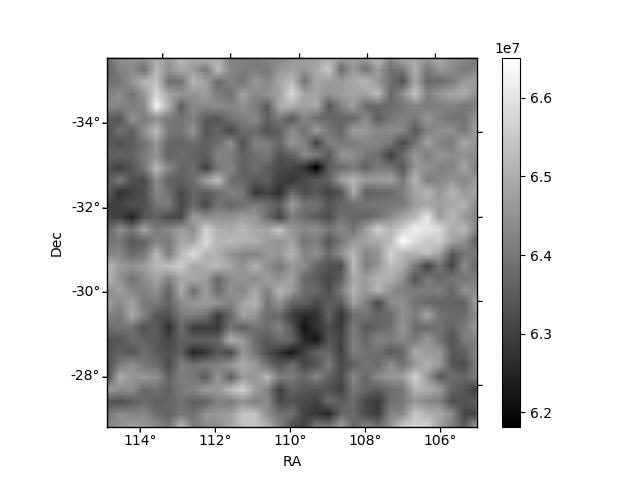
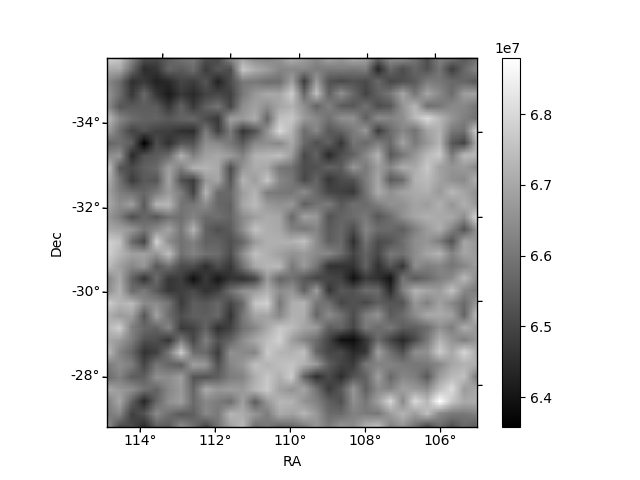
Histogram calculated using DETX and DETY for each event in the final _common_clean file
| Quadrant A | 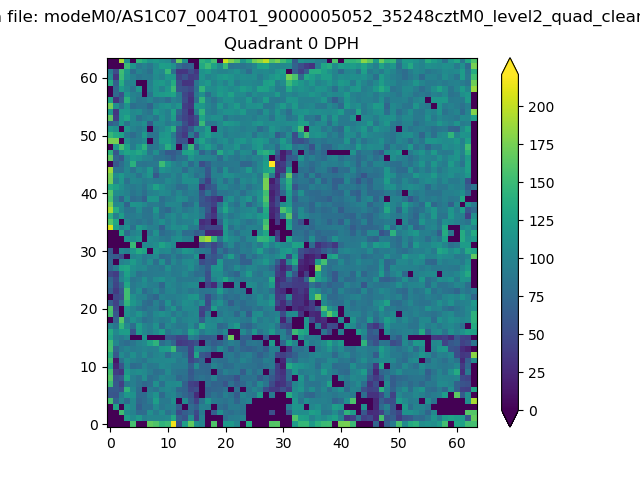 |
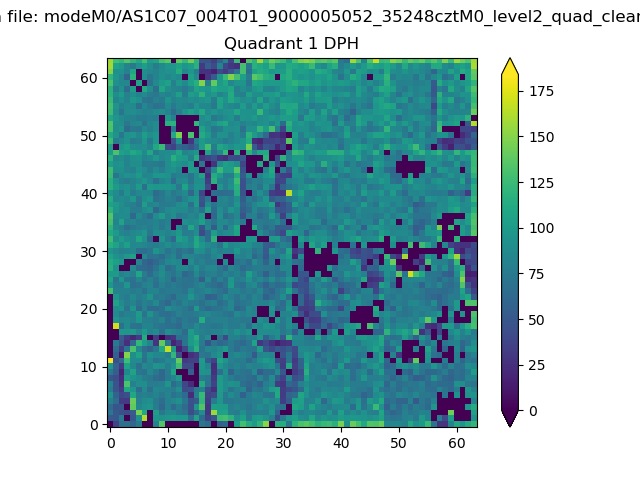 |
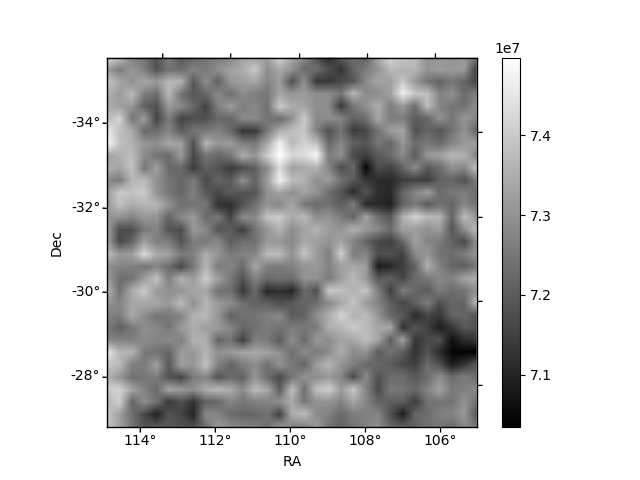
Quadrant B |
|---|---|---|---|
| Quadrant D | 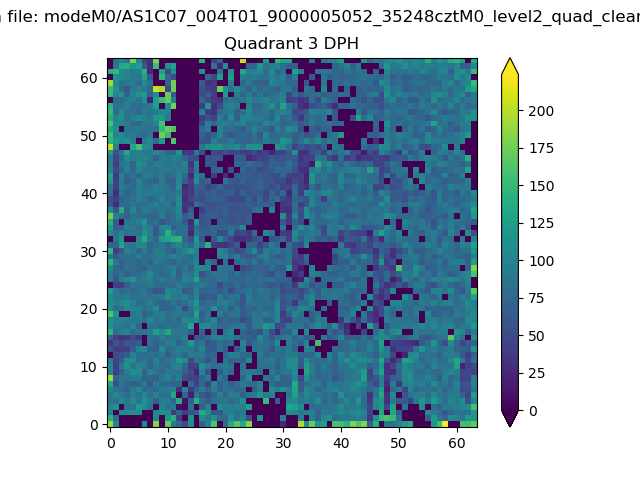 |
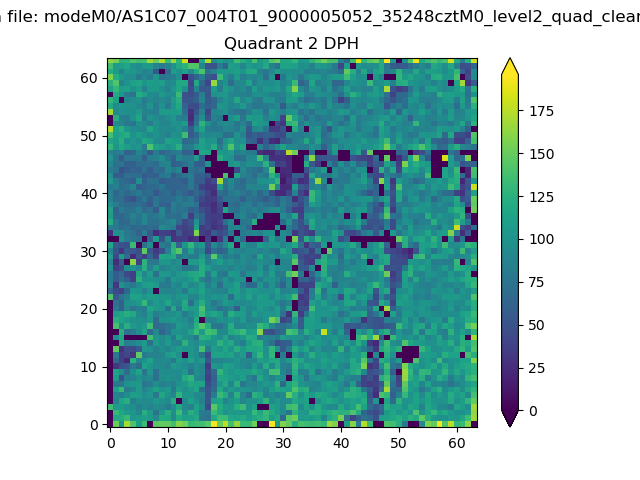 |
Quadrant C |
| Plot type | Count rate plots | Images |
|---|---|---|
| Comparison with Poisson distribution Blue bars denote a histogram of data divided into 1 sec bins. Red curve is a Poisson curve with rate = median count rate of data. |
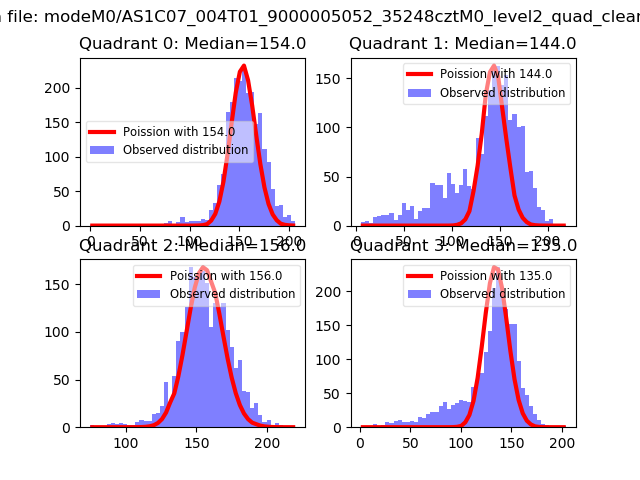 |
 |
| Quadrant-wise count rates Data is divided into 100 sec bins |
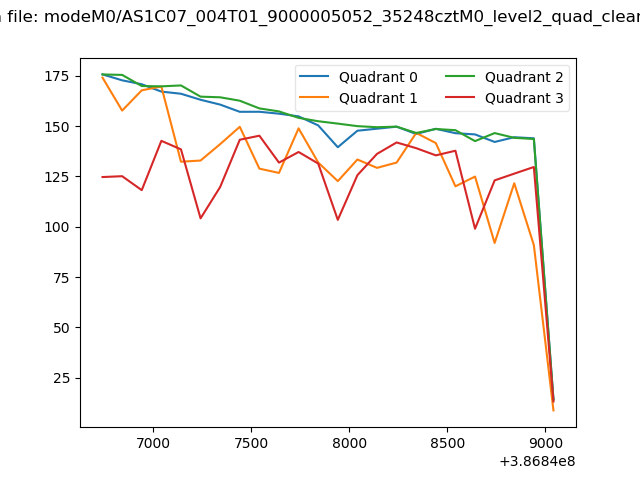 |
|
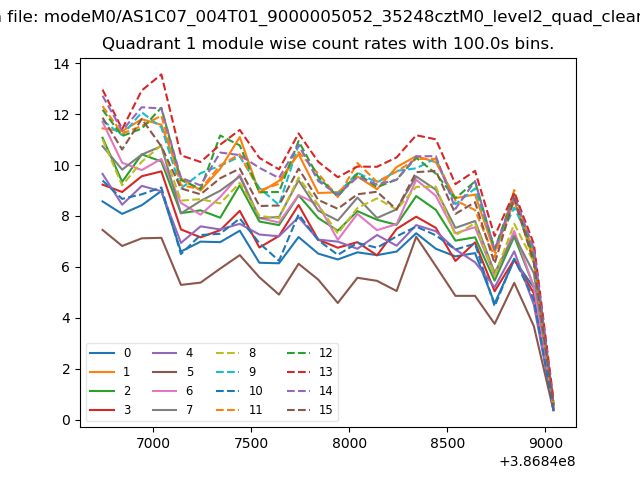
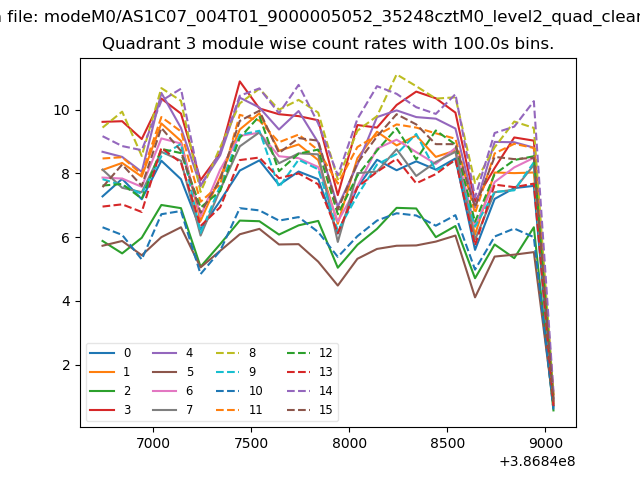
| Module-wise count rates for Quadrant A Data is divided into 100 sec bins |
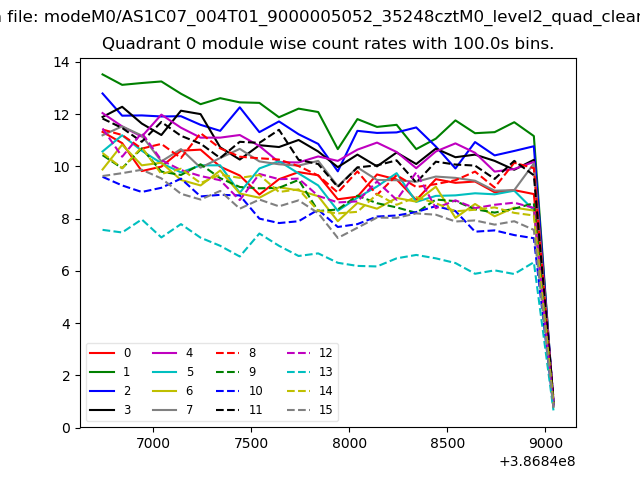 |
 |
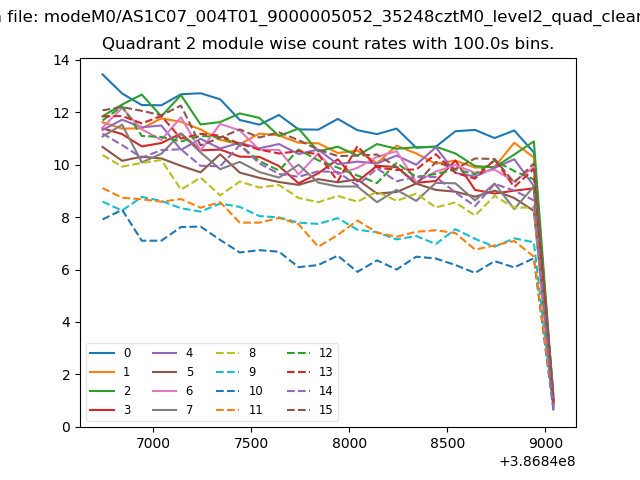
| Module-wise count rates for Quadrant B Data is divided into 100 sec bins |
 |
 |
| Module-wise count rates for Quadrant C Data is divided into 100 sec bins |
 |
 |
| Module-wise count rates for Quadrant D Data is divided into 100 sec bins |
 |
 |
| Parameter | Plot |
|---|---|
| CZT HV Monitor |  |
| D_VDD | 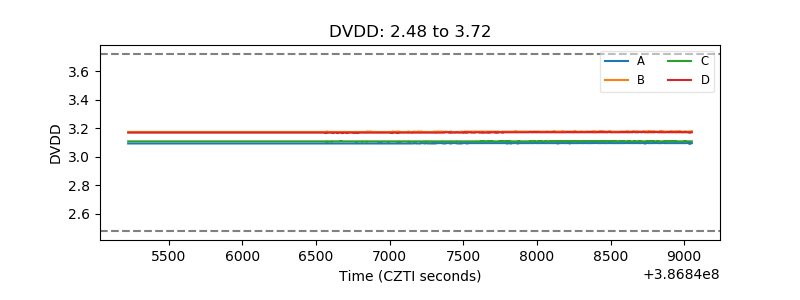 |
| Temperature 1 | 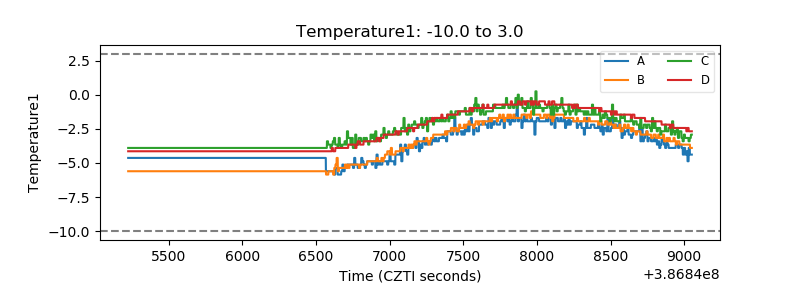 |
| Veto HV Monitor | 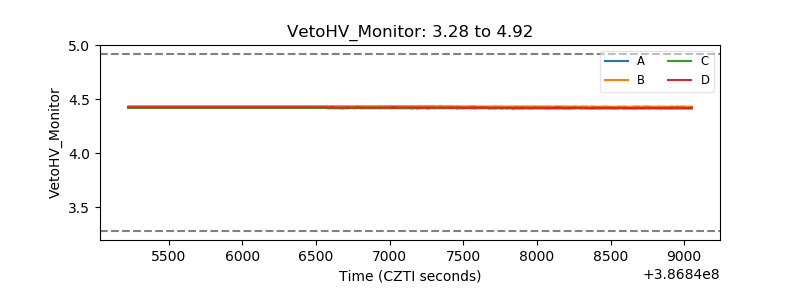 |
| Veto LLD | 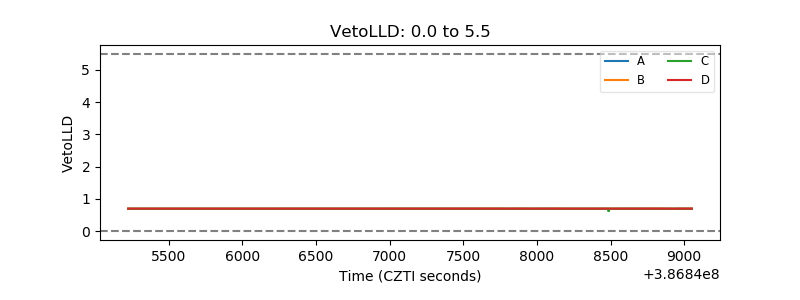 |
| Alpha Counter | 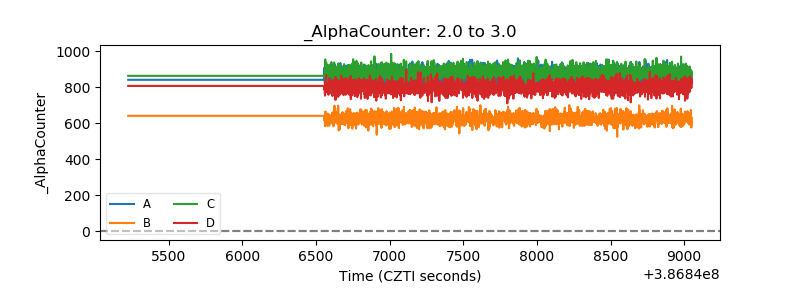 |
| _CPM_Rate | 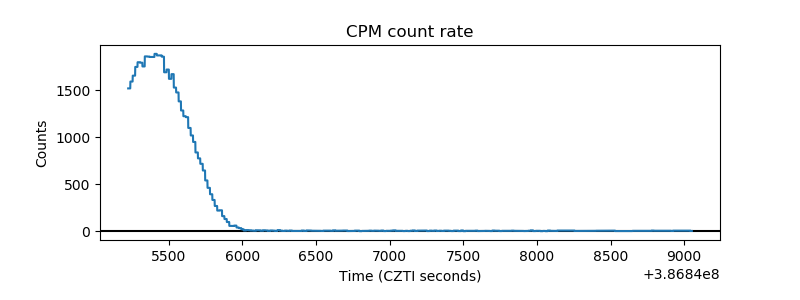 |
| CZT Counter | 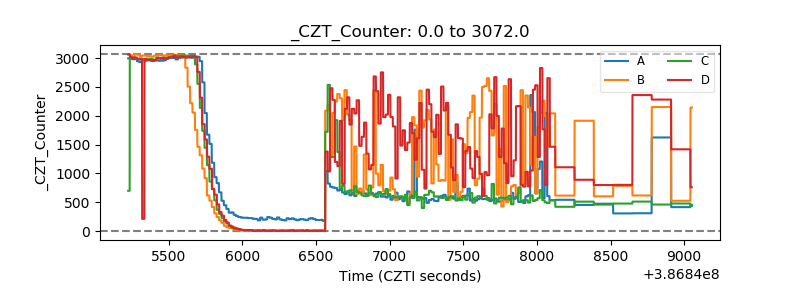 |
| +2.5 Volts monitor | 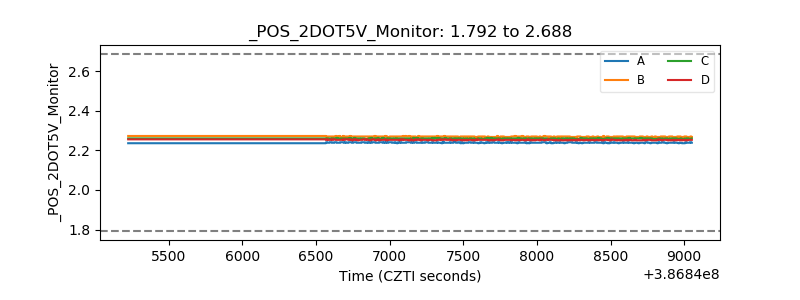 |
| +5 Volts monitor | 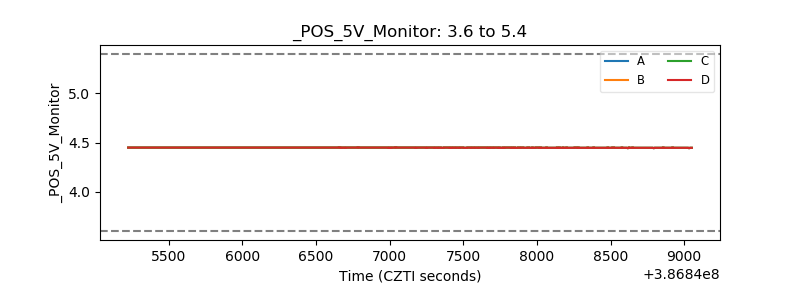 |
| _ROLL_ROT | 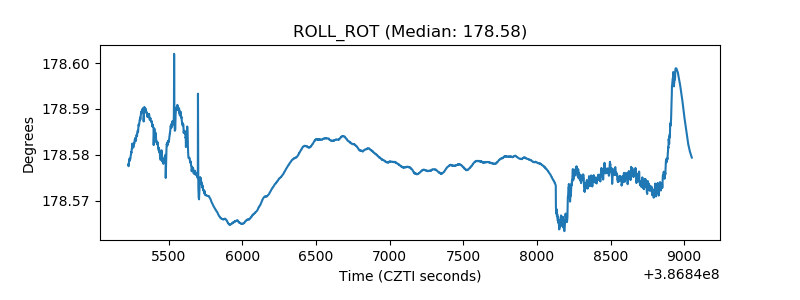 |
| _Roll_DEC |  |
| _Roll_RA | 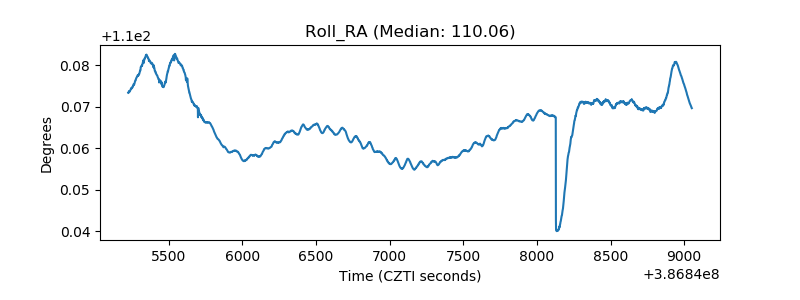 |
| Veto Counter | 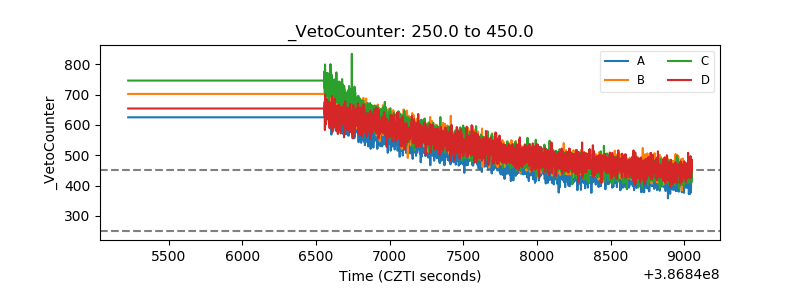 |