| Param | Original file | Final file |
|---|---|---|
| Filename | modeM0/AS1C07_004T01_9000005052_35247cztM0_level2.evt | modeM0/AS1C07_004T01_9000005052_35247cztM0_level2_quad_clean.evt |
| Size (bytes) | 718,018,560 | 88,977,600 |
| Size | 684.8 MB | 84.9 MB |
| Events in quadrant A | 3,141,566 | 632,119 |
| Events in quadrant B | 7,279,110 | 542,407 |
| Events in quadrant C | 3,140,131 | 645,239 |
| Events in quadrant D | 7,845,189 | 520,687 |
| Mode M0 | |||
|---|---|---|---|
| Quadrant | BADHDUFLAG | Total packets | Discarded packets |
| A | 0 | 12509 | 3 |
| B | 0 | 25230 | 2 |
| C | 0 | 12565 | 2 |
| D | 0 | 26872 | 2 |
| Mode SS | |||
|---|---|---|---|
| Quadrant | BADHDUFLAG | Total packets | Discarded packets |
| A | 0 | 102 | 0 |
| B | 0 | 102 | 0 |
| C | 0 | 102 | 0 |
| D | 0 | 102 | 0 |
| Mode M9 | |||
|---|---|---|---|
| Quadrant | BADHDUFLAG | Total packets | Discarded packets |
| A | 0 | 32 | 0 |
| B | 0 | 32 | 0 |
| C | 0 | 32 | 0 |
| D | 0 | 33 | 0 |
| Quadrant | Total seconds | Saturated seconds | Saturation percentage |
|---|---|---|---|
| A | 5035 | 125 | 2.482622% |
| B | 5035 | 1797 | 35.690169% |
| C | 5035 | 138 | 2.740814% |
| D | 5035 | 1486 | 29.513406% |
Noise dominated data is calculated using 1-second bins in cleaned event files. If a bin has >2000 counts, and if more than 50% of those come from <1% of pixels, then it is considered to be noise-dominated and hence unusable.
| Quadrant | # 1 sec bins | Bins with >0 counts | Bins with >2000 counts | High rate bins dominated by noise | Noise dominated (total time) | Noise dominated (detector-on time) | Marked lightcurve |
|---|---|---|---|---|---|---|---|
| A | 7098 | 5036 | 95 | 95 | 1.34% | 1.89% | 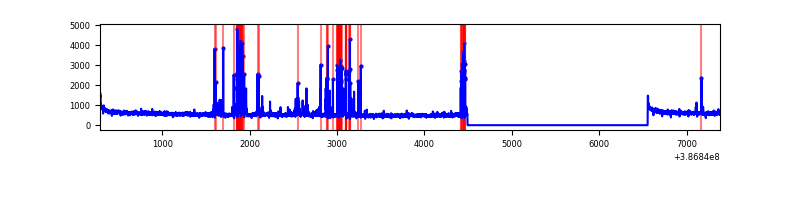 |
| B | 7098 | 5036 | 1296 | 1296 | 18.26% | 25.73% | 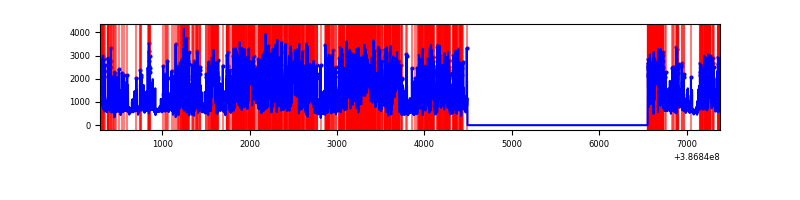 |
| C | 7098 | 5036 | 87 | 87 | 1.23% | 1.73% | 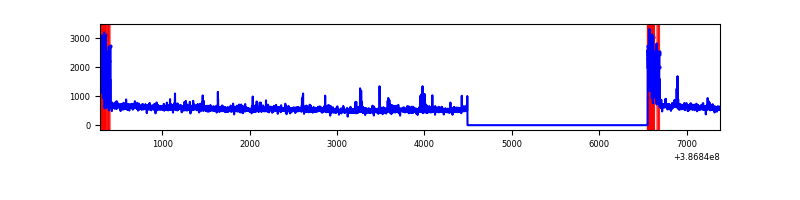 |
| D | 7098 | 5036 | 1301 | 1301 | 18.33% | 25.83% | 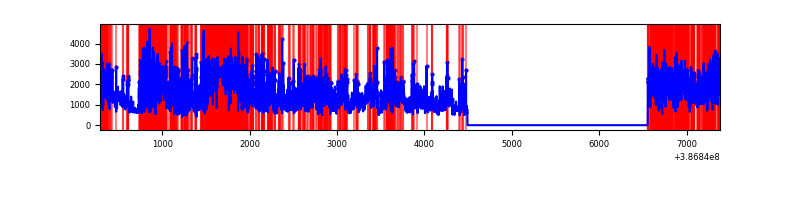 |
Top three noisy pixels from each quadrant. If the there are fewer than three noisy pixels in the level2.evt file, extra rows are filled as -1
| Pixel properties | Quadrant properties | ||||||
|---|---|---|---|---|---|---|---|
| Quadrant | DetID | PixID | Counts | Sigma | Mean | Median | Sigma |
| A | 7 | 3 | 427850 | 3196.33 | 672 | 661 | 133.6 |
| A | 10 | 83 | 96395 | 716.31 | 672 | 661 | 133.6 |
| A | 9 | 143 | 12919 | 91.72 | 672 | 661 | 133.6 |
| B | 5 | 236 | 4113376 | 38207.3 | 576 | 565 | 107.6 |
| B | 5 | 172 | 704230 | 6536.92 | 576 | 565 | 107.6 |
| B | 3 | 112 | 129413 | 1196.97 | 576 | 565 | 107.6 |
| C | 0 | 10 | 401033 | 2737.71 | 645 | 651 | 146.2 |
| C | 15 | 214 | 212771 | 1450.42 | 645 | 651 | 146.2 |
| C | 14 | 67 | 4942 | 29.34 | 645 | 651 | 146.2 |
| D | 7 | 80 | 2537496 | 17806.13 | 585 | 570 | 142.5 |
| D | 8 | 195 | 2054767 | 14417.96 | 585 | 570 | 142.5 |
| D | 2 | 250 | 277224 | 1941.77 | 585 | 570 | 142.5 |
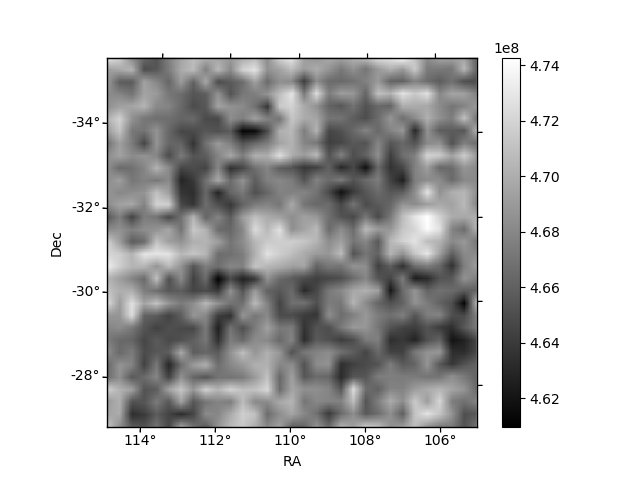
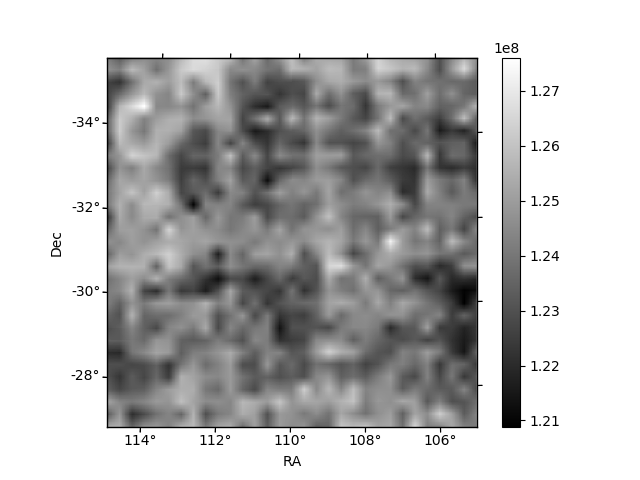
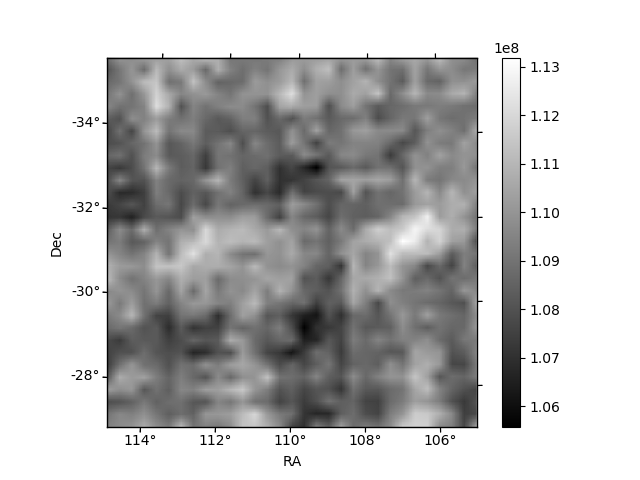
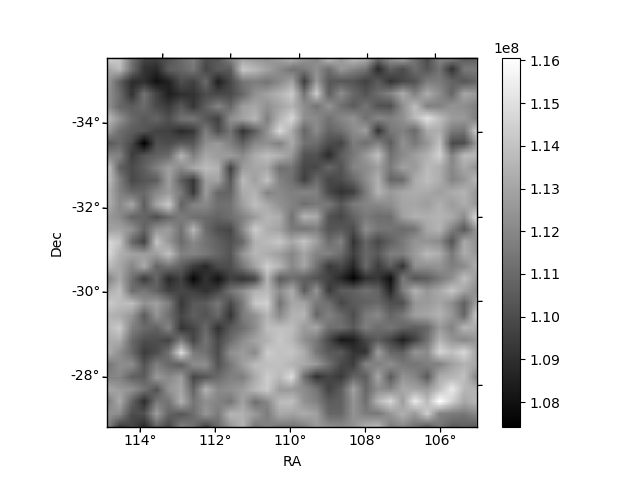
Histogram calculated using DETX and DETY for each event in the final _common_clean file
| Quadrant A | 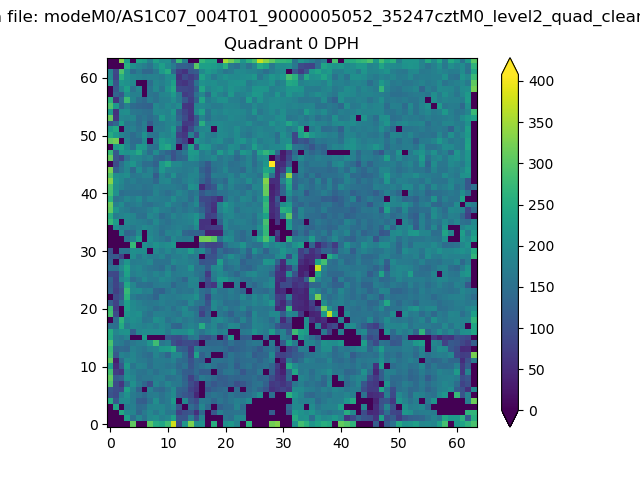 |
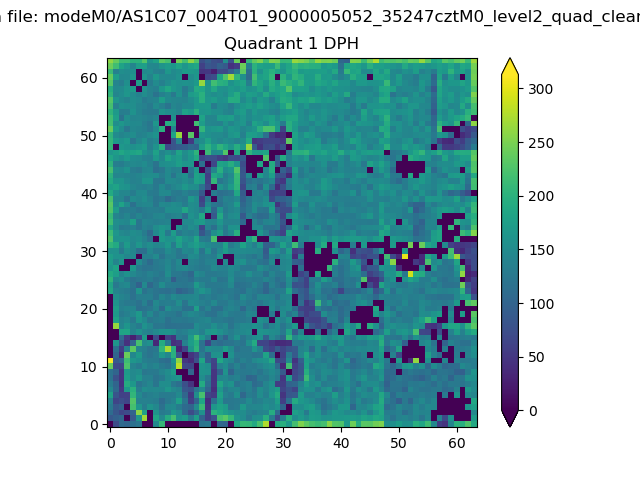 |
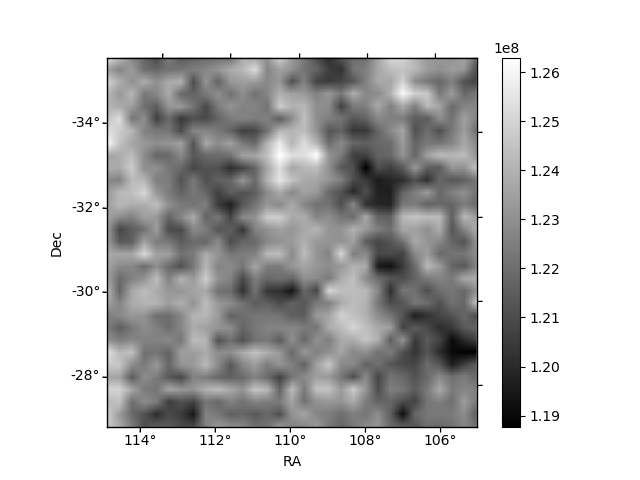
Quadrant B |
|---|---|---|---|
| Quadrant D | 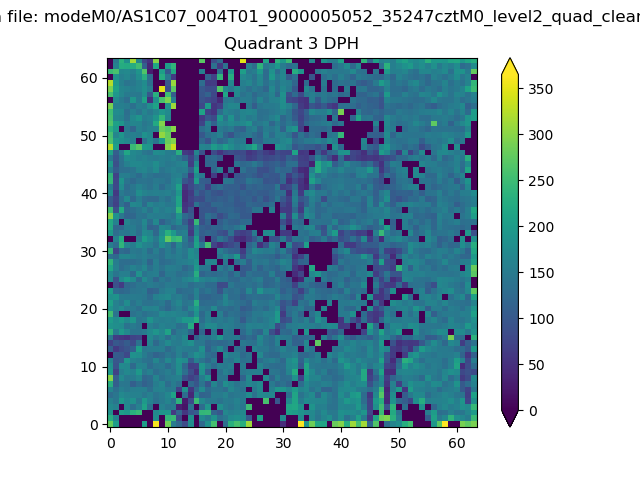 |
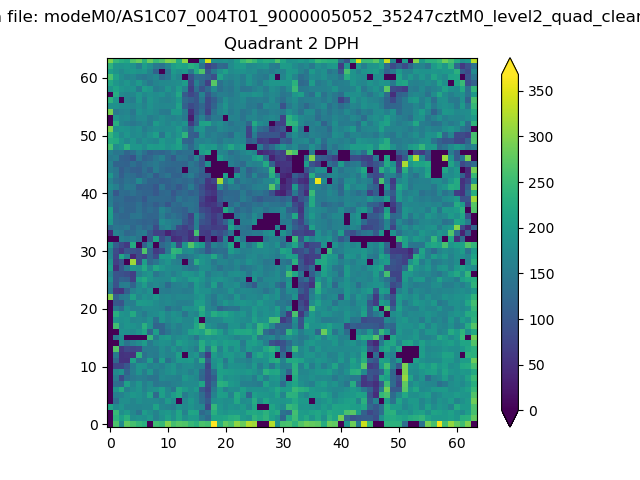 |
Quadrant C |
| Plot type | Count rate plots | Images |
|---|---|---|
| Comparison with Poisson distribution Blue bars denote a histogram of data divided into 1 sec bins. Red curve is a Poisson curve with rate = median count rate of data. |
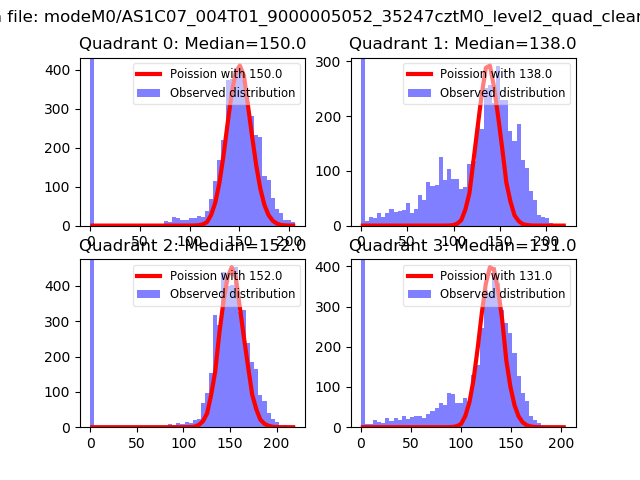 |
 |
| Quadrant-wise count rates Data is divided into 100 sec bins |
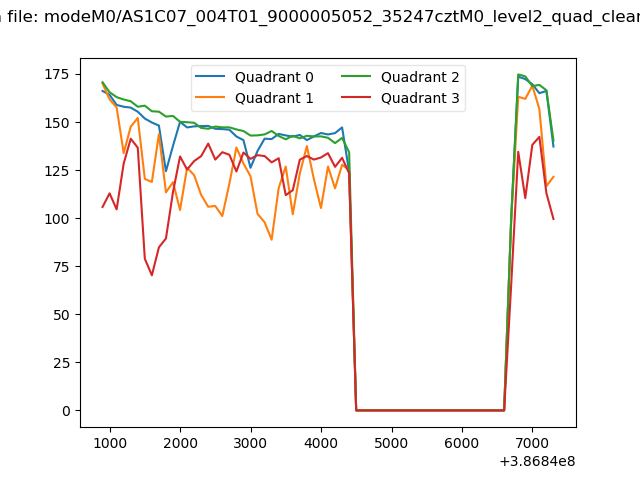 |
|
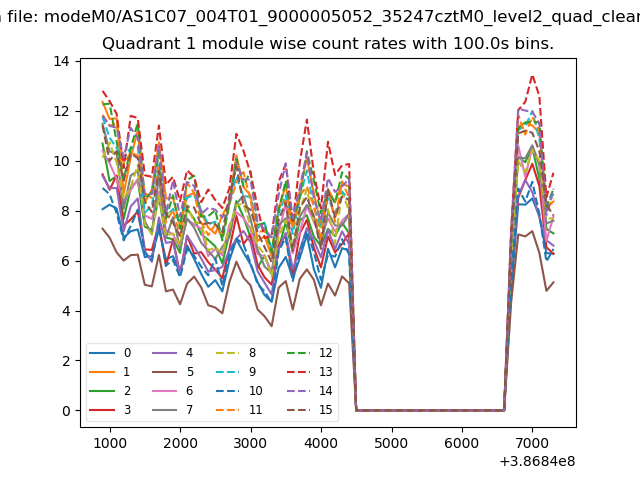
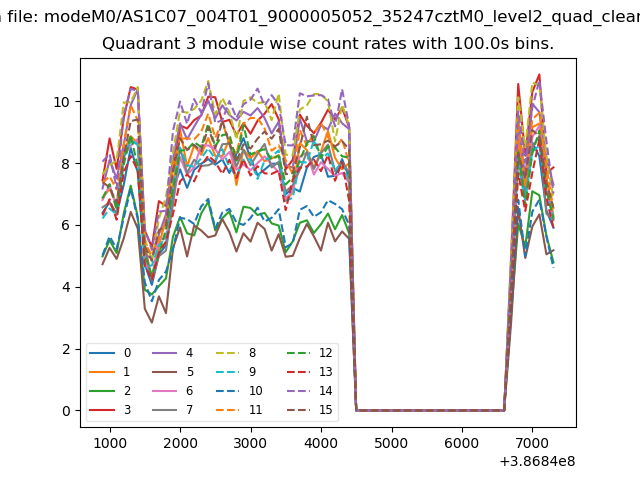
| Module-wise count rates for Quadrant A Data is divided into 100 sec bins |
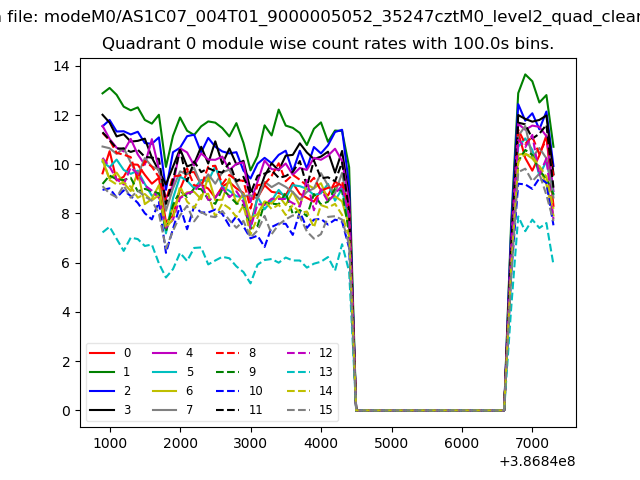 |
 |
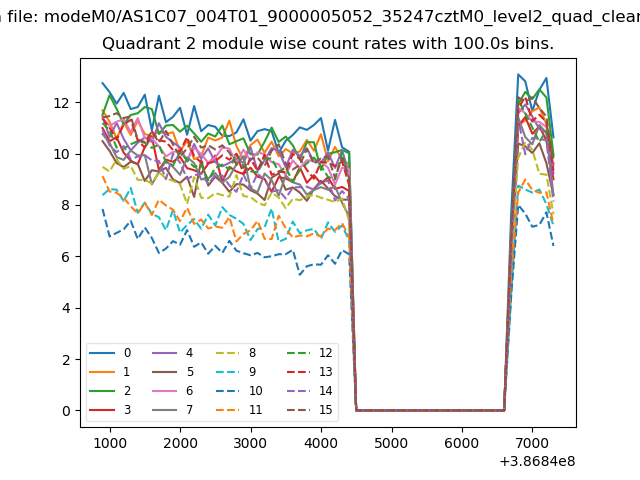
| Module-wise count rates for Quadrant B Data is divided into 100 sec bins |
 |
 |
| Module-wise count rates for Quadrant C Data is divided into 100 sec bins |
 |
 |
| Module-wise count rates for Quadrant D Data is divided into 100 sec bins |
 |
 |
| Parameter | Plot |
|---|---|
| CZT HV Monitor | 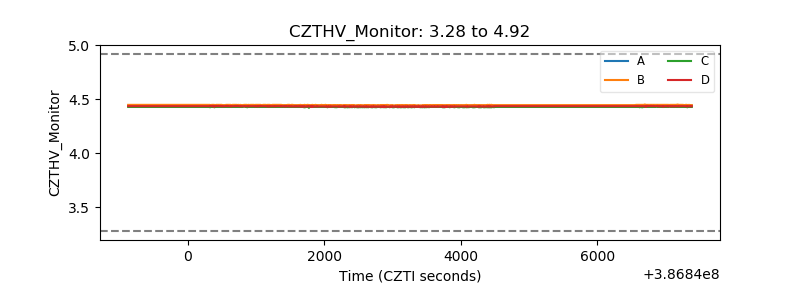 |
| D_VDD | 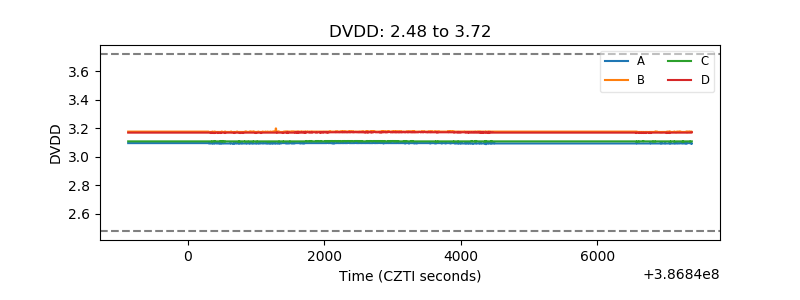 |
| Temperature 1 | 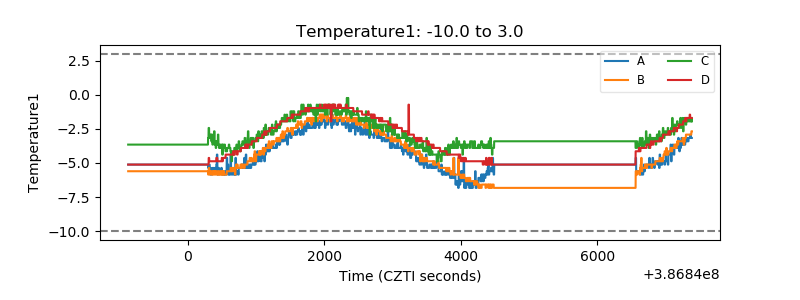 |
| Veto HV Monitor | 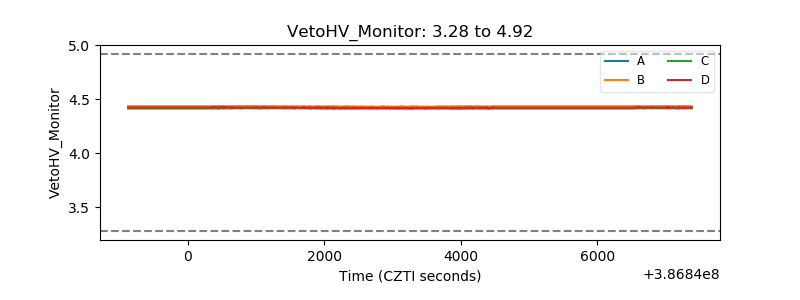 |
| Veto LLD | 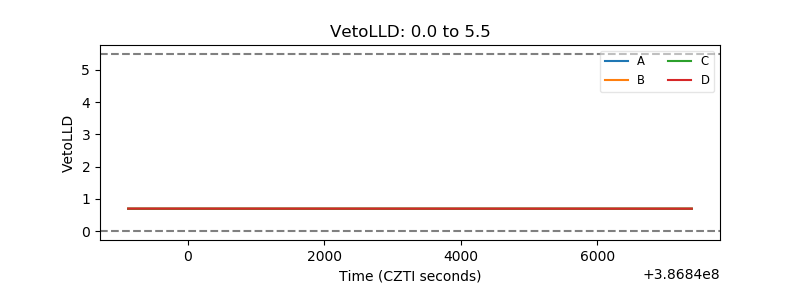 |
| Alpha Counter | 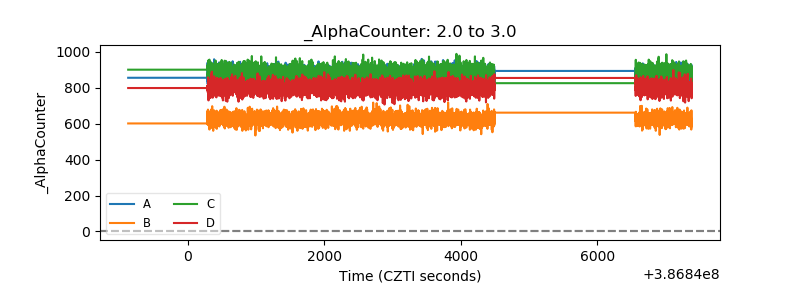 |
| _CPM_Rate | 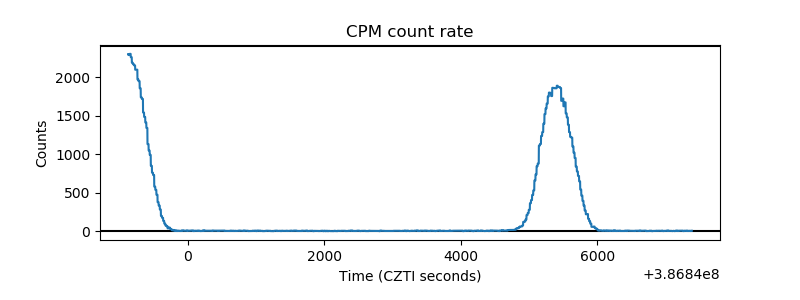 |
| CZT Counter | 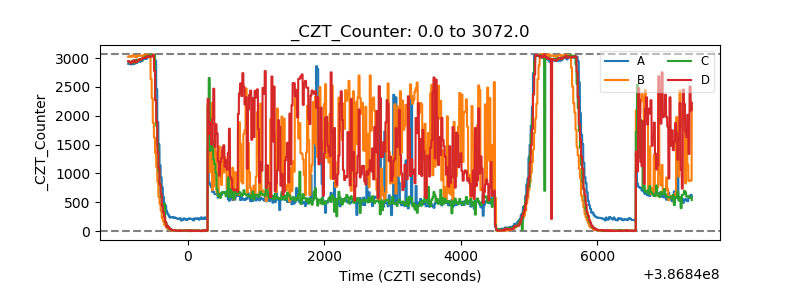 |
| +2.5 Volts monitor | 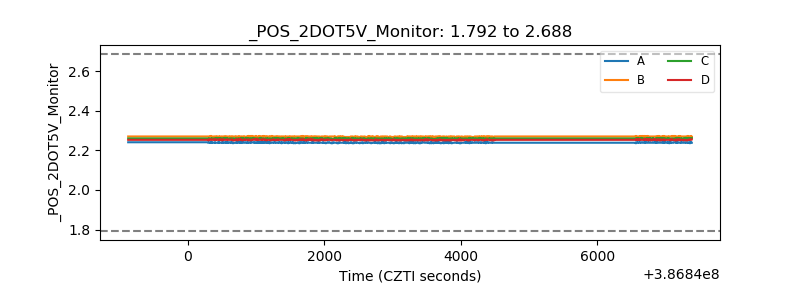 |
| +5 Volts monitor | 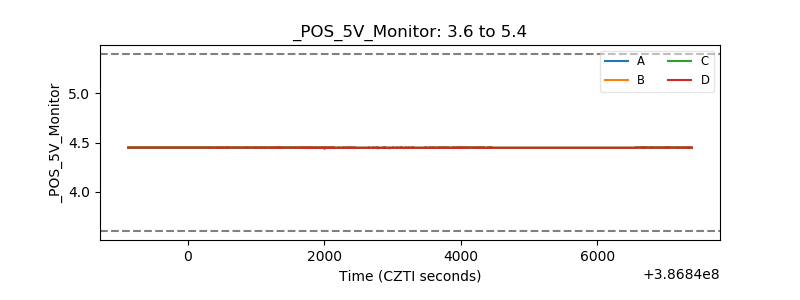 |
| _ROLL_ROT | 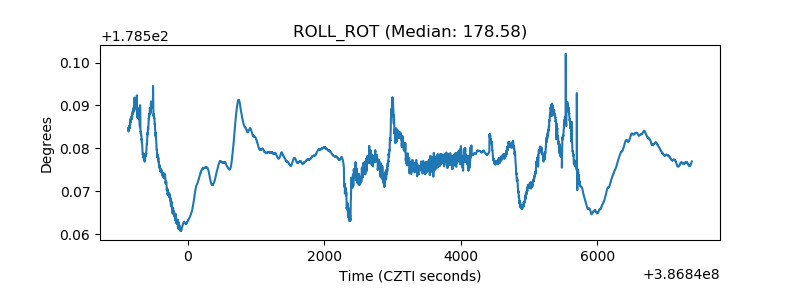 |
| _Roll_DEC | 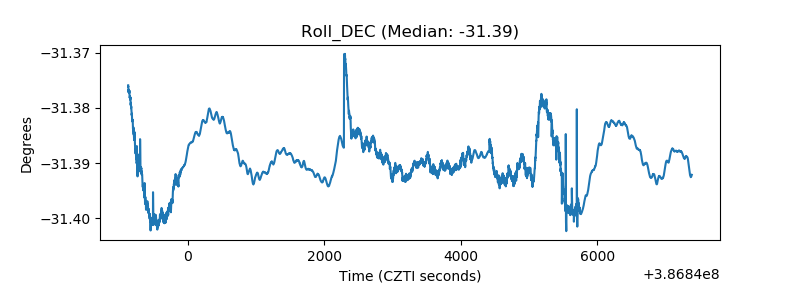 |
| _Roll_RA | 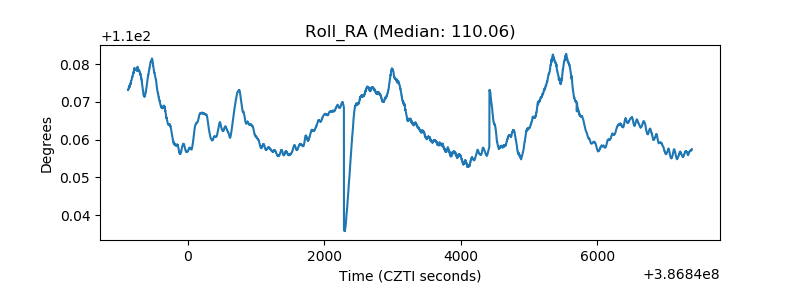 |
| Veto Counter | 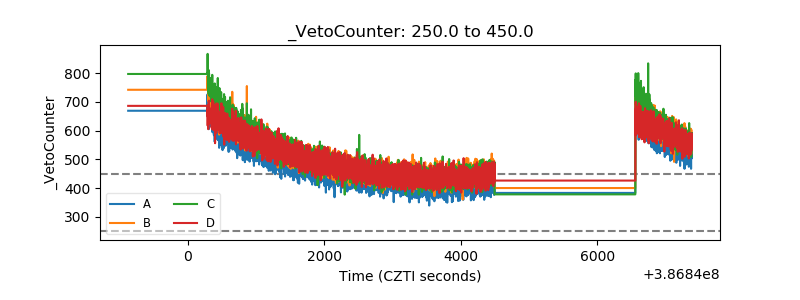 |