| Param | Original file | Final file |
|---|---|---|
| Filename | modeM0/AS1C07_004T01_9000005052_35236cztM0_level2.evt | modeM0/AS1C07_004T01_9000005052_35236cztM0_level2_quad_clean.evt |
| Size (bytes) | 717,333,120 | 69,537,600 |
| Size | 684.1 MB | 66.3 MB |
| Events in quadrant A | 2,560,041 | 472,351 |
| Events in quadrant B | 8,922,168 | 363,172 |
| Events in quadrant C | 2,982,637 | 466,825 |
| Events in quadrant D | 6,896,474 | 425,263 |
| Mode M0 | |||
|---|---|---|---|
| Quadrant | BADHDUFLAG | Total packets | Discarded packets |
| A | 0 | 11084 | 2 |
| B | 0 | 30246 | 1 |
| C | 0 | 12345 | 1 |
| D | 0 | 24321 | 1 |
| Mode SS | |||
|---|---|---|---|
| Quadrant | BADHDUFLAG | Total packets | Discarded packets |
| A | 0 | 110 | 0 |
| B | 0 | 110 | 0 |
| C | 0 | 110 | 0 |
| D | 0 | 110 | 0 |
| Mode M9 | |||
|---|---|---|---|
| Quadrant | BADHDUFLAG | Total packets | Discarded packets |
| A | 0 | 18 | 0 |
| B | 0 | 18 | 0 |
| C | 0 | 18 | 0 |
| D | 0 | 18 | 0 |
| Quadrant | Total seconds | Saturated seconds | Saturation percentage |
|---|---|---|---|
| A | 5384 | 7 | 0.130015% |
| B | 5384 | 2539 | 47.158247% |
| C | 5384 | 26 | 0.482912% |
| D | 5384 | 434 | 8.060921% |
Noise dominated data is calculated using 1-second bins in cleaned event files. If a bin has >2000 counts, and if more than 50% of those come from <1% of pixels, then it is considered to be noise-dominated and hence unusable.
| Quadrant | # 1 sec bins | Bins with >0 counts | Bins with >2000 counts | High rate bins dominated by noise | Noise dominated (total time) | Noise dominated (detector-on time) | Marked lightcurve |
|---|---|---|---|---|---|---|---|
| A | 7206 | 5385 | 1 | 1 | 0.01% | 0.02% | 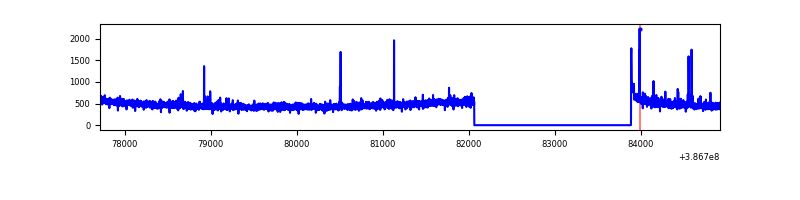 |
| B | 7206 | 5385 | 1883 | 1883 | 26.13% | 34.97% | 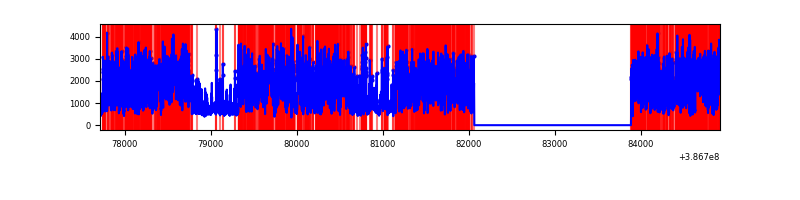 |
| C | 7206 | 5385 | 16 | 16 | 0.22% | 0.30% | 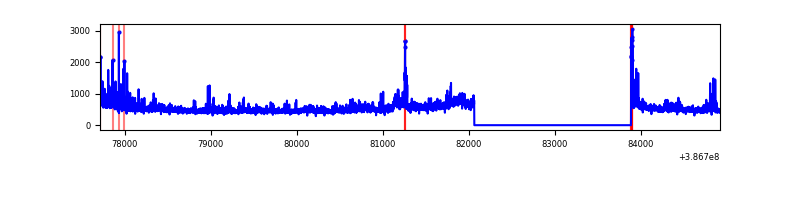 |
| D | 7206 | 5385 | 565 | 565 | 7.84% | 10.49% | 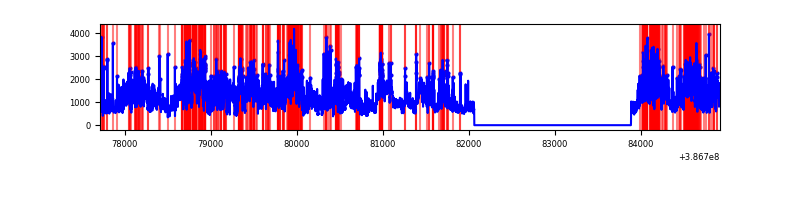 |
Top three noisy pixels from each quadrant. If the there are fewer than three noisy pixels in the level2.evt file, extra rows are filled as -1
| Pixel properties | Quadrant properties | ||||||
|---|---|---|---|---|---|---|---|
| Quadrant | DetID | PixID | Counts | Sigma | Mean | Median | Sigma |
| A | 10 | 83 | 84034 | 661.76 | 625 | 615 | 126.1 |
| A | 9 | 143 | 41327 | 322.97 | 625 | 615 | 126.1 |
| A | 13 | 6 | 10786 | 80.69 | 625 | 615 | 126.1 |
| B | 5 | 236 | 6128697 | 63652.17 | 500 | 489 | 96.3 |
| B | 5 | 172 | 746672 | 7750.42 | 500 | 489 | 96.3 |
| B | 5 | 200 | 28663 | 292.64 | 500 | 489 | 96.3 |
| C | 0 | 10 | 267484 | 1918.72 | 599 | 605 | 139.1 |
| C | 15 | 214 | 225936 | 1620.01 | 599 | 605 | 139.1 |
| C | 10 | 49 | 114004 | 815.28 | 599 | 605 | 139.1 |
| D | 8 | 195 | 2846501 | 19769.19 | 588 | 572 | 144.0 |
| D | 1 | 47 | 799125 | 5547.13 | 588 | 572 | 144.0 |
| D | 2 | 250 | 275124 | 1907.17 | 588 | 572 | 144.0 |
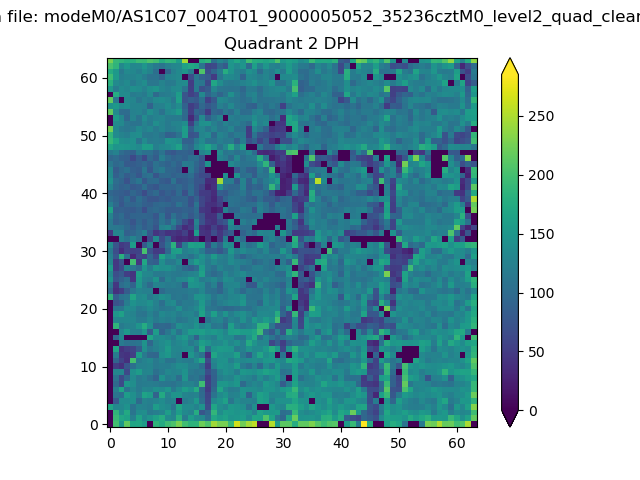
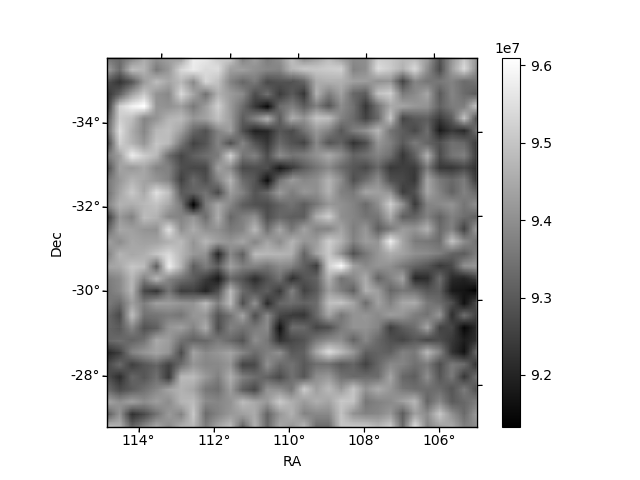
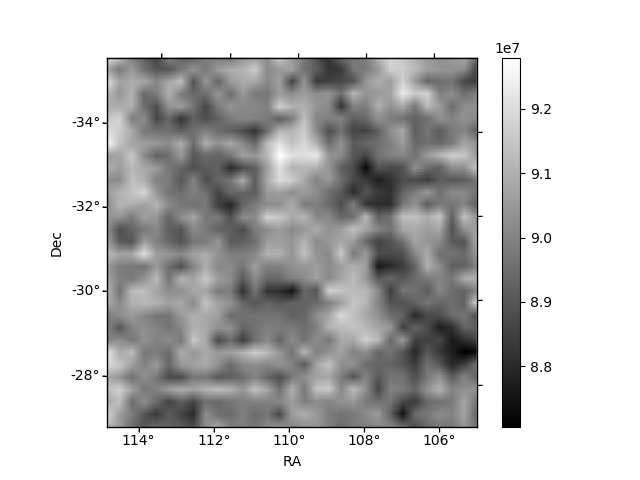
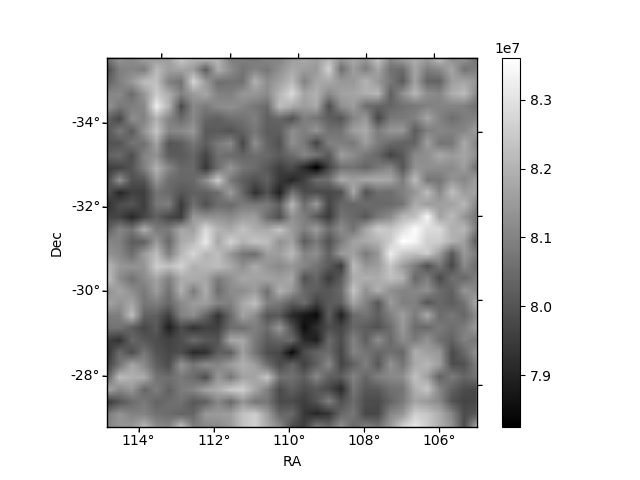
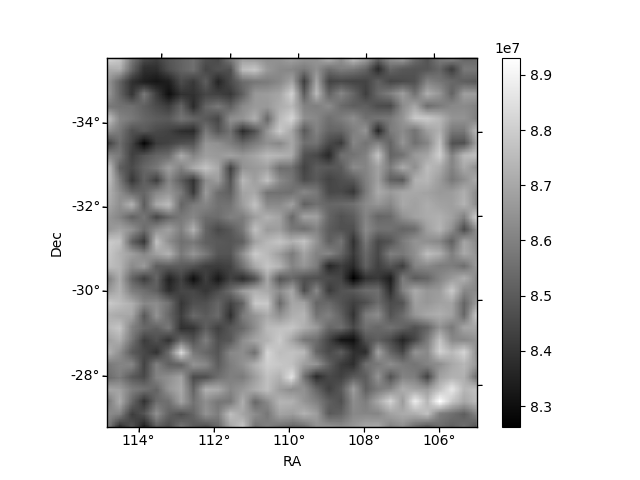
Histogram calculated using DETX and DETY for each event in the final _common_clean file
| Quadrant A | 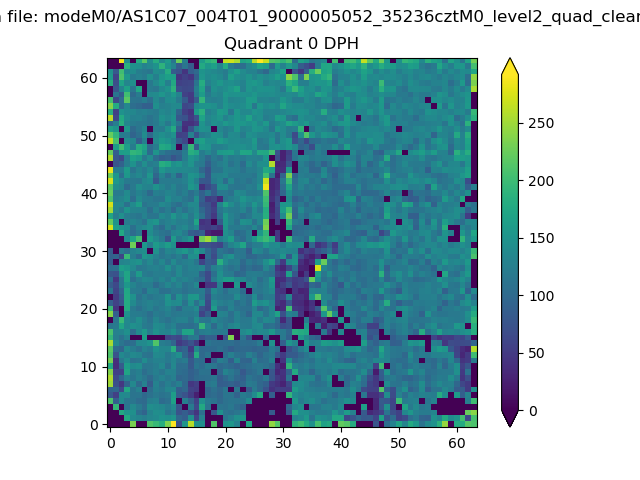 |
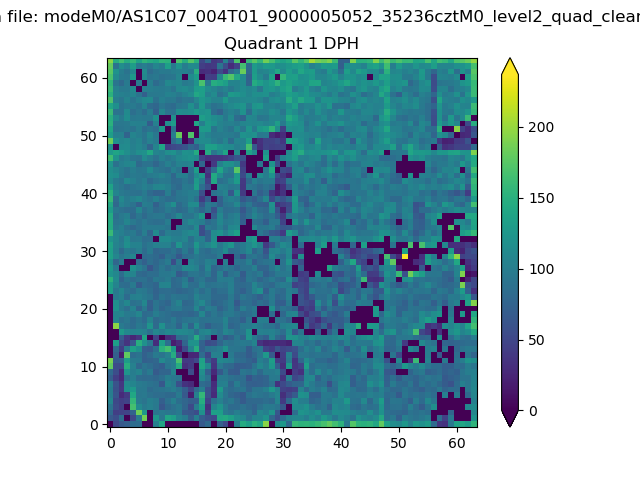 |
Quadrant B |
|---|---|---|---|
| Quadrant D | 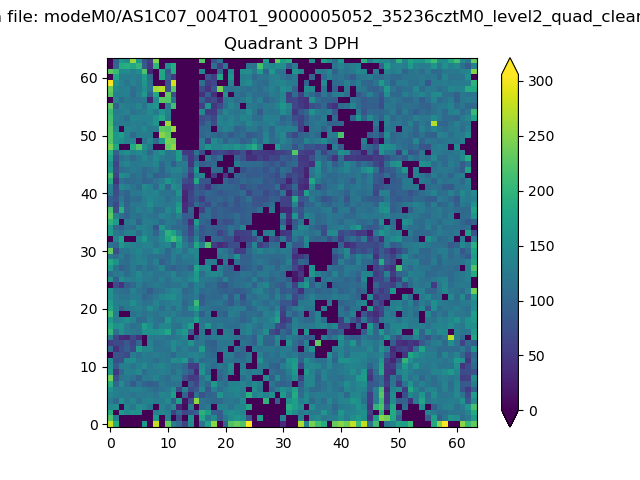 |
 |
Quadrant C |
| Plot type | Count rate plots | Images |
|---|---|---|
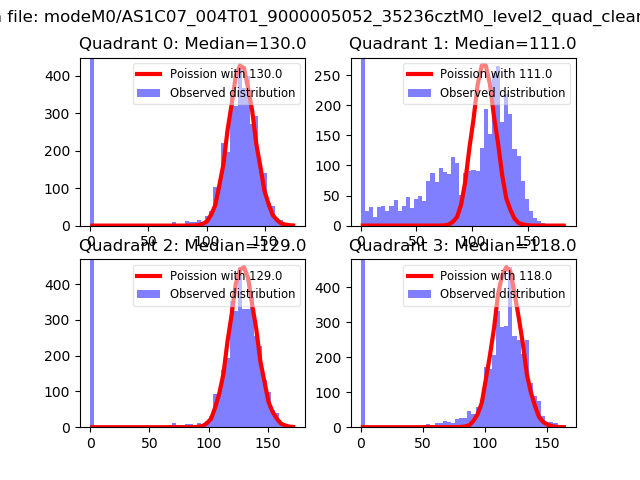
| Comparison with Poisson distribution Blue bars denote a histogram of data divided into 1 sec bins. Red curve is a Poisson curve with rate = median count rate of data. |
 |
 |
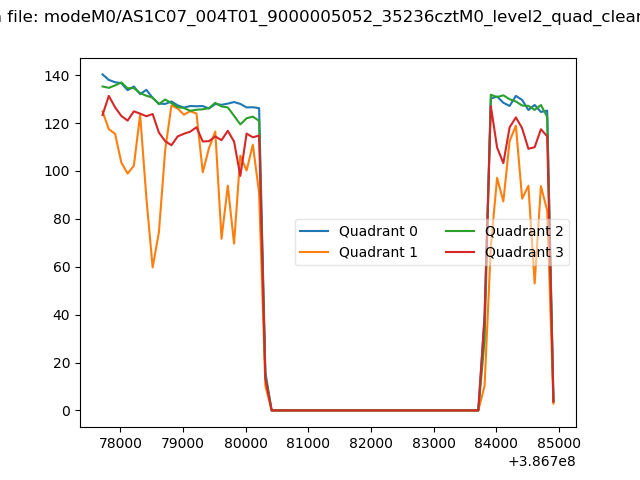
| Quadrant-wise count rates Data is divided into 100 sec bins |
 |
|
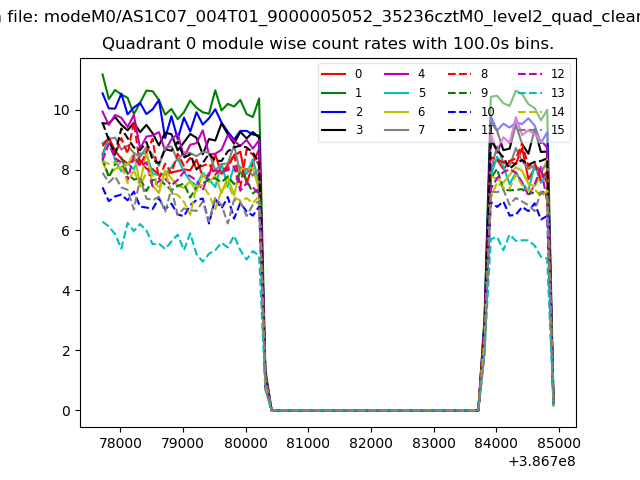
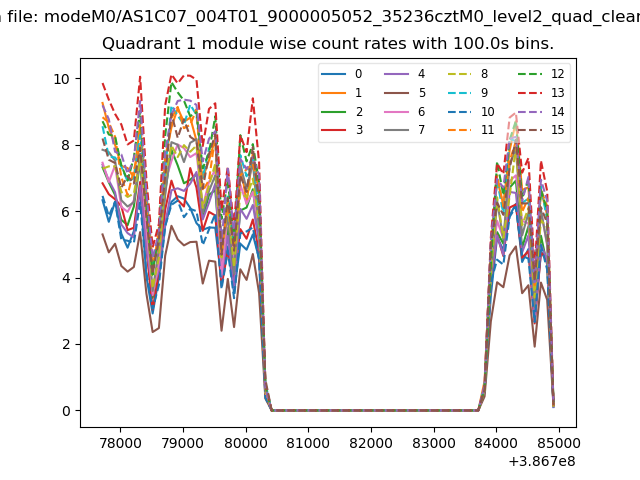
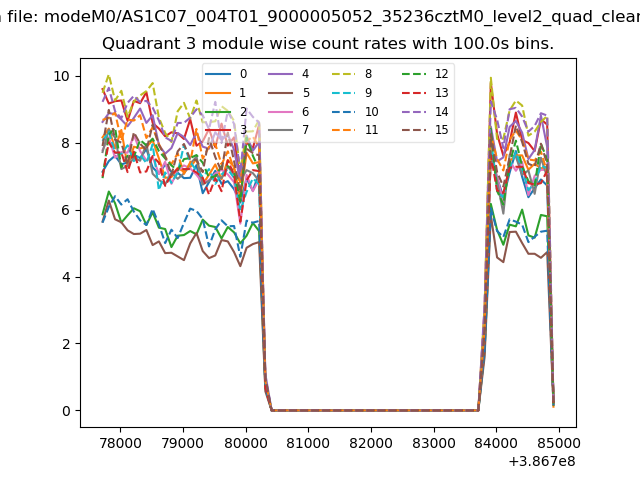
| Module-wise count rates for Quadrant A Data is divided into 100 sec bins |
 |
 |
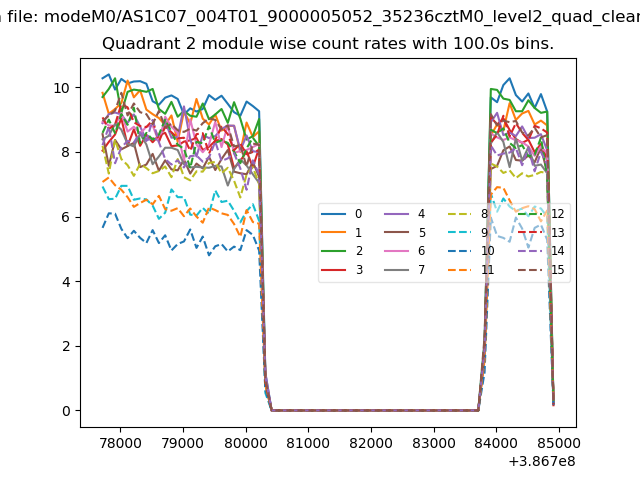
| Module-wise count rates for Quadrant B Data is divided into 100 sec bins |
 |
 |
| Module-wise count rates for Quadrant C Data is divided into 100 sec bins |
 |
 |
| Module-wise count rates for Quadrant D Data is divided into 100 sec bins |
 |
 |
| Parameter | Plot |
|---|---|
| CZT HV Monitor | 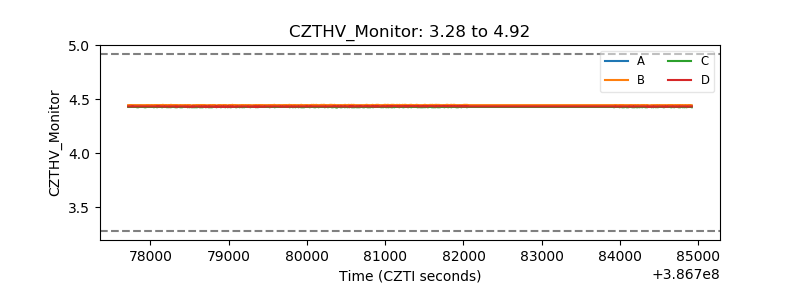 |
| D_VDD | 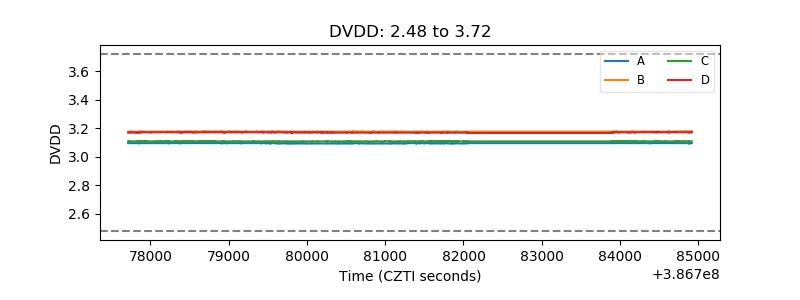 |
| Temperature 1 | 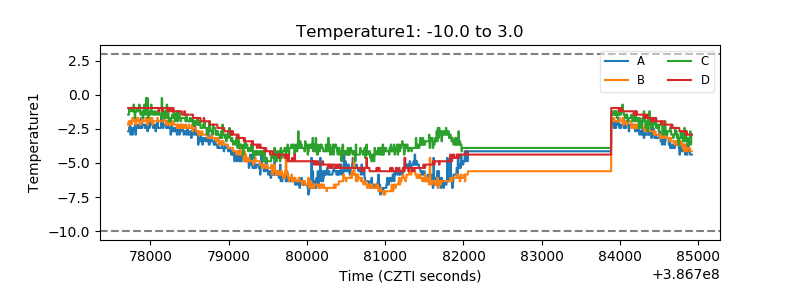 |
| Veto HV Monitor |  |
| Veto LLD | 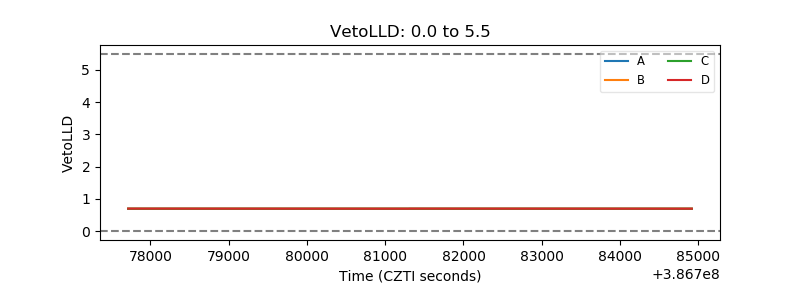 |
| Alpha Counter | 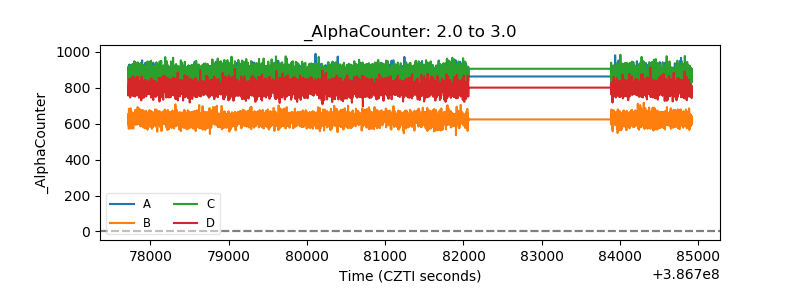 |
| _CPM_Rate | 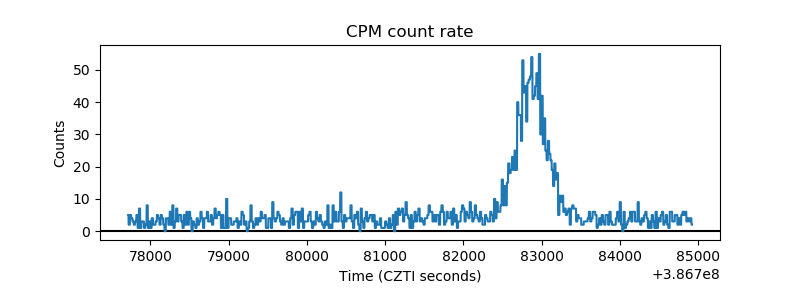 |
| CZT Counter | 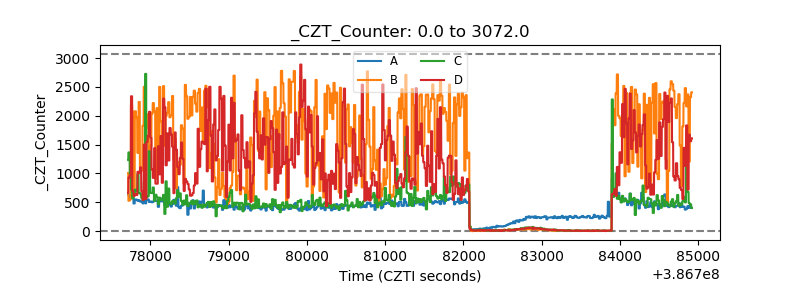 |
| +2.5 Volts monitor | 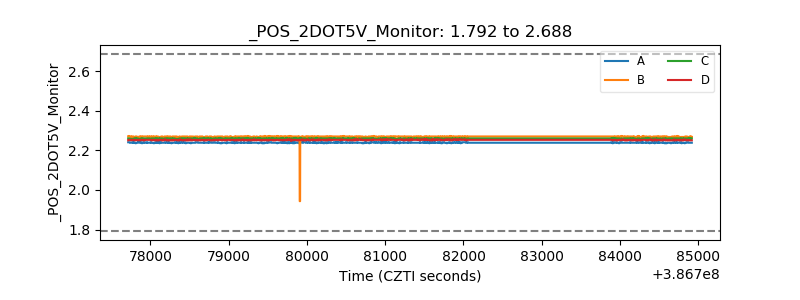 |
| +5 Volts monitor |  |
| _ROLL_ROT | 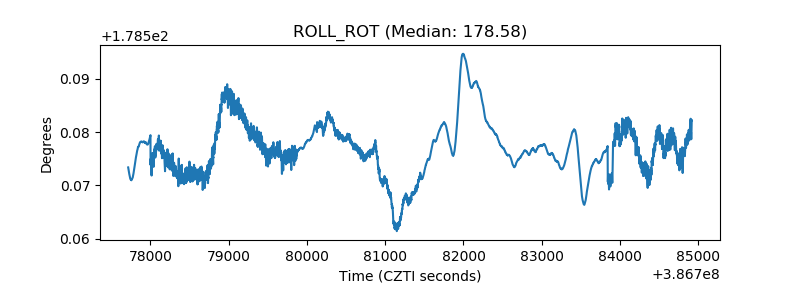 |
| _Roll_DEC | 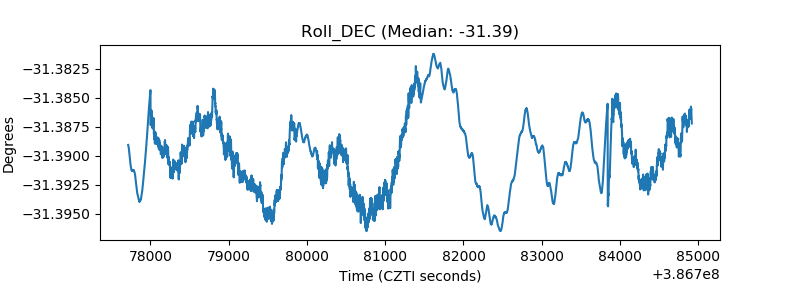 |
| _Roll_RA | 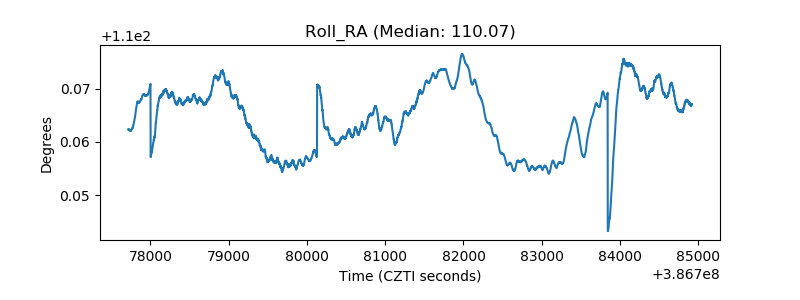 |
| Veto Counter | 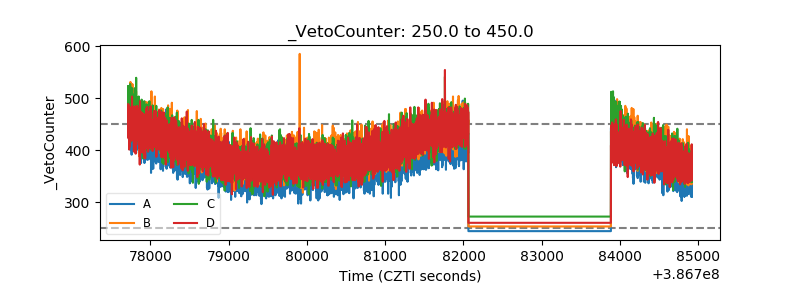 |