| Param | Original file | Final file |
|---|---|---|
| Filename | modeM0/AS1C07_004T01_9000005052_35232cztM0_level2.evt | modeM0/AS1C07_004T01_9000005052_35232cztM0_level2_quad_clean.evt |
| Size (bytes) | 826,539,840 | 79,159,680 |
| Size | 788.2 MB | 75.5 MB |
| Events in quadrant A | 2,740,568 | 598,199 |
| Events in quadrant B | 8,083,187 | 468,849 |
| Events in quadrant C | 3,175,809 | 602,041 |
| Events in quadrant D | 10,694,810 | 374,298 |
| Mode M0 | |||
|---|---|---|---|
| Quadrant | BADHDUFLAG | Total packets | Discarded packets |
| A | 0 | 11157 | 3 |
| B | 0 | 27545 | 2 |
| C | 0 | 12552 | 2 |
| D | 0 | 35130 | 2 |
| Mode SS | |||
|---|---|---|---|
| Quadrant | BADHDUFLAG | Total packets | Discarded packets |
| A | 0 | 102 | 0 |
| B | 0 | 102 | 0 |
| C | 0 | 102 | 0 |
| D | 0 | 102 | 0 |
| Mode M9 | |||
|---|---|---|---|
| Quadrant | BADHDUFLAG | Total packets | Discarded packets |
| A | 0 | 31 | 0 |
| B | 0 | 31 | 0 |
| C | 0 | 31 | 0 |
| D | 0 | 32 | 0 |
| Quadrant | Total seconds | Saturated seconds | Saturation percentage |
|---|---|---|---|
| A | 5017 | 10 | 0.199322% |
| B | 5017 | 2216 | 44.169823% |
| C | 5017 | 137 | 2.730716% |
| D | 5017 | 2895 | 57.703807% |
Noise dominated data is calculated using 1-second bins in cleaned event files. If a bin has >2000 counts, and if more than 50% of those come from <1% of pixels, then it is considered to be noise-dominated and hence unusable.
| Quadrant | # 1 sec bins | Bins with >0 counts | Bins with >2000 counts | High rate bins dominated by noise | Noise dominated (total time) | Noise dominated (detector-on time) | Marked lightcurve |
|---|---|---|---|---|---|---|---|
| A | 7050 | 5018 | 1 | 1 | 0.01% | 0.02% | 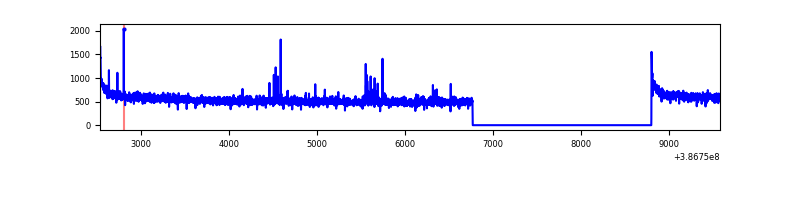 |
| B | 7050 | 5018 | 1609 | 1609 | 22.82% | 32.06% | 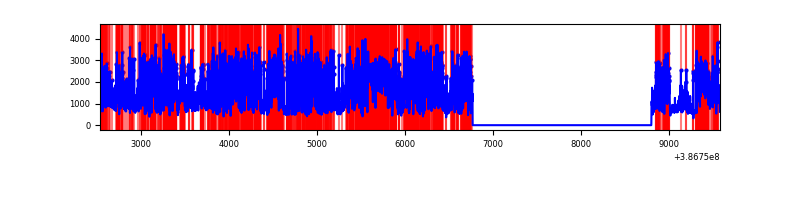 |
| C | 7050 | 5018 | 80 | 80 | 1.13% | 1.59% | 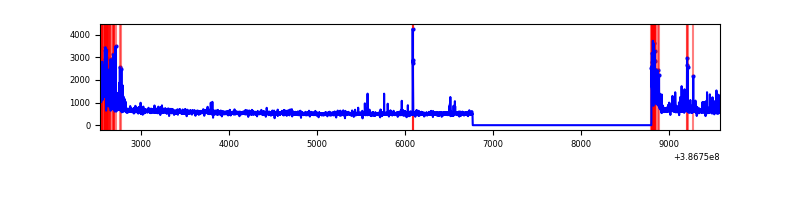 |
| D | 7050 | 5018 | 2839 | 2839 | 40.27% | 56.58% | 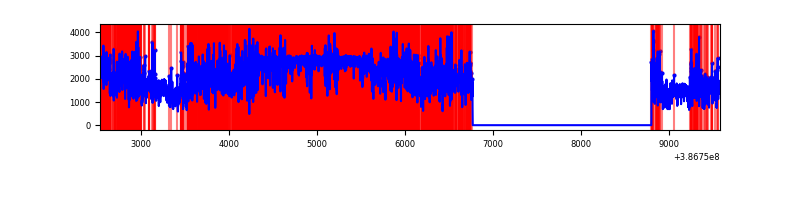 |
Top three noisy pixels from each quadrant. If the there are fewer than three noisy pixels in the level2.evt file, extra rows are filled as -1
| Pixel properties | Quadrant properties | ||||||
|---|---|---|---|---|---|---|---|
| Quadrant | DetID | PixID | Counts | Sigma | Mean | Median | Sigma |
| A | 10 | 83 | 99434 | 741.12 | 666 | 657 | 133.3 |
| A | 9 | 143 | 26032 | 190.39 | 666 | 657 | 133.3 |
| A | 12 | 16 | 20573 | 149.43 | 666 | 657 | 133.3 |
| B | 5 | 236 | 5386996 | 53273.28 | 541 | 529 | 101.1 |
| B | 5 | 172 | 525565 | 5192.72 | 541 | 529 | 101.1 |
| B | 14 | 207 | 25659 | 248.54 | 541 | 529 | 101.1 |
| C | 0 | 10 | 358191 | 2477.59 | 637 | 646 | 144.3 |
| C | 15 | 214 | 213267 | 1473.34 | 637 | 646 | 144.3 |
| C | 12 | 250 | 55498 | 380.09 | 637 | 646 | 144.3 |
| D | 8 | 195 | 4047608 | 34152.91 | 486 | 474 | 118.5 |
| D | 8 | 230 | 2800552 | 23629.27 | 486 | 474 | 118.5 |
| D | 7 | 80 | 1209119 | 10199.5 | 486 | 474 | 118.5 |
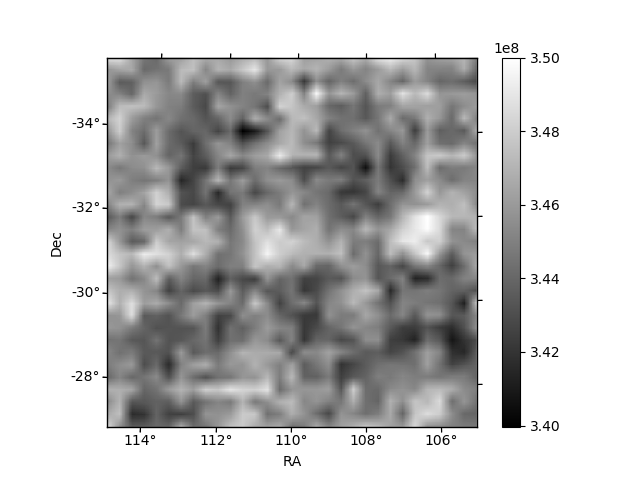
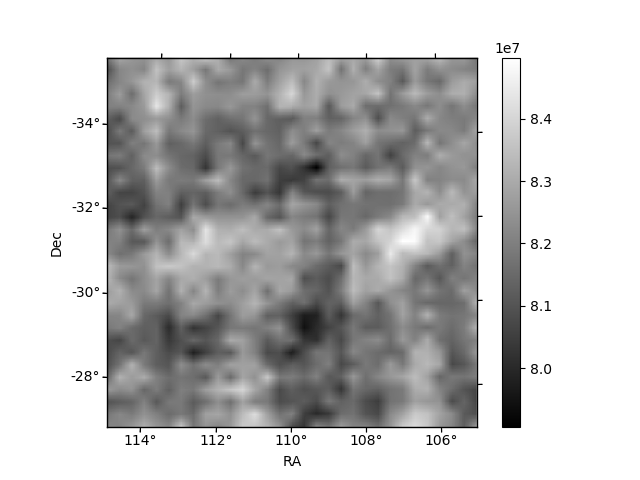
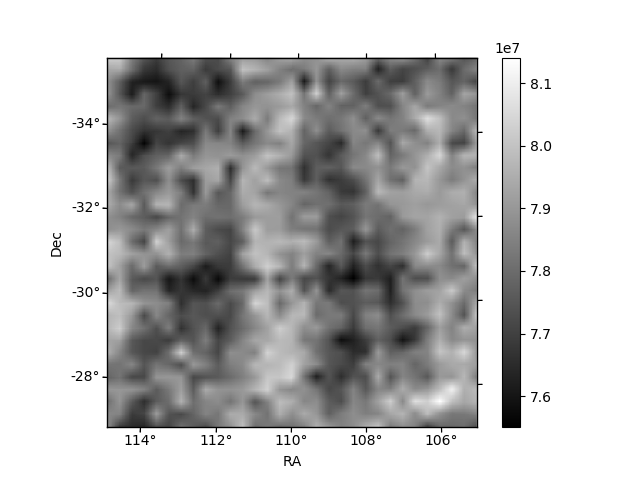
Histogram calculated using DETX and DETY for each event in the final _common_clean file
| Quadrant A | 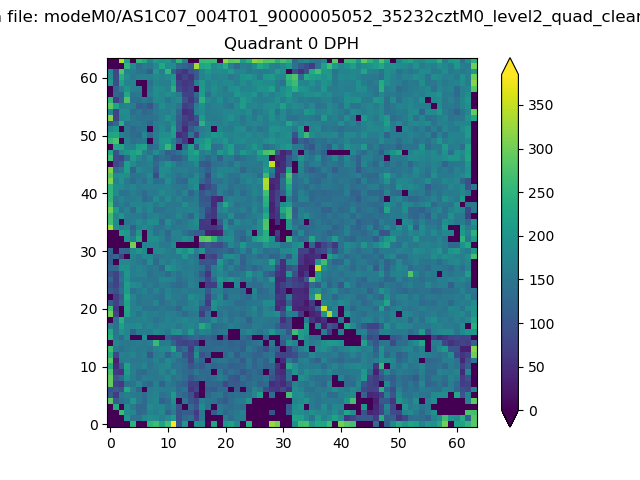 |
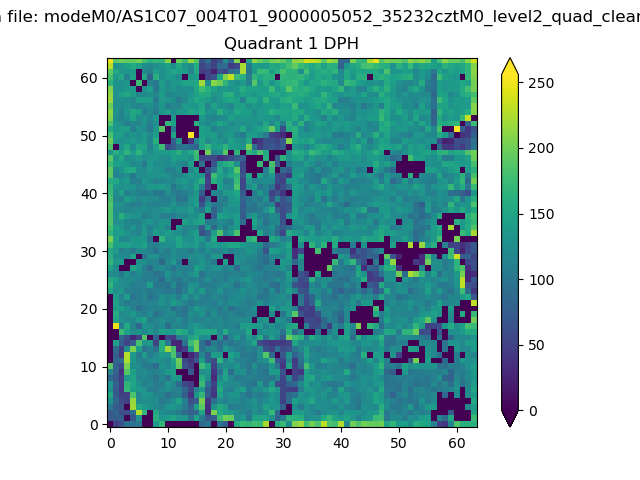 |
Quadrant B |
|---|---|---|---|
| Quadrant D | 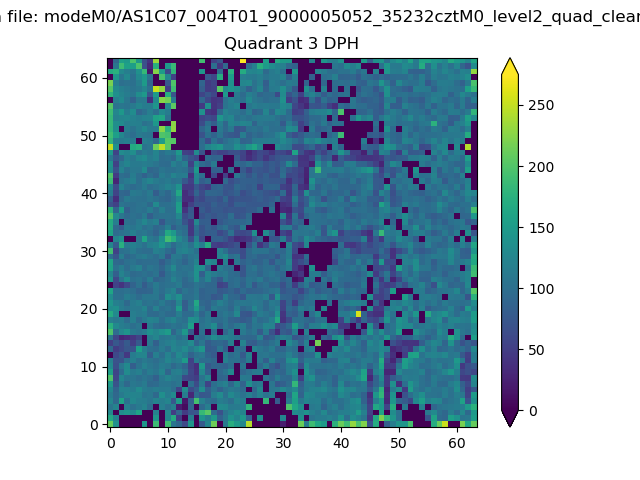 |
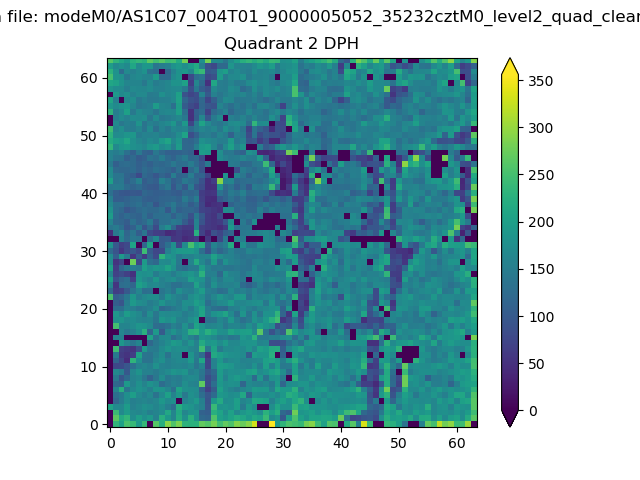 |
Quadrant C |
| Plot type | Count rate plots | Images |
|---|---|---|
| Comparison with Poisson distribution Blue bars denote a histogram of data divided into 1 sec bins. Red curve is a Poisson curve with rate = median count rate of data. |
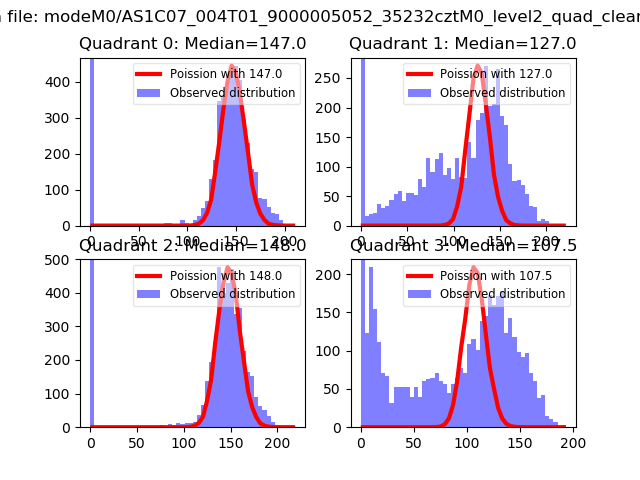 |
 |
| Quadrant-wise count rates Data is divided into 100 sec bins |
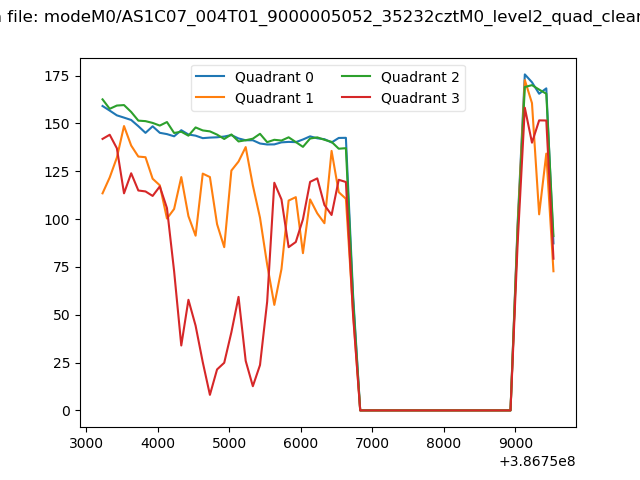 |
|
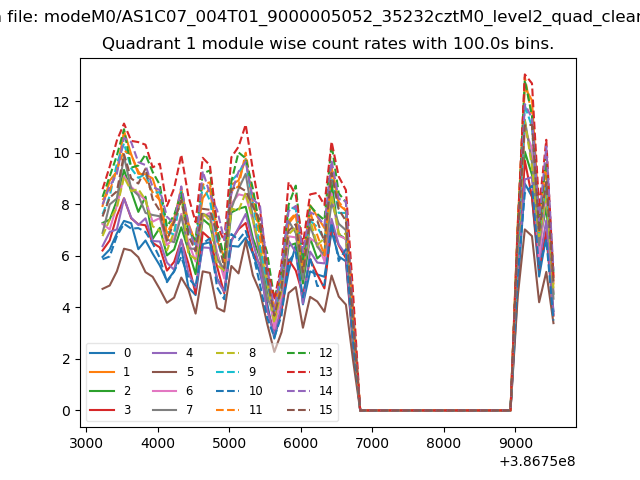
| Module-wise count rates for Quadrant A Data is divided into 100 sec bins |
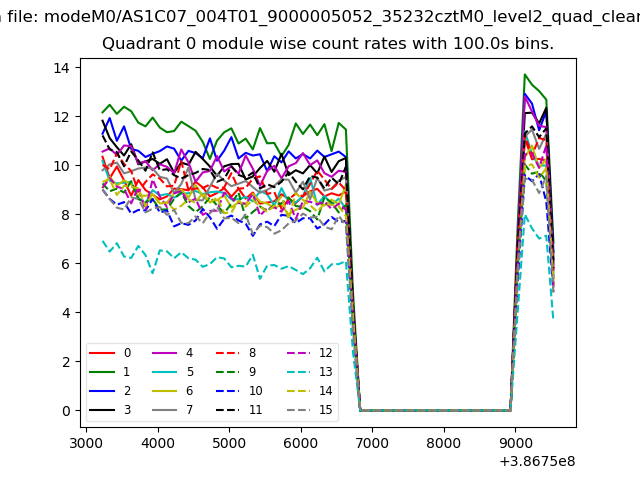 |
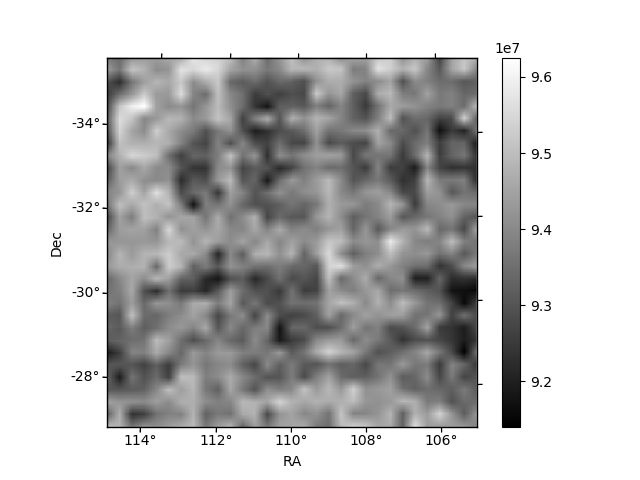 |
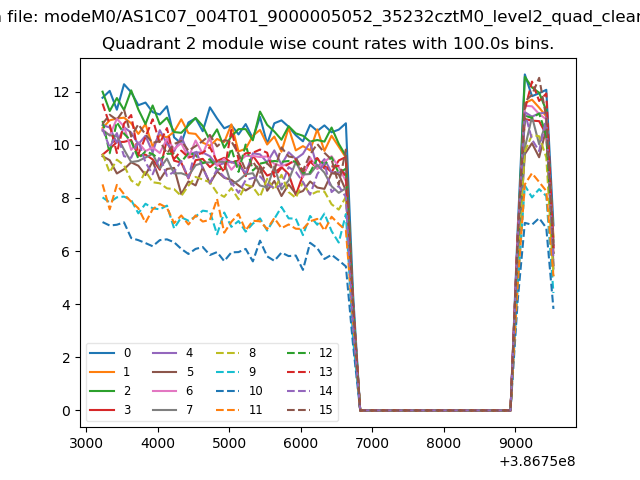
| Module-wise count rates for Quadrant B Data is divided into 100 sec bins |
 |
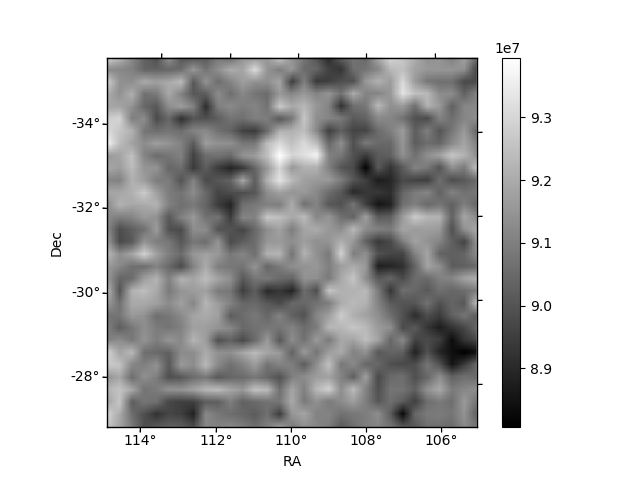 |
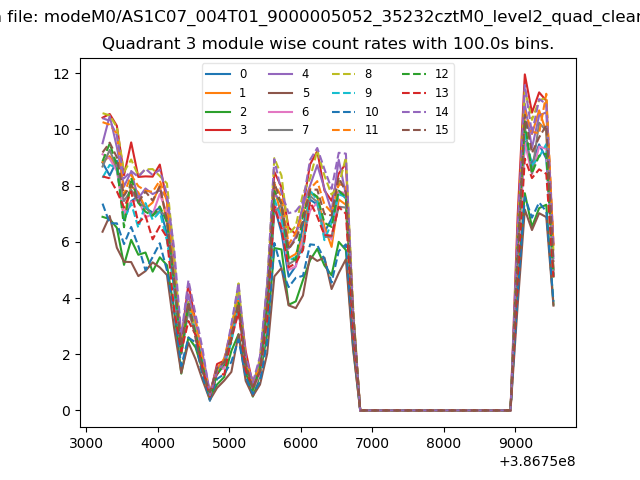
| Module-wise count rates for Quadrant C Data is divided into 100 sec bins |
 |
 |
| Module-wise count rates for Quadrant D Data is divided into 100 sec bins |
 |
 |
| Parameter | Plot |
|---|---|
| CZT HV Monitor | 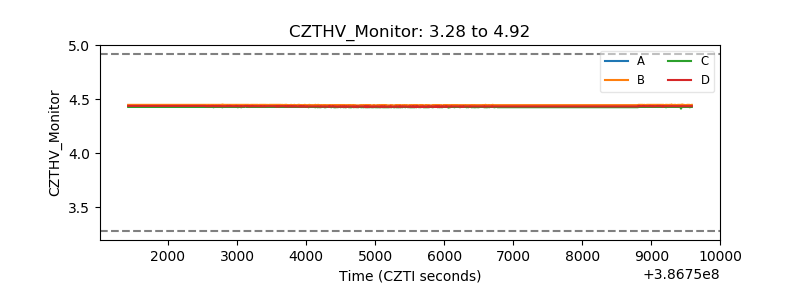 |
| D_VDD | 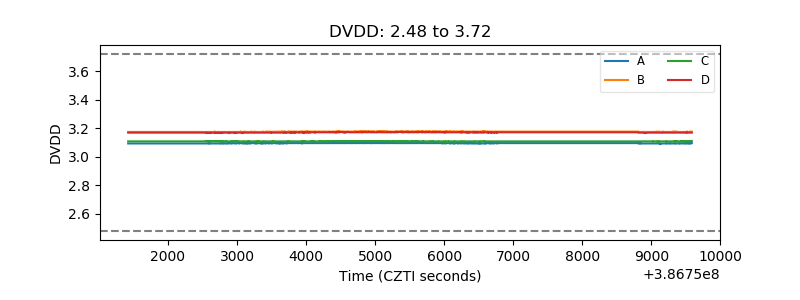 |
| Temperature 1 | 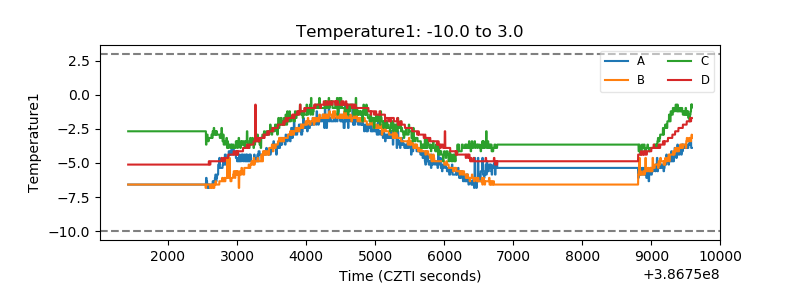 |
| Veto HV Monitor | 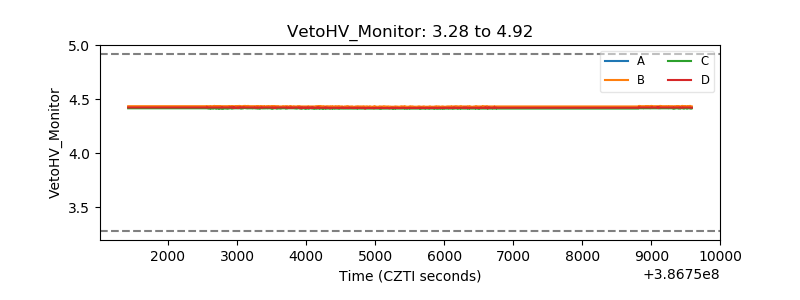 |
| Veto LLD | 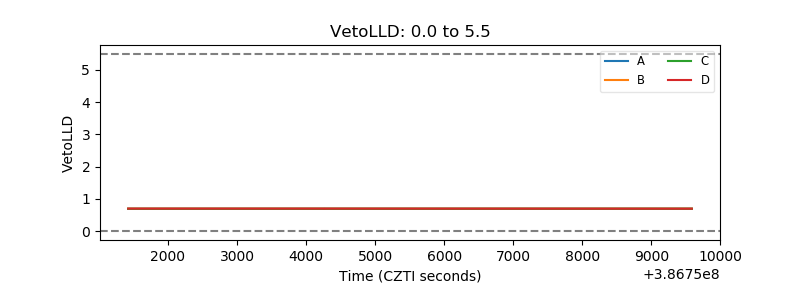 |
| Alpha Counter | 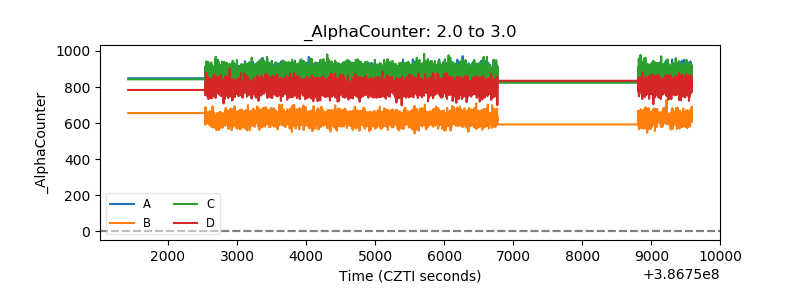 |
| _CPM_Rate | 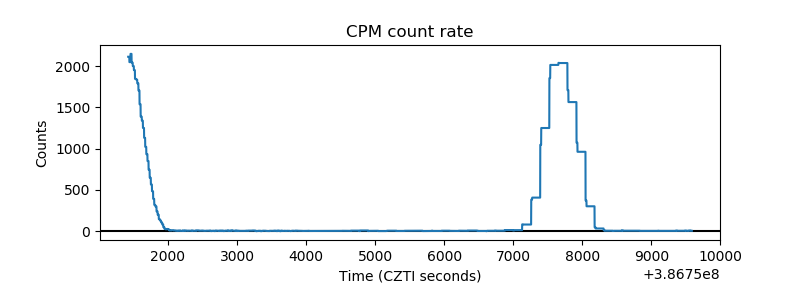 |
| CZT Counter | 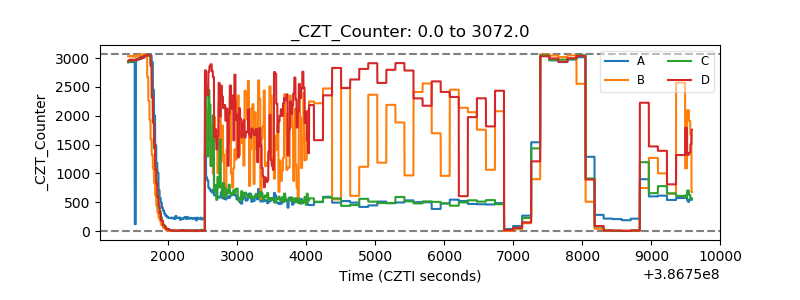 |
| +2.5 Volts monitor | 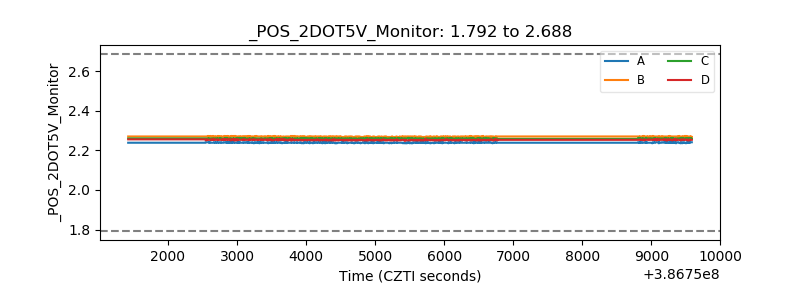 |
| +5 Volts monitor | 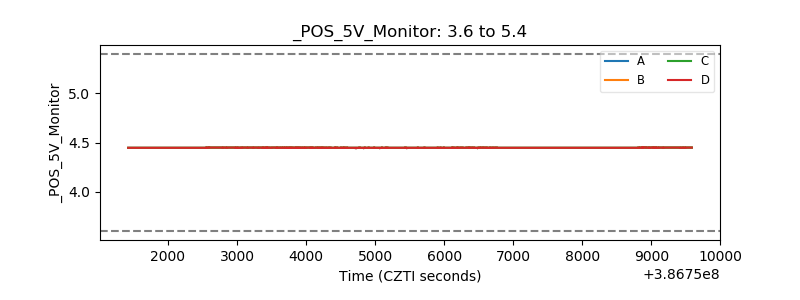 |
| _ROLL_ROT | 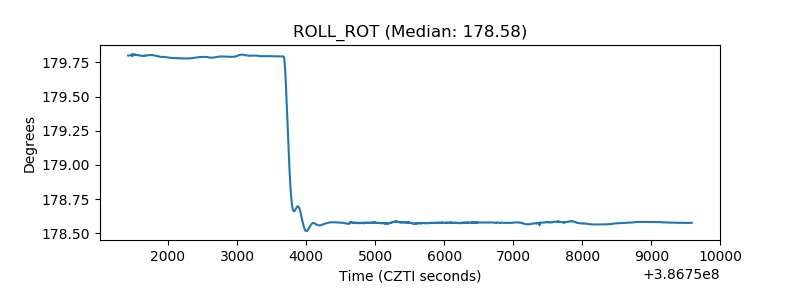 |
| _Roll_DEC | 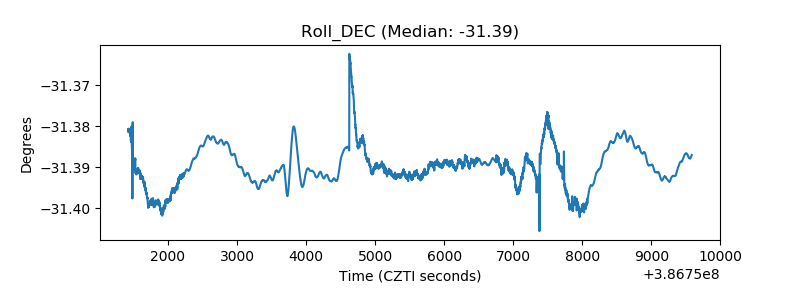 |
| _Roll_RA | 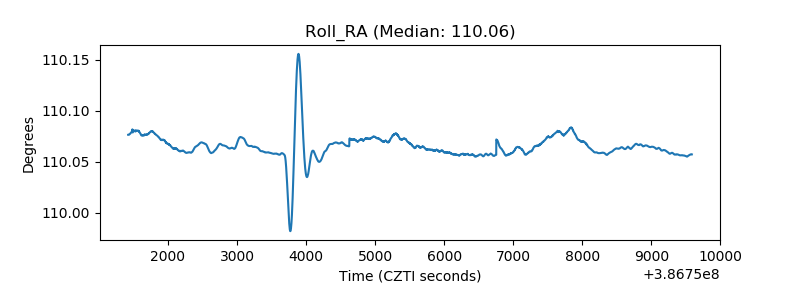 |
| Veto Counter | 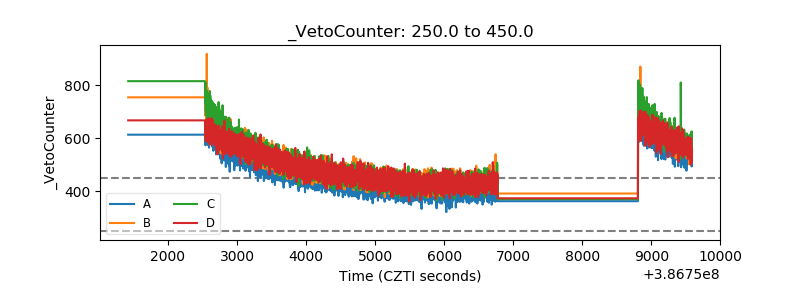 |