| Param | Original file | Final file |
|---|---|---|
| Filename | modeM0/AS1C07_004T01_9000005052_35230cztM0_level2.evt | modeM0/AS1C07_004T01_9000005052_35230cztM0_level2_quad_clean.evt |
| Size (bytes) | 921,683,520 | 51,402,240 |
| Size | 879.0 MB | 49.0 MB |
| Events in quadrant A | 2,747,488 | 373,686 |
| Events in quadrant B | 8,718,862 | 293,393 |
| Events in quadrant C | 3,162,862 | 382,196 |
| Events in quadrant D | 12,920,876 | 126,824 |
| Mode M0 | |||
|---|---|---|---|
| Quadrant | BADHDUFLAG | Total packets | Discarded packets |
| A | 0 | 11402 | 3 |
| B | 0 | 29679 | 2 |
| C | 0 | 12547 | 2 |
| D | 0 | 41949 | 2 |
| Mode SS | |||
|---|---|---|---|
| Quadrant | BADHDUFLAG | Total packets | Discarded packets |
| A | 0 | 110 | 0 |
| B | 0 | 110 | 0 |
| C | 0 | 110 | 0 |
| D | 0 | 110 | 0 |
| Mode M9 | |||
|---|---|---|---|
| Quadrant | BADHDUFLAG | Total packets | Discarded packets |
| A | 0 | 28 | 0 |
| B | 0 | 28 | 0 |
| C | 0 | 28 | 0 |
| D | 0 | 29 | 0 |
| Quadrant | Total seconds | Saturated seconds | Saturation percentage |
|---|---|---|---|
| A | 5398 | 16 | 0.296406% |
| B | 5398 | 2500 | 46.313449% |
| C | 5398 | 151 | 2.797332% |
| D | 5398 | 4193 | 77.676917% |
Noise dominated data is calculated using 1-second bins in cleaned event files. If a bin has >2000 counts, and if more than 50% of those come from <1% of pixels, then it is considered to be noise-dominated and hence unusable.
| Quadrant | # 1 sec bins | Bins with >0 counts | Bins with >2000 counts | High rate bins dominated by noise | Noise dominated (total time) | Noise dominated (detector-on time) | Marked lightcurve |
|---|---|---|---|---|---|---|---|
| A | 7191 | 5399 | 2 | 2 | 0.03% | 0.04% | 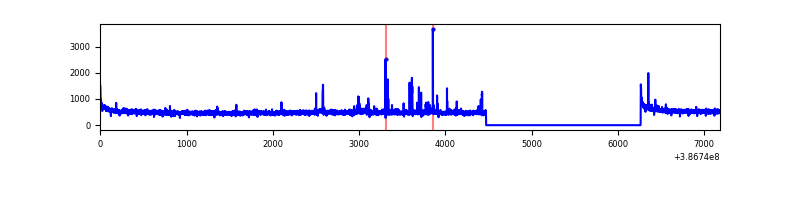 |
| B | 7191 | 5399 | 1758 | 1758 | 24.45% | 32.56% | 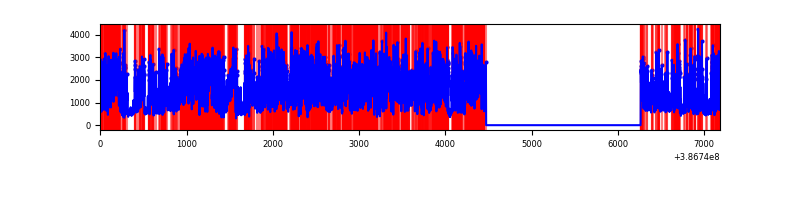 |
| C | 7191 | 5399 | 108 | 108 | 1.50% | 2.00% | 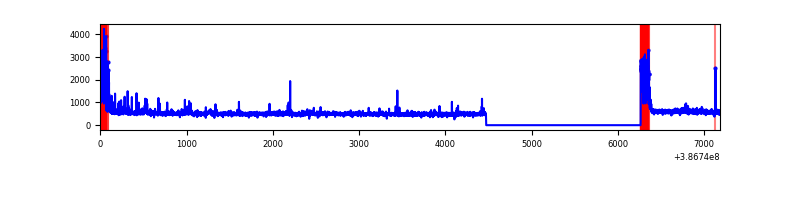 |
| D | 7191 | 5399 | 4025 | 4025 | 55.97% | 74.55% | 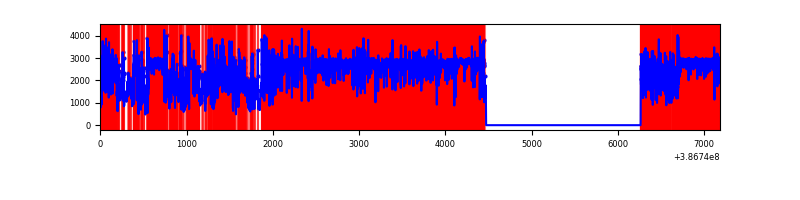 |
Top three noisy pixels from each quadrant. If the there are fewer than three noisy pixels in the level2.evt file, extra rows are filled as -1
| Pixel properties | Quadrant properties | ||||||
|---|---|---|---|---|---|---|---|
| Quadrant | DetID | PixID | Counts | Sigma | Mean | Median | Sigma |
| A | 10 | 83 | 101187 | 768.3 | 652 | 640 | 130.9 |
| A | 9 | 143 | 50477 | 380.82 | 652 | 640 | 130.9 |
| A | 15 | 169 | 43336 | 326.25 | 652 | 640 | 130.9 |
| B | 5 | 236 | 5807225 | 56292.44 | 542 | 529 | 103.2 |
| B | 5 | 172 | 686168 | 6646.86 | 542 | 529 | 103.2 |
| B | 4 | 232 | 71015 | 683.32 | 542 | 529 | 103.2 |
| C | 0 | 10 | 352791 | 2426.91 | 629 | 634 | 145.1 |
| C | 15 | 214 | 227654 | 1564.52 | 629 | 634 | 145.1 |
| C | 12 | 250 | 62178 | 424.13 | 629 | 634 | 145.1 |
| D | 8 | 230 | 6611747 | 77146.53 | 347 | 338 | 85.7 |
| D | 8 | 195 | 2821016 | 32913.64 | 347 | 338 | 85.7 |
| D | 7 | 80 | 979893 | 11430.13 | 347 | 338 | 85.7 |
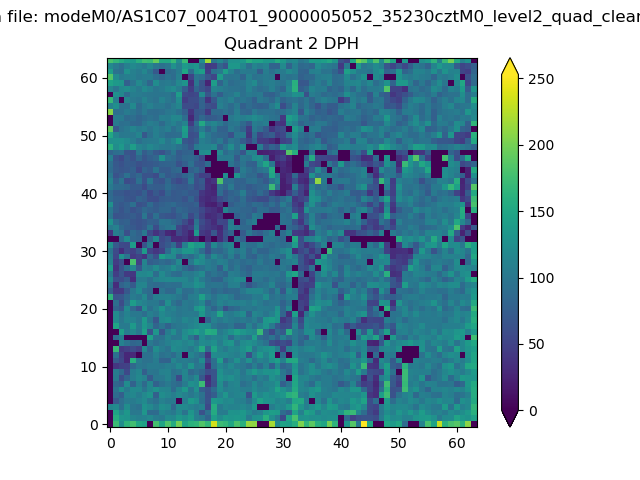
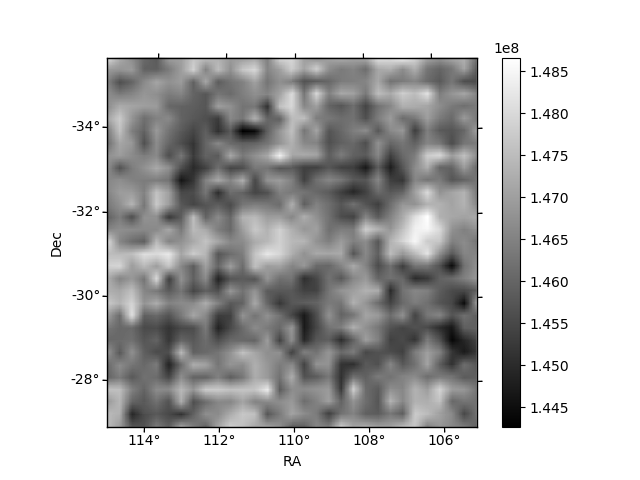
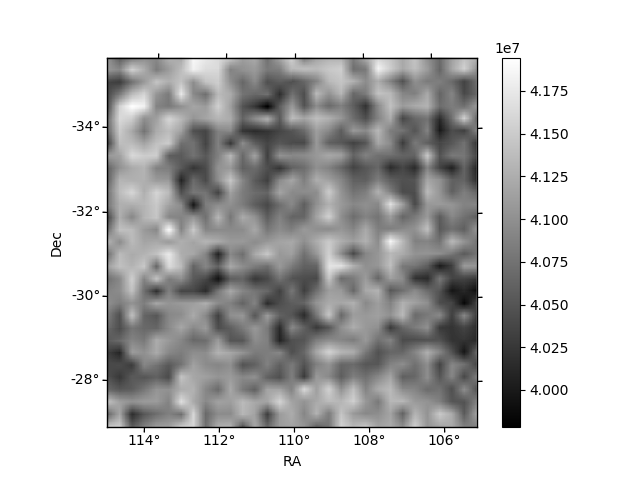
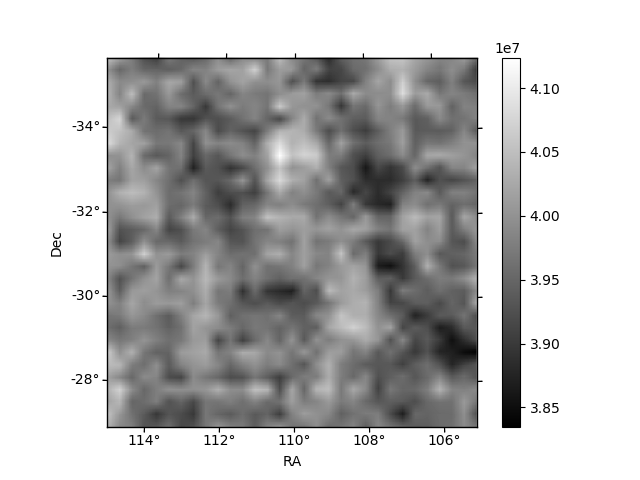
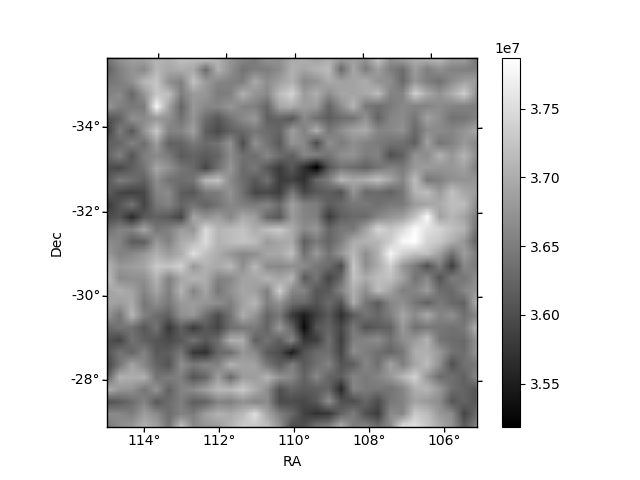
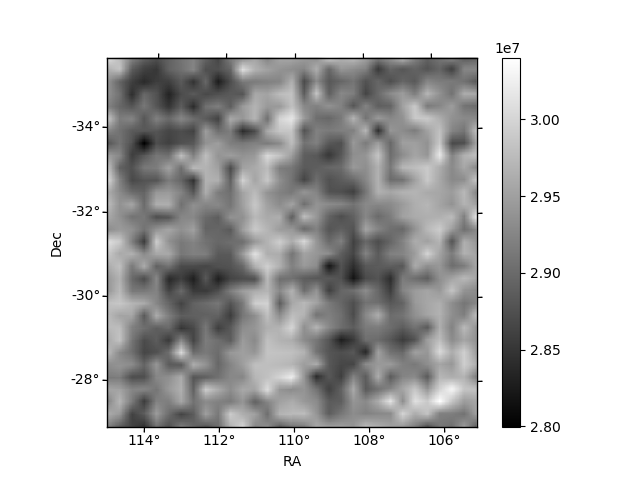
Histogram calculated using DETX and DETY for each event in the final _common_clean file
| Quadrant A | 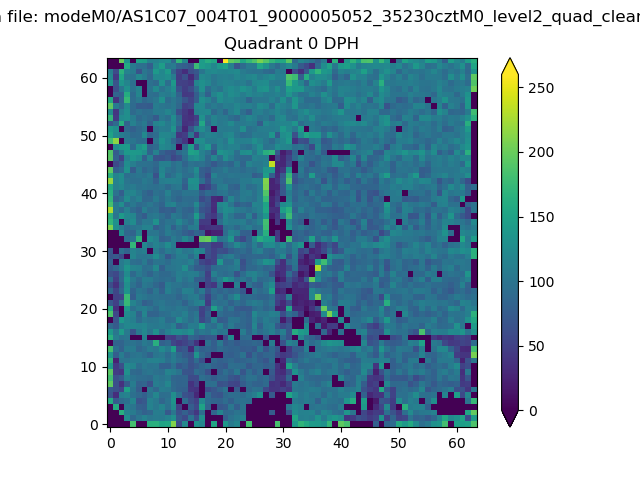 |
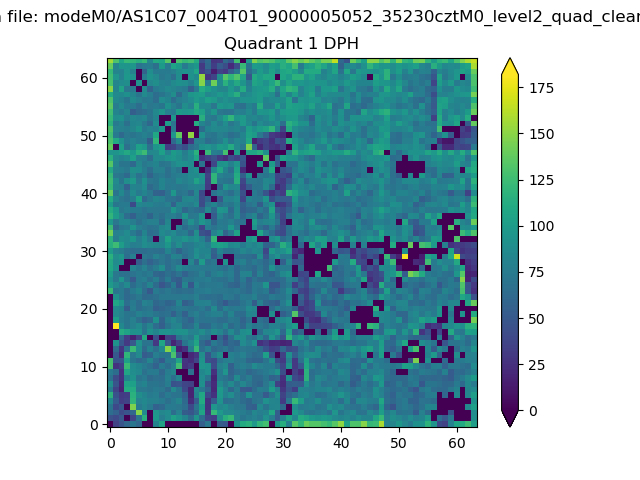 |
Quadrant B |
|---|---|---|---|
| Quadrant D | 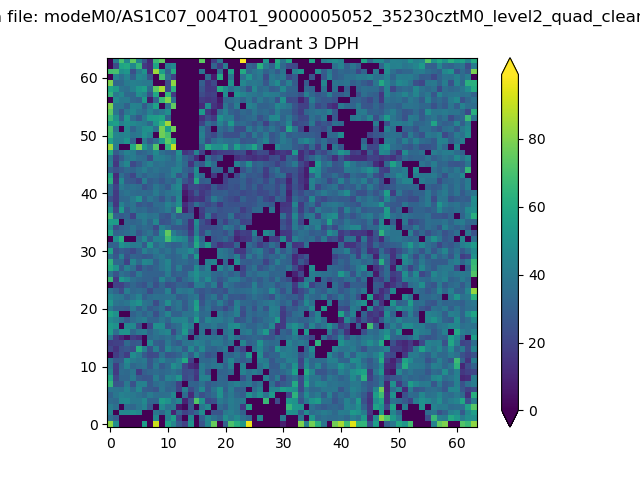 |
 |
Quadrant C |
| Plot type | Count rate plots | Images |
|---|---|---|
| Comparison with Poisson distribution Blue bars denote a histogram of data divided into 1 sec bins. Red curve is a Poisson curve with rate = median count rate of data. |
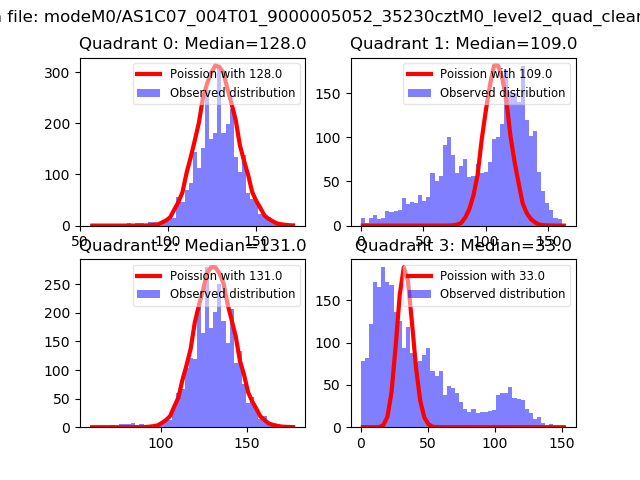 |
 |
| Quadrant-wise count rates Data is divided into 100 sec bins |
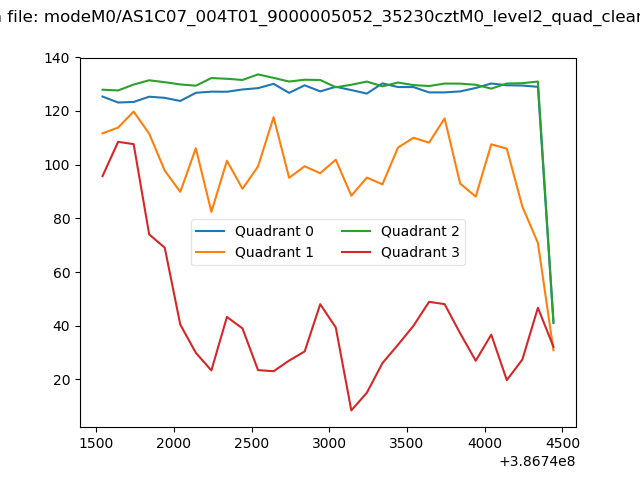 |
|
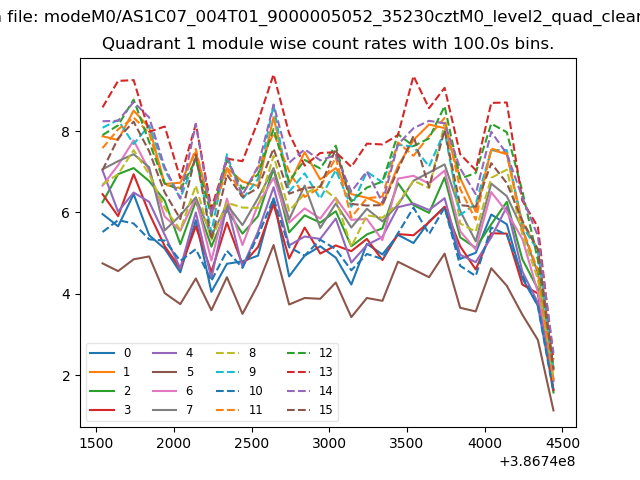
| Module-wise count rates for Quadrant A Data is divided into 100 sec bins |
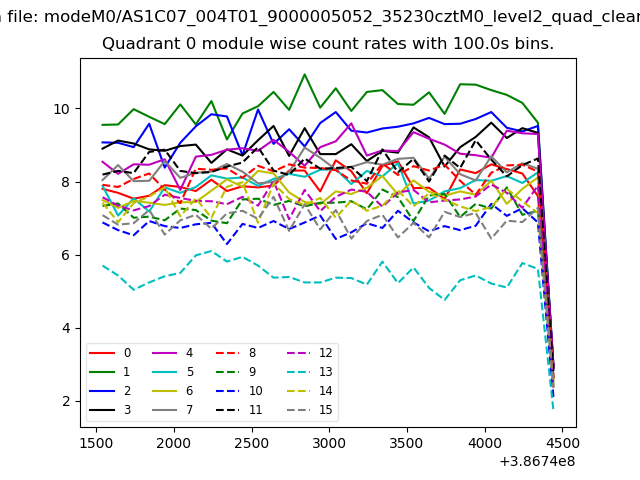 |
 |
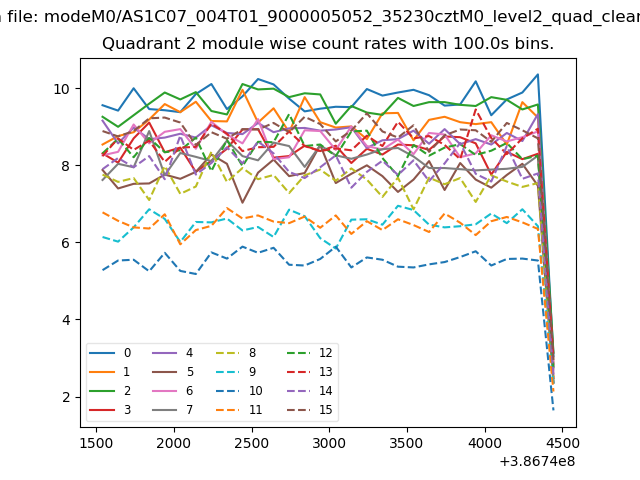
| Module-wise count rates for Quadrant B Data is divided into 100 sec bins |
 |
 |
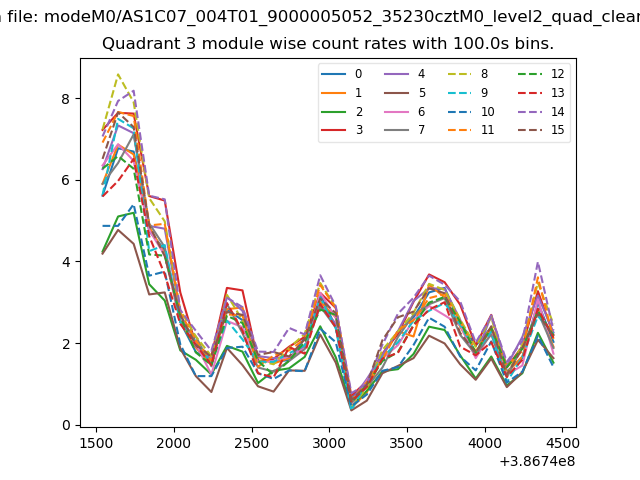
| Module-wise count rates for Quadrant C Data is divided into 100 sec bins |
 |
 |
| Module-wise count rates for Quadrant D Data is divided into 100 sec bins |
 |
 |
| Parameter | Plot |
|---|---|
| CZT HV Monitor | 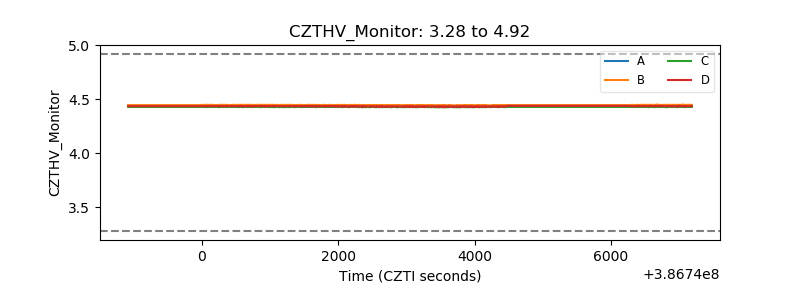 |
| D_VDD | 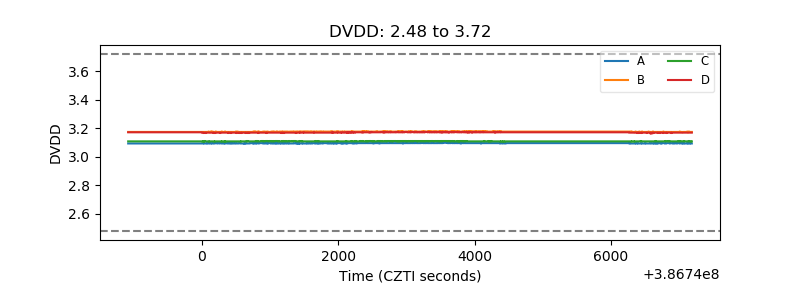 |
| Temperature 1 | 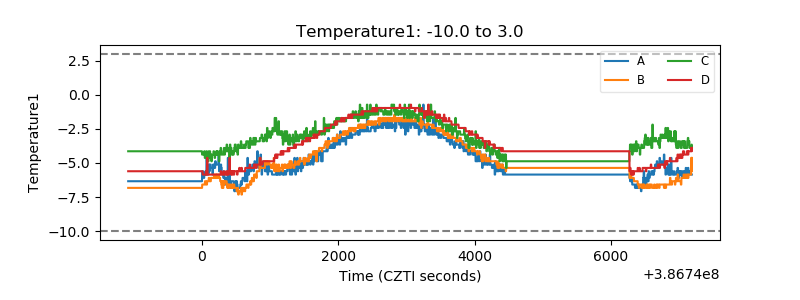 |
| Veto HV Monitor | 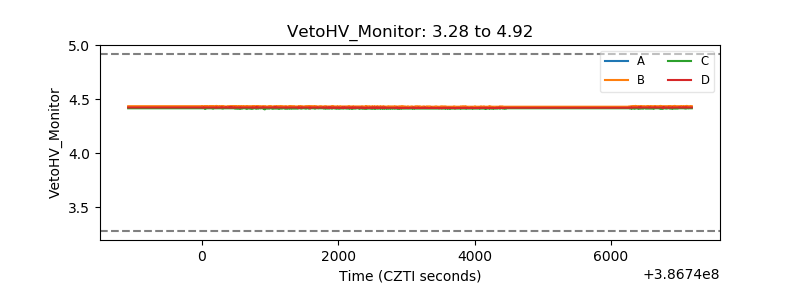 |
| Veto LLD | 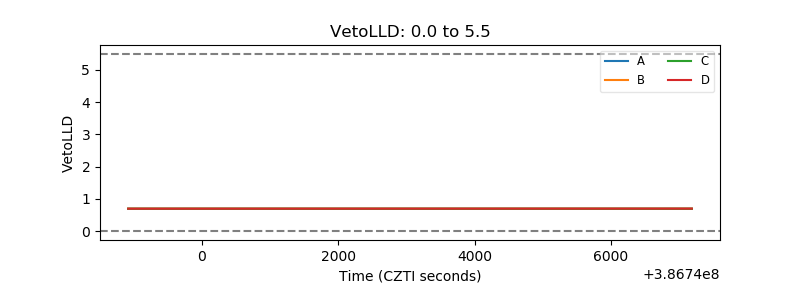 |
| Alpha Counter | 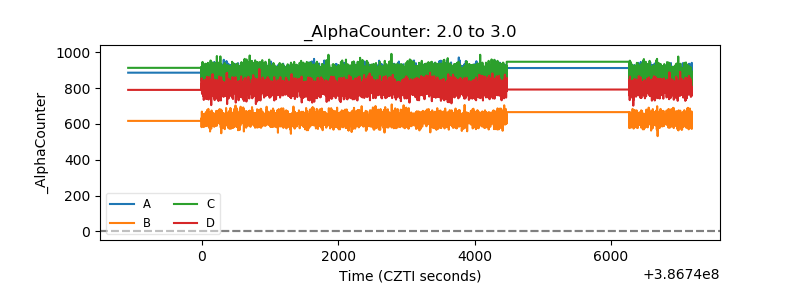 |
| _CPM_Rate | 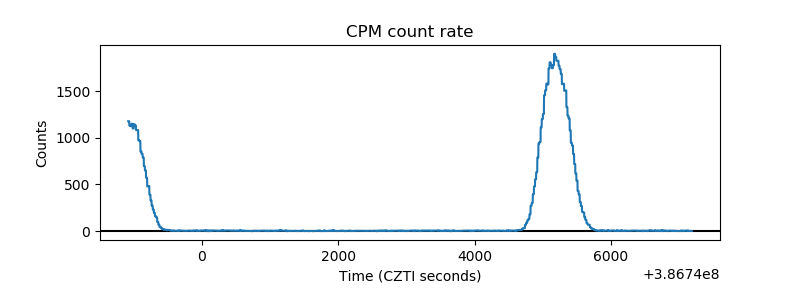 |
| CZT Counter | 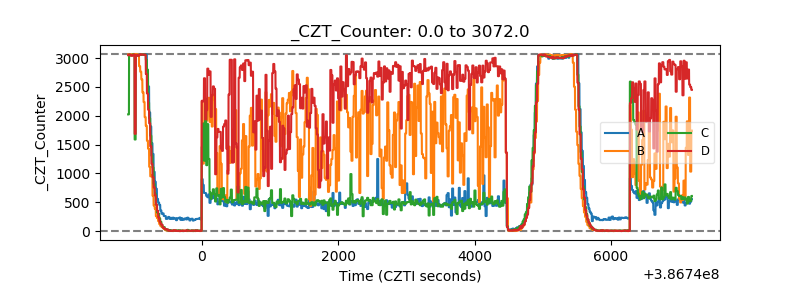 |
| +2.5 Volts monitor | 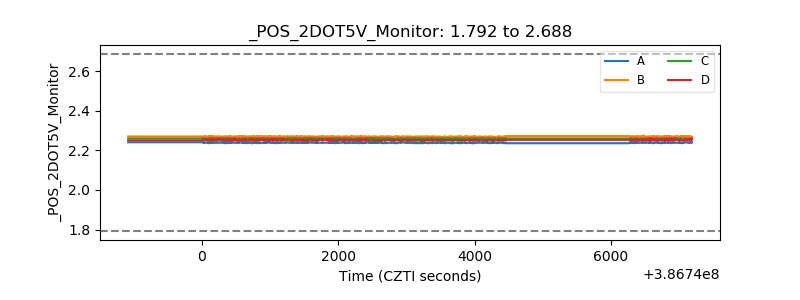 |
| +5 Volts monitor | 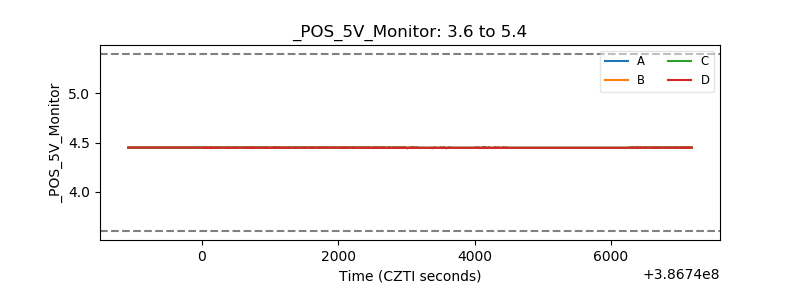 |
| _ROLL_ROT | 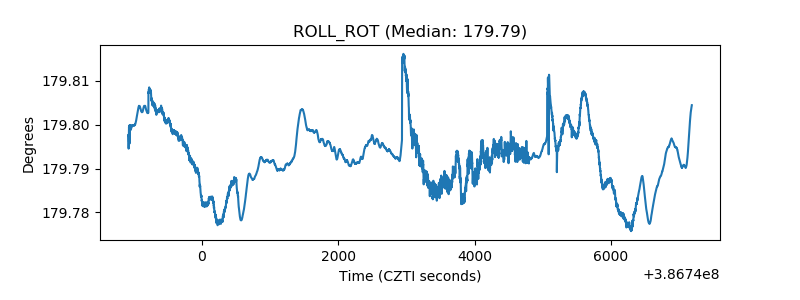 |
| _Roll_DEC | 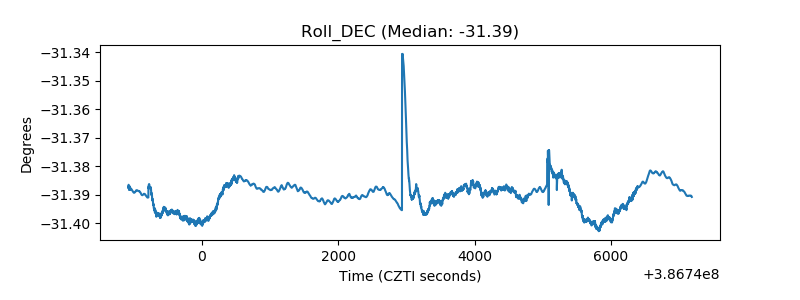 |
| _Roll_RA | 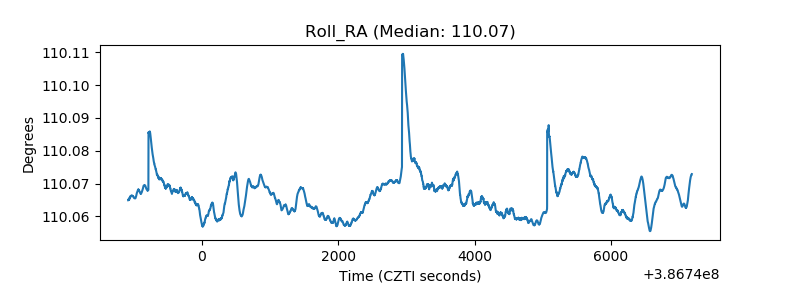 |
| Veto Counter | 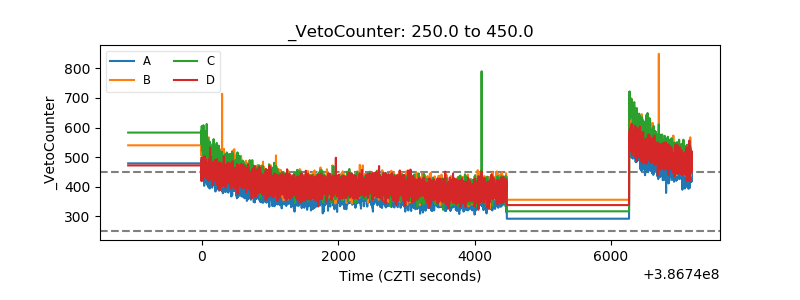 |