| Param | Original file | Final file |
|---|---|---|
| Filename | modeM0/AS1C07_004T01_9000005052_35226cztM0_level2.evt | modeM0/AS1C07_004T01_9000005052_35226cztM0_level2_quad_clean.evt |
| Size (bytes) | 725,509,440 | 55,249,920 |
| Size | 691.9 MB | 52.7 MB |
| Events in quadrant A | 2,372,189 | 372,131 |
| Events in quadrant B | 7,427,782 | 276,591 |
| Events in quadrant C | 2,673,196 | 372,381 |
| Events in quadrant D | 9,158,724 | 296,583 |
| Mode M0 | |||
|---|---|---|---|
| Quadrant | BADHDUFLAG | Total packets | Discarded packets |
| A | 0 | 10311 | 3 |
| B | 0 | 25554 | 2 |
| C | 0 | 10992 | 2 |
| D | 0 | 30708 | 2 |
| Mode SS | |||
|---|---|---|---|
| Quadrant | BADHDUFLAG | Total packets | Discarded packets |
| A | 0 | 104 | 0 |
| B | 0 | 104 | 0 |
| C | 0 | 104 | 0 |
| D | 0 | 104 | 0 |
| Mode M9 | |||
|---|---|---|---|
| Quadrant | BADHDUFLAG | Total packets | Discarded packets |
| A | 0 | 18 | 0 |
| B | 0 | 18 | 0 |
| C | 0 | 18 | 0 |
| D | 0 | 19 | 0 |
| Quadrant | Total seconds | Saturated seconds | Saturation percentage |
|---|---|---|---|
| A | 5039 | 6 | 0.119071% |
| B | 5039 | 2035 | 40.384997% |
| C | 5039 | 43 | 0.853344% |
| D | 5039 | 2037 | 40.424687% |
Noise dominated data is calculated using 1-second bins in cleaned event files. If a bin has >2000 counts, and if more than 50% of those come from <1% of pixels, then it is considered to be noise-dominated and hence unusable.
| Quadrant | # 1 sec bins | Bins with >0 counts | Bins with >2000 counts | High rate bins dominated by noise | Noise dominated (total time) | Noise dominated (detector-on time) | Marked lightcurve |
|---|---|---|---|---|---|---|---|
| A | 6352 | 5040 | 0 | 0 | 0.00% | 0.00% | 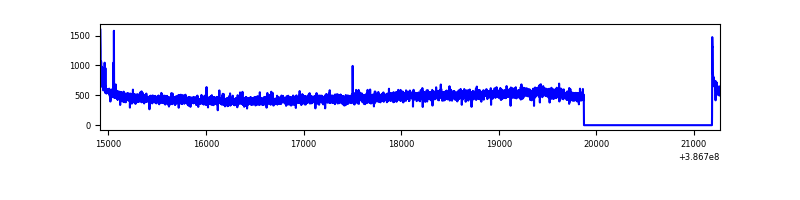 |
| B | 6352 | 5039 | 1417 | 1417 | 22.31% | 28.12% | 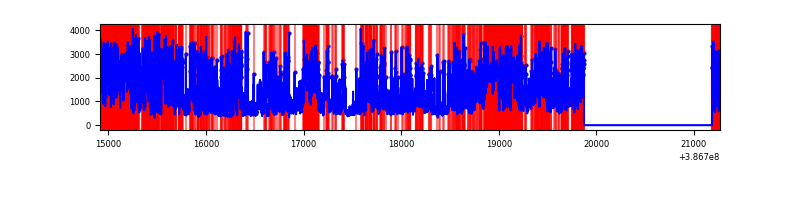 |
| C | 6352 | 5040 | 33 | 33 | 0.52% | 0.65% | 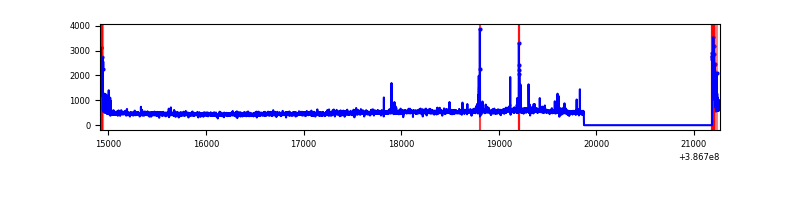 |
| D | 6352 | 5040 | 1962 | 1962 | 30.89% | 38.93% | 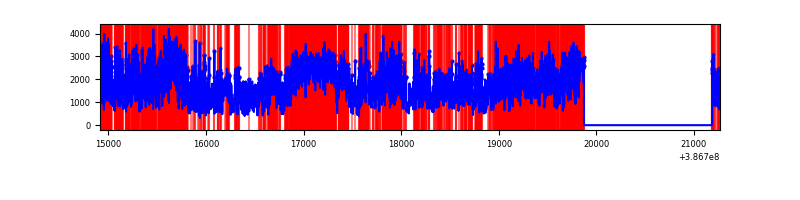 |
Top three noisy pixels from each quadrant. If the there are fewer than three noisy pixels in the level2.evt file, extra rows are filled as -1
| Pixel properties | Quadrant properties | ||||||
|---|---|---|---|---|---|---|---|
| Quadrant | DetID | PixID | Counts | Sigma | Mean | Median | Sigma |
| A | 10 | 83 | 84061 | 707.63 | 586 | 575 | 118.0 |
| A | 13 | 6 | 10844 | 87.04 | 586 | 575 | 118.0 |
| A | 13 | 254 | 7973 | 62.71 | 586 | 575 | 118.0 |
| B | 5 | 236 | 3786965 | 40223.65 | 485 | 471 | 94.1 |
| B | 5 | 172 | 1599049 | 16981.57 | 485 | 471 | 94.1 |
| B | 4 | 232 | 29777 | 311.31 | 485 | 471 | 94.1 |
| C | 15 | 214 | 208396 | 1554.31 | 569 | 574 | 133.7 |
| C | 0 | 10 | 133219 | 992.06 | 569 | 574 | 133.7 |
| C | 1 | 23 | 55866 | 413.53 | 569 | 574 | 133.7 |
| D | 8 | 195 | 4154707 | 33505.59 | 502 | 487 | 124.0 |
| D | 1 | 47 | 1181540 | 9525.71 | 502 | 487 | 124.0 |
| D | 7 | 80 | 887620 | 7155.11 | 502 | 487 | 124.0 |
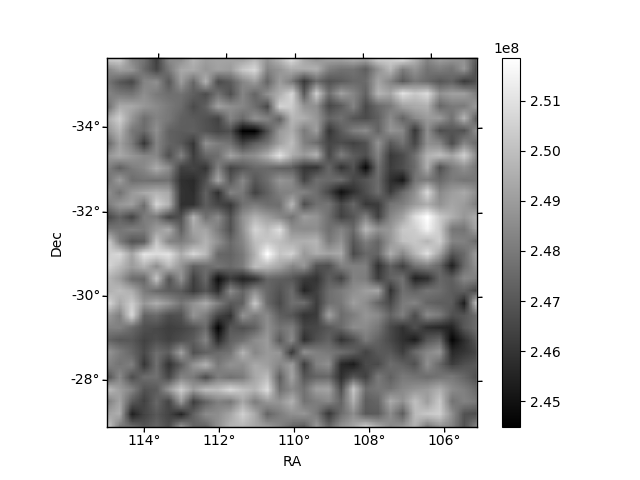
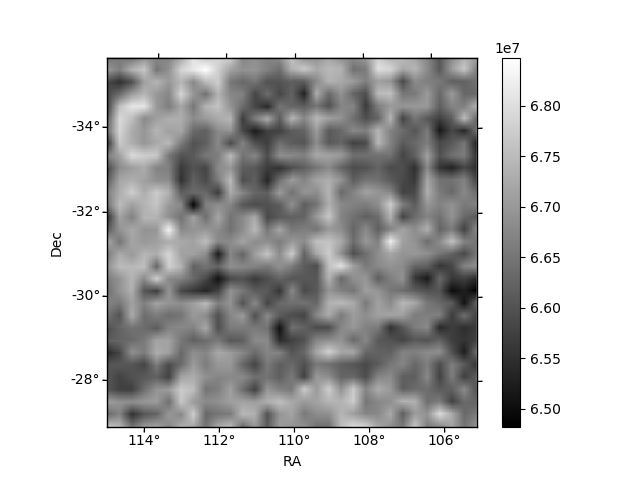
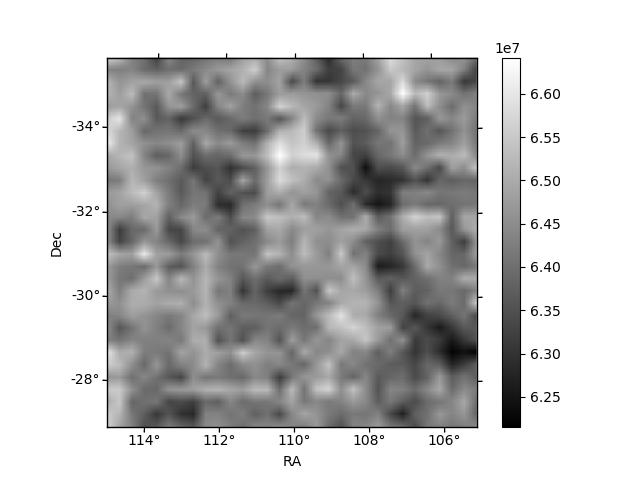
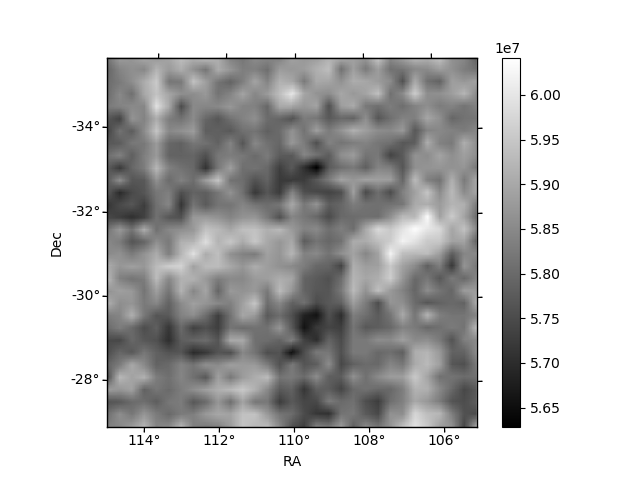
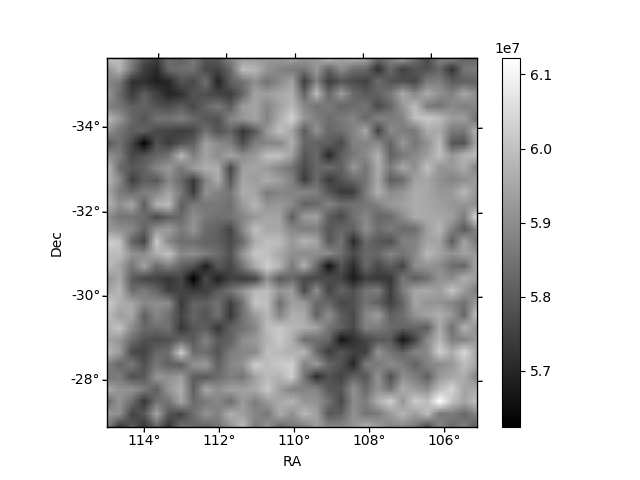
Histogram calculated using DETX and DETY for each event in the final _common_clean file
| Quadrant A | 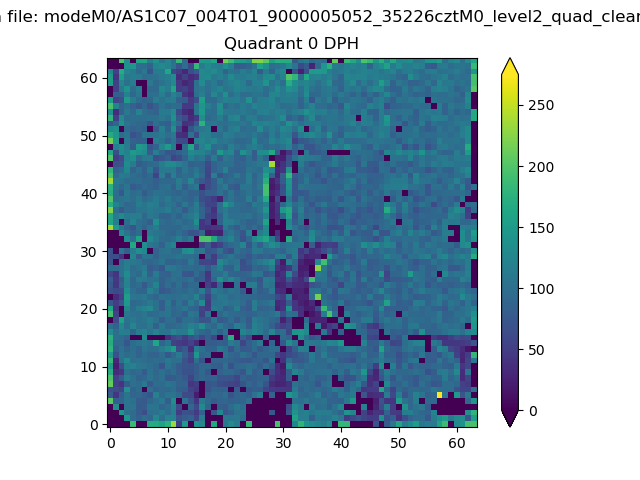 |
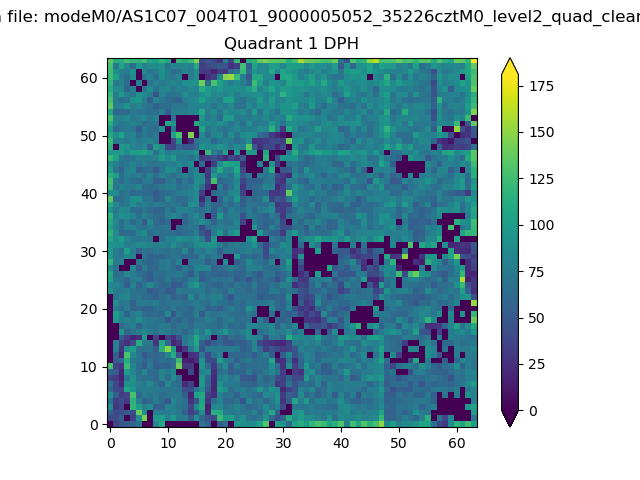 |
Quadrant B |
|---|---|---|---|
| Quadrant D | 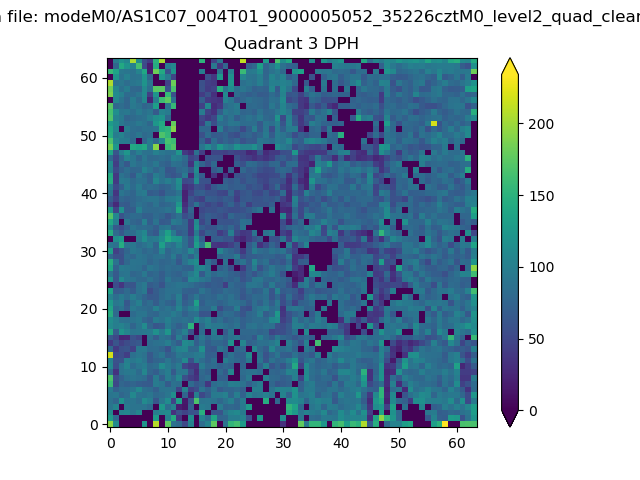 |
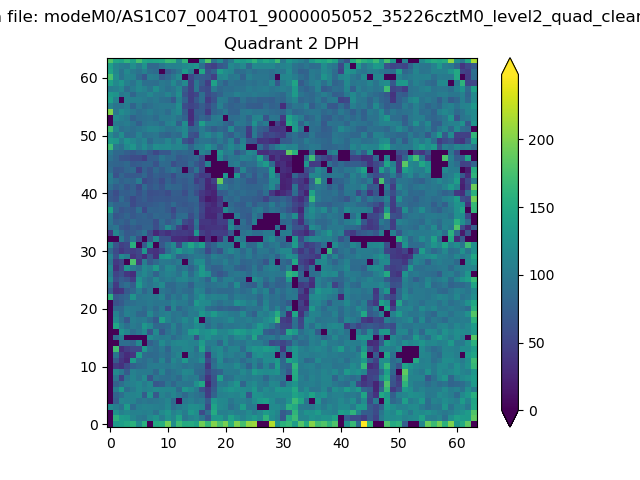 |
Quadrant C |
| Plot type | Count rate plots | Images |
|---|---|---|
| Comparison with Poisson distribution Blue bars denote a histogram of data divided into 1 sec bins. Red curve is a Poisson curve with rate = median count rate of data. |
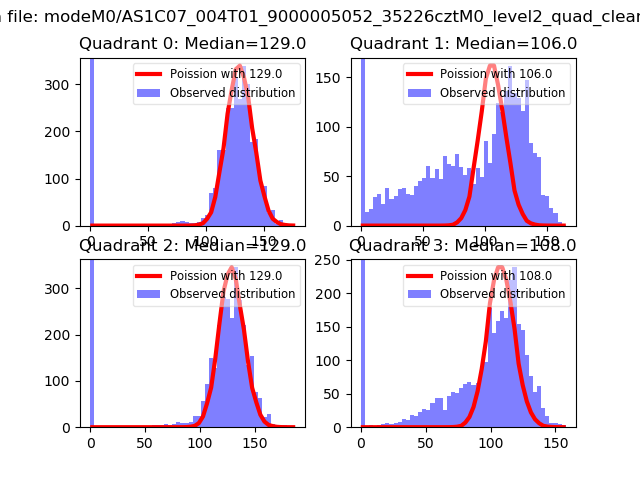 |
 |
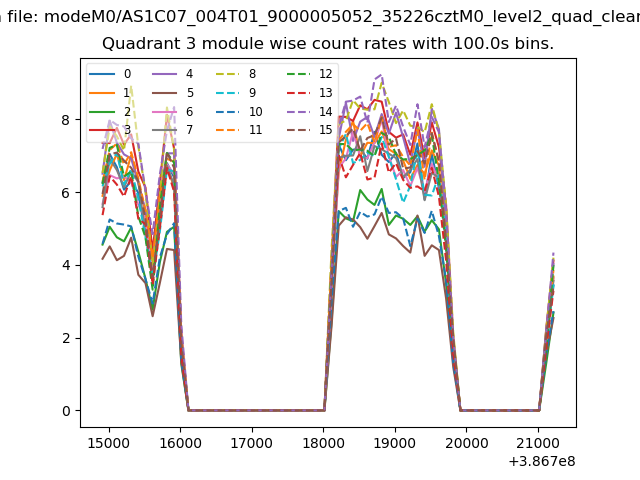
| Quadrant-wise count rates Data is divided into 100 sec bins |
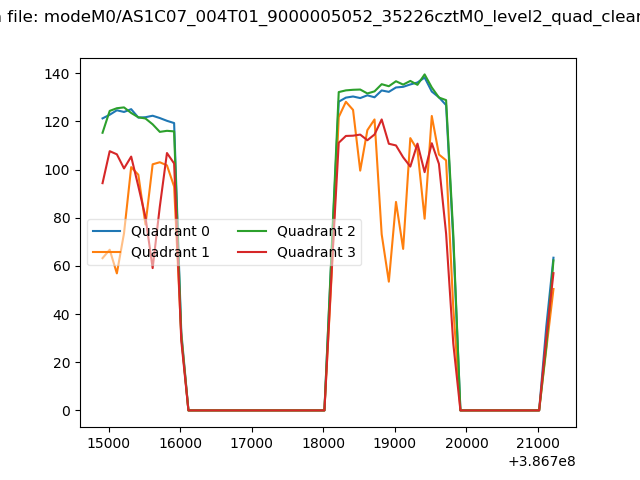 |
|
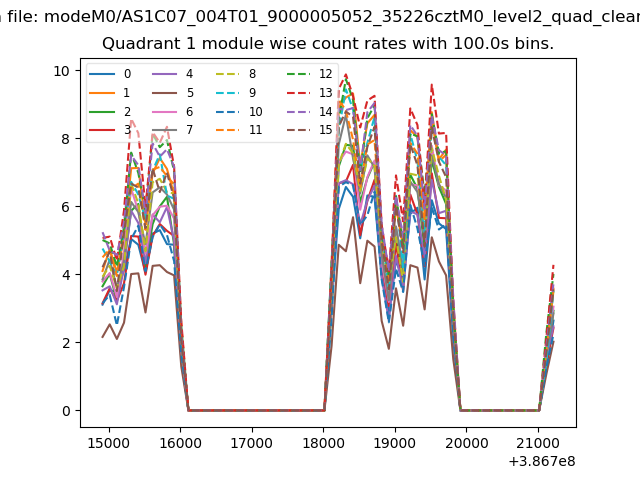
| Module-wise count rates for Quadrant A Data is divided into 100 sec bins |
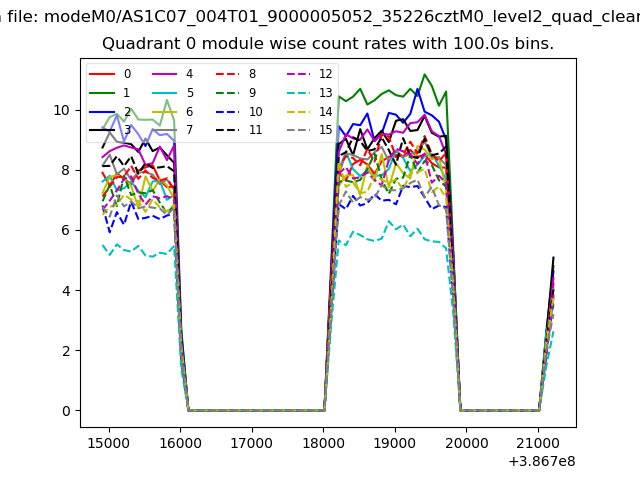 |
 |
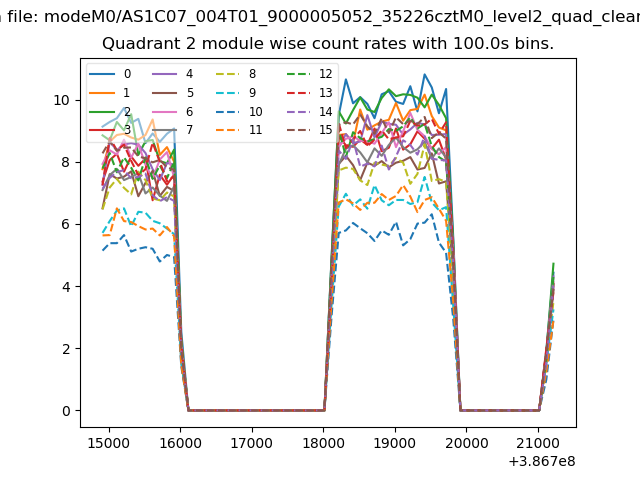
| Module-wise count rates for Quadrant B Data is divided into 100 sec bins |
 |
 |
| Module-wise count rates for Quadrant C Data is divided into 100 sec bins |
 |
 |
| Module-wise count rates for Quadrant D Data is divided into 100 sec bins |
 |
 |
| Parameter | Plot |
|---|---|
| CZT HV Monitor | 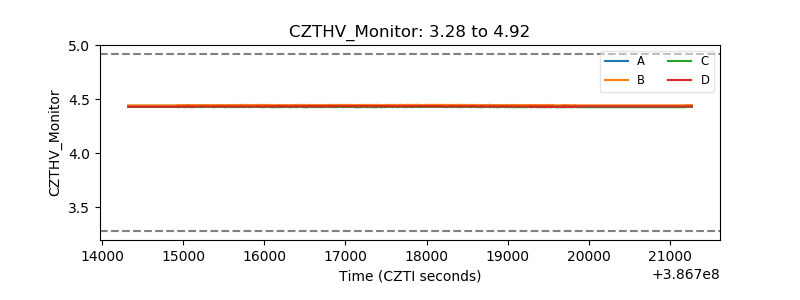 |
| D_VDD | 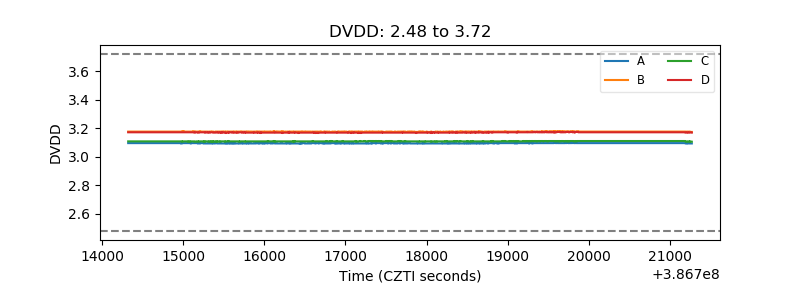 |
| Temperature 1 | 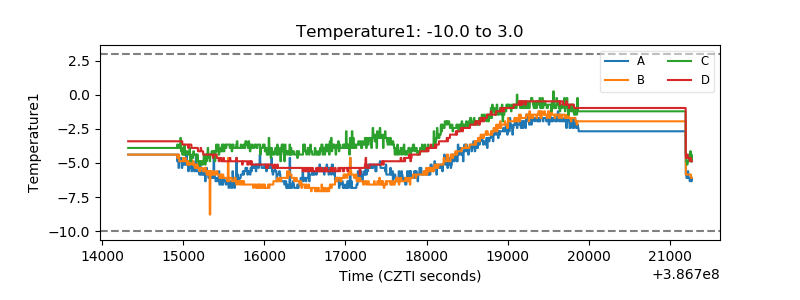 |
| Veto HV Monitor | 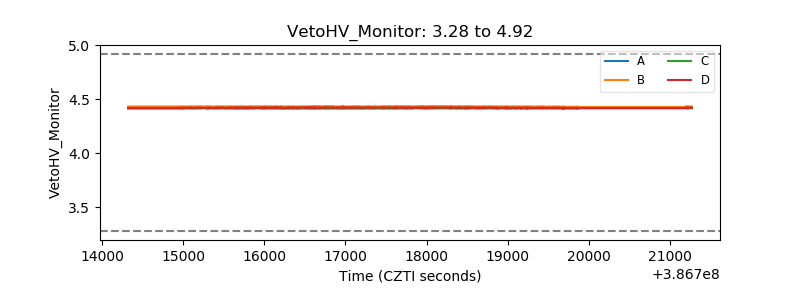 |
| Veto LLD | 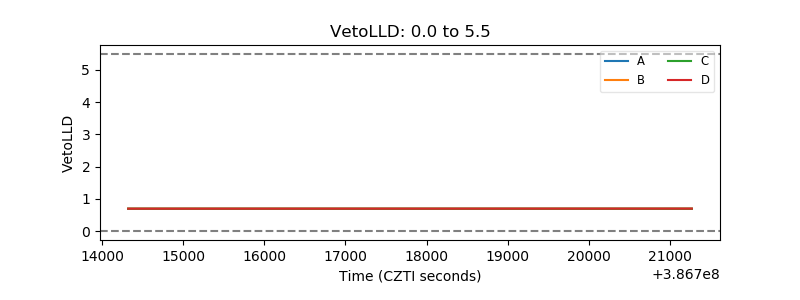 |
| Alpha Counter | 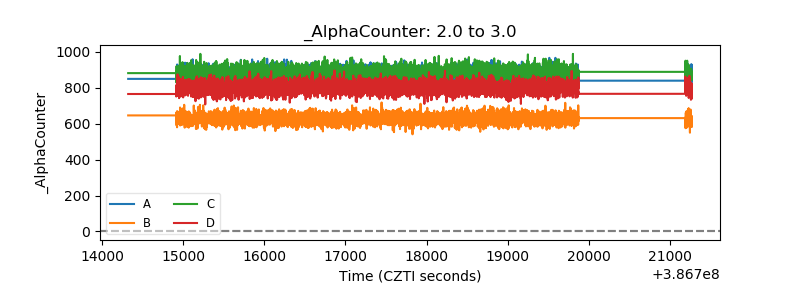 |
| _CPM_Rate | 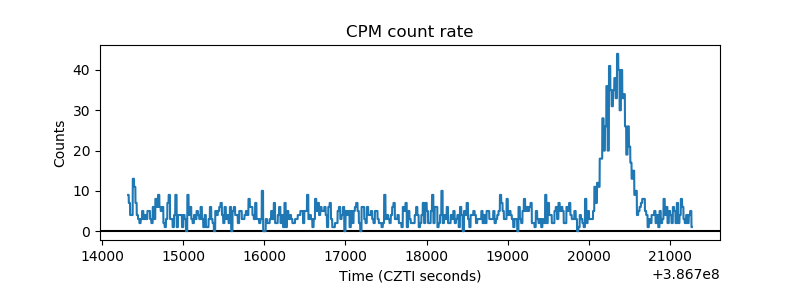 |
| CZT Counter | 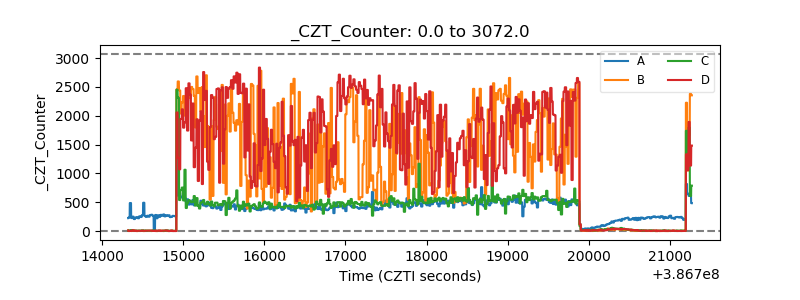 |
| +2.5 Volts monitor | 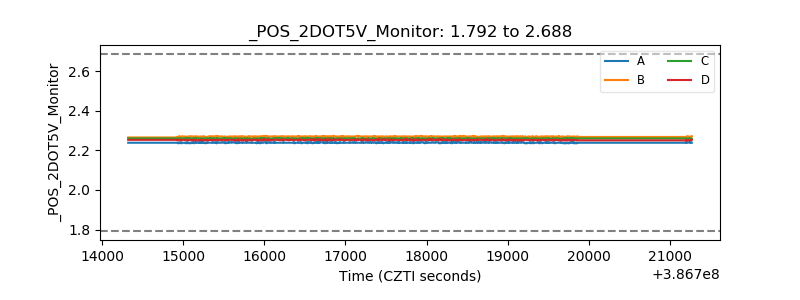 |
| +5 Volts monitor | 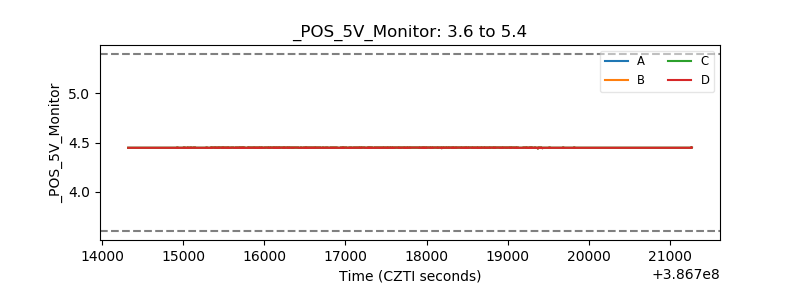 |
| _ROLL_ROT | 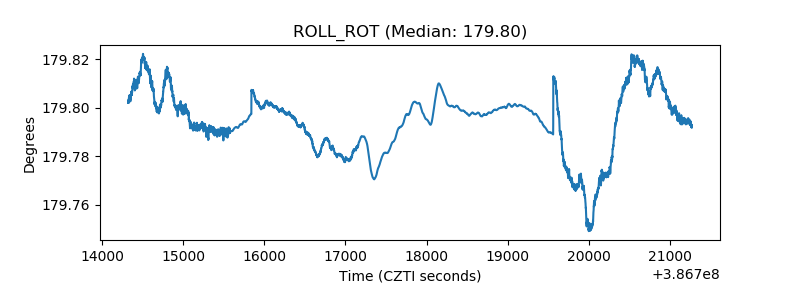 |
| _Roll_DEC | 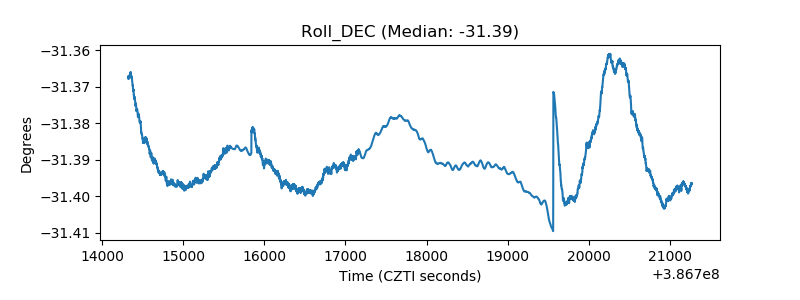 |
| _Roll_RA | 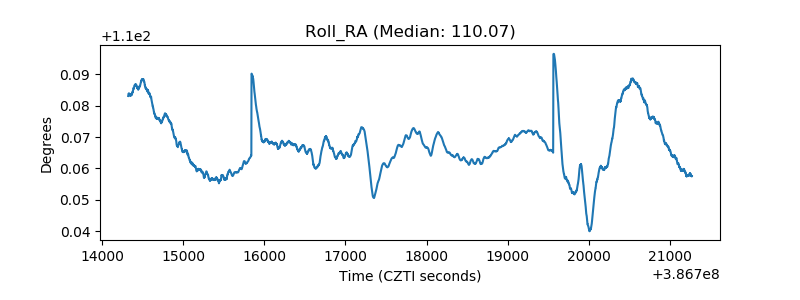 |
| Veto Counter | 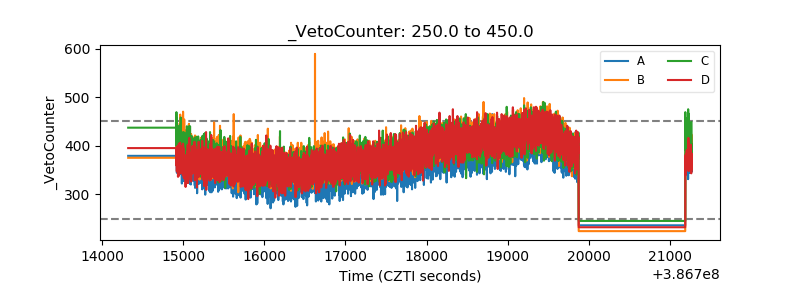 |