| Param | Original file | Final file |
|---|---|---|
| Filename | modeM0/AS1C07_004T01_9000005052_35219cztM0_level2.evt | modeM0/AS1C07_004T01_9000005052_35219cztM0_level2_quad_clean.evt |
| Size (bytes) | 651,516,480 | 96,526,080 |
| Size | 621.3 MB | 92.1 MB |
| Events in quadrant A | 2,695,148 | 697,627 |
| Events in quadrant B | 7,756,933 | 565,950 |
| Events in quadrant C | 3,150,541 | 681,979 |
| Events in quadrant D | 5,791,704 | 626,543 |
| Mode M0 | |||
|---|---|---|---|
| Quadrant | BADHDUFLAG | Total packets | Discarded packets |
| A | 0 | 10971 | 3 |
| B | 0 | 26555 | 2 |
| C | 0 | 12444 | 2 |
| D | 0 | 20726 | 2 |
| Mode SS | |||
|---|---|---|---|
| Quadrant | BADHDUFLAG | Total packets | Discarded packets |
| A | 0 | 102 | 0 |
| B | 0 | 102 | 0 |
| C | 0 | 102 | 0 |
| D | 0 | 102 | 0 |
| Mode M9 | |||
|---|---|---|---|
| Quadrant | BADHDUFLAG | Total packets | Discarded packets |
| A | 0 | 33 | 0 |
| B | 0 | 33 | 0 |
| C | 0 | 33 | 0 |
| D | 0 | 34 | 0 |
| Quadrant | Total seconds | Saturated seconds | Saturation percentage |
|---|---|---|---|
| A | 4995 | 7 | 0.140140% |
| B | 4995 | 1963 | 39.299299% |
| C | 4995 | 111 | 2.222222% |
| D | 4995 | 415 | 8.308308% |
Noise dominated data is calculated using 1-second bins in cleaned event files. If a bin has >2000 counts, and if more than 50% of those come from <1% of pixels, then it is considered to be noise-dominated and hence unusable.
| Quadrant | # 1 sec bins | Bins with >0 counts | Bins with >2000 counts | High rate bins dominated by noise | Noise dominated (total time) | Noise dominated (detector-on time) | Marked lightcurve |
|---|---|---|---|---|---|---|---|
| A | 7118 | 4996 | 0 | 0 | 0.00% | 0.00% | 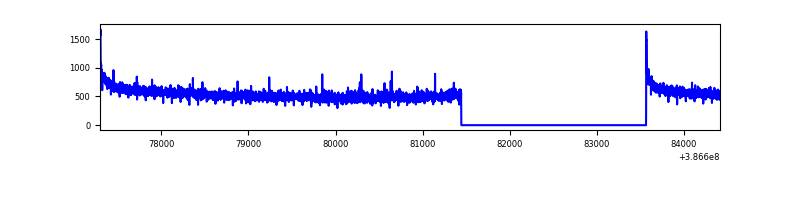 |
| B | 7117 | 4995 | 1418 | 1418 | 19.92% | 28.39% | 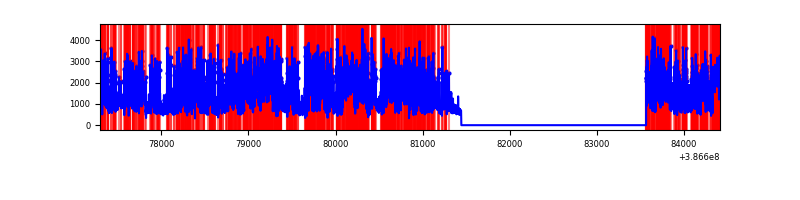 |
| C | 7118 | 4996 | 74 | 74 | 1.04% | 1.48% | 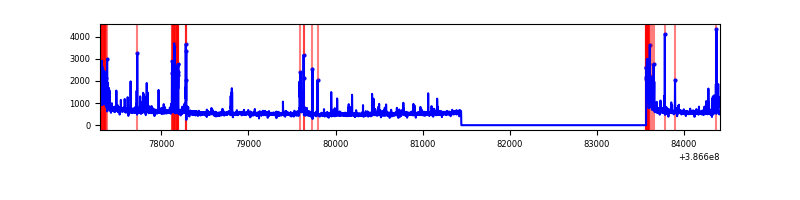 |
| D | 7118 | 4996 | 505 | 505 | 7.09% | 10.11% | 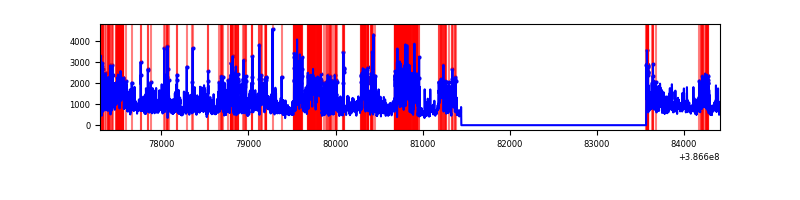 |
Top three noisy pixels from each quadrant. If the there are fewer than three noisy pixels in the level2.evt file, extra rows are filled as -1
| Pixel properties | Quadrant properties | ||||||
|---|---|---|---|---|---|---|---|
| Quadrant | DetID | PixID | Counts | Sigma | Mean | Median | Sigma |
| A | 10 | 83 | 99083 | 754.77 | 656 | 646 | 130.4 |
| A | 8 | 144 | 34271 | 257.82 | 656 | 646 | 130.4 |
| A | 13 | 6 | 15944 | 117.3 | 656 | 646 | 130.4 |
| B | 5 | 236 | 5324601 | 51885.68 | 546 | 536 | 102.6 |
| B | 5 | 172 | 191076 | 1856.91 | 546 | 536 | 102.6 |
| B | 4 | 232 | 36006 | 345.67 | 546 | 536 | 102.6 |
| C | 0 | 10 | 241476 | 1716.15 | 619 | 626 | 140.3 |
| C | 15 | 214 | 211170 | 1500.21 | 619 | 626 | 140.3 |
| C | 0 | 207 | 172980 | 1228.09 | 619 | 626 | 140.3 |
| D | 8 | 195 | 2575013 | 17119.34 | 618 | 603 | 150.4 |
| D | 13 | 249 | 261647 | 1735.89 | 618 | 603 | 150.4 |
| D | 10 | 118 | 133908 | 886.45 | 618 | 603 | 150.4 |
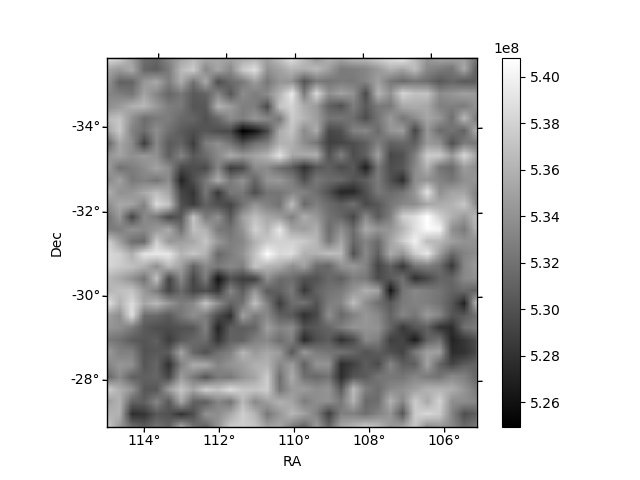
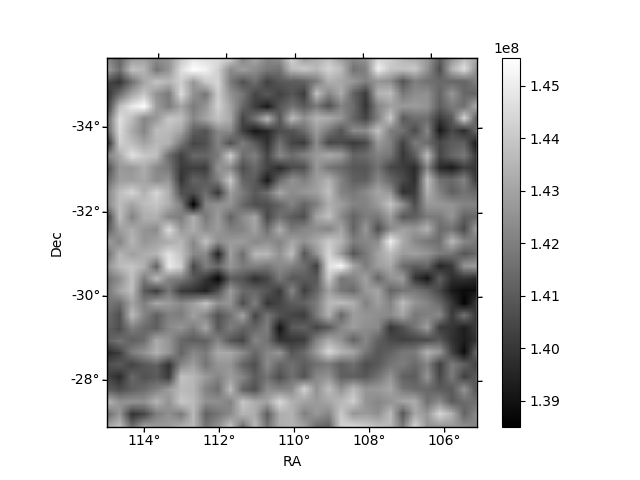
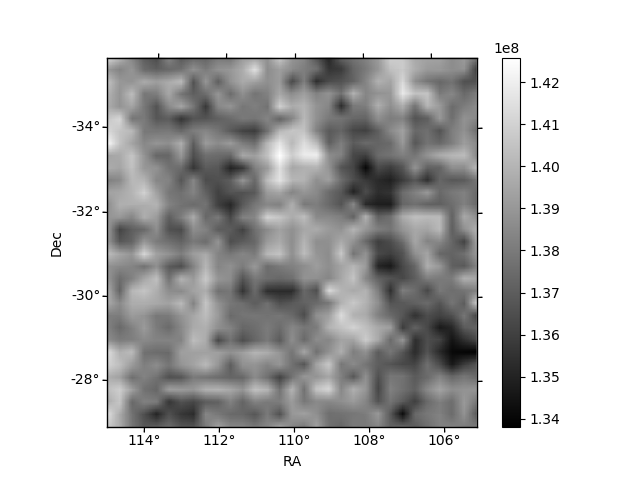
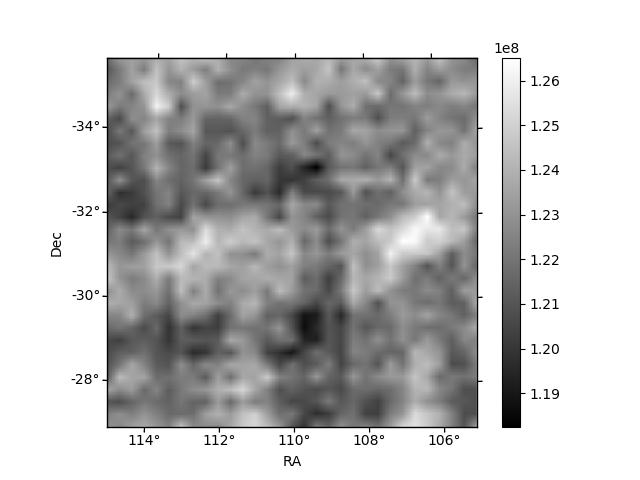
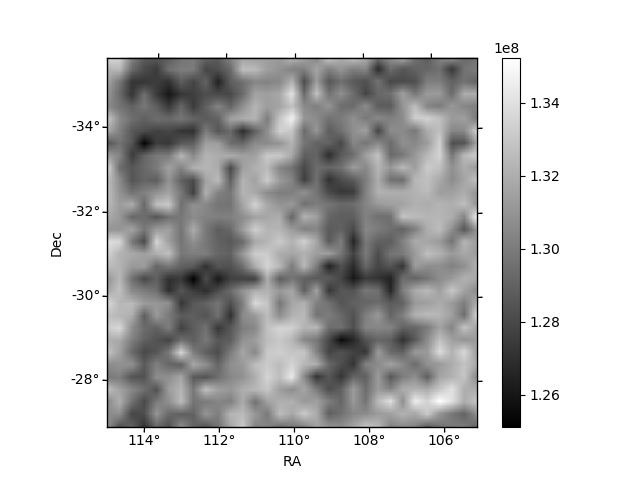
Histogram calculated using DETX and DETY for each event in the final _common_clean file
| Quadrant A | 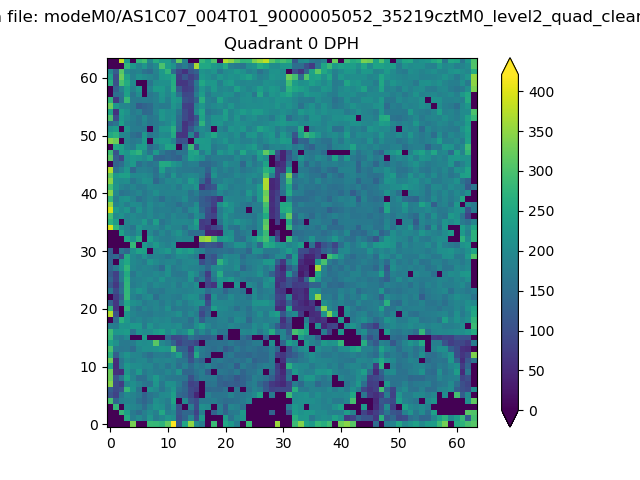 |
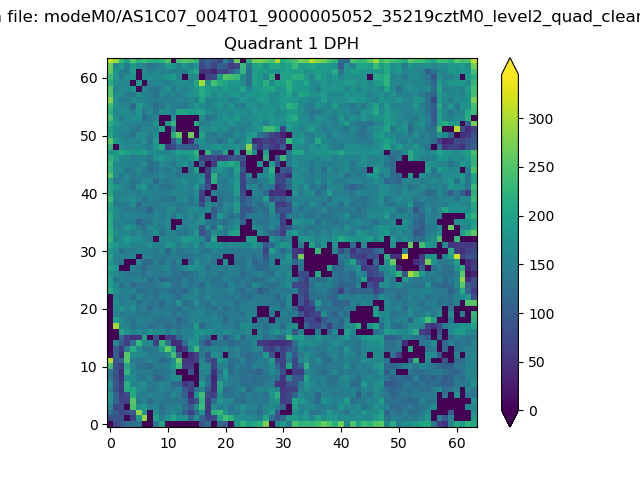 |
Quadrant B |
|---|---|---|---|
| Quadrant D | 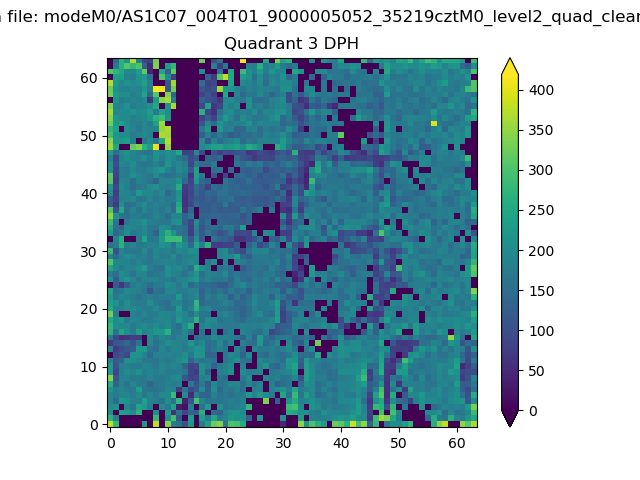 |
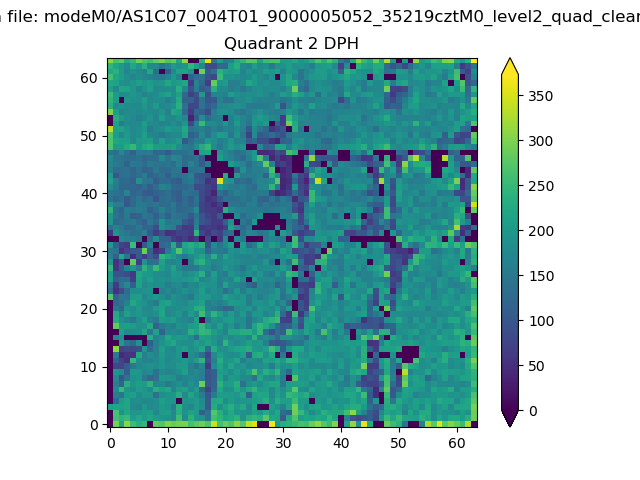 |
Quadrant C |
| Plot type | Count rate plots | Images |
|---|---|---|
| Comparison with Poisson distribution Blue bars denote a histogram of data divided into 1 sec bins. Red curve is a Poisson curve with rate = median count rate of data. |
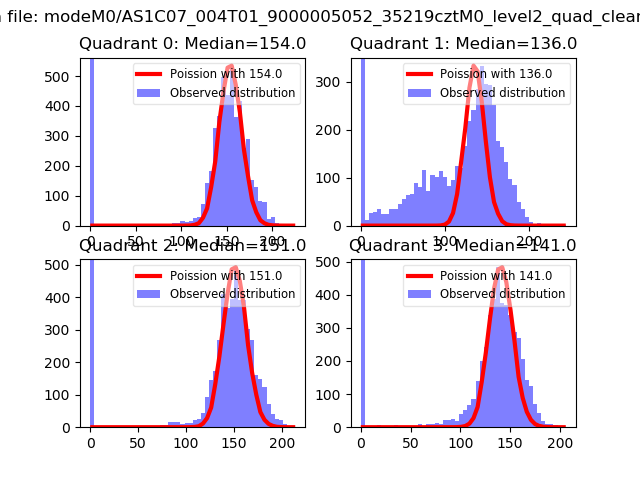 |
 |
| Quadrant-wise count rates Data is divided into 100 sec bins |
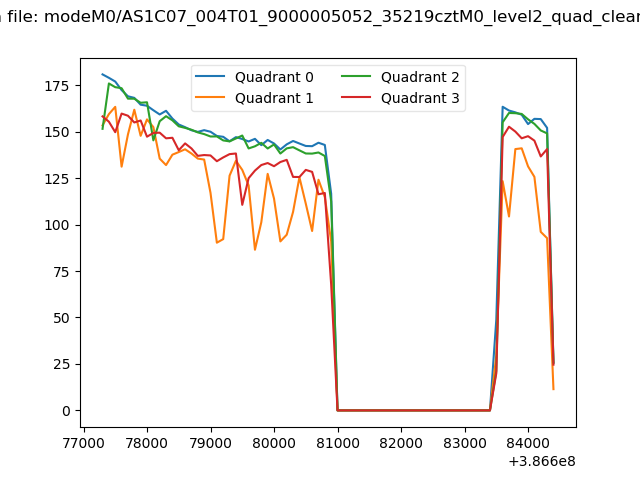 |
|
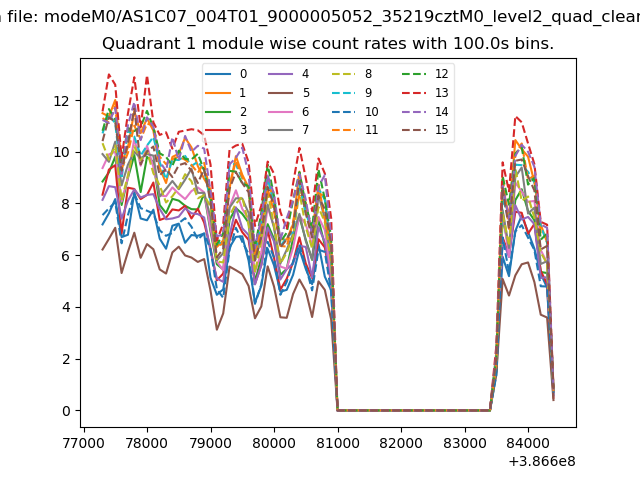
| Module-wise count rates for Quadrant A Data is divided into 100 sec bins |
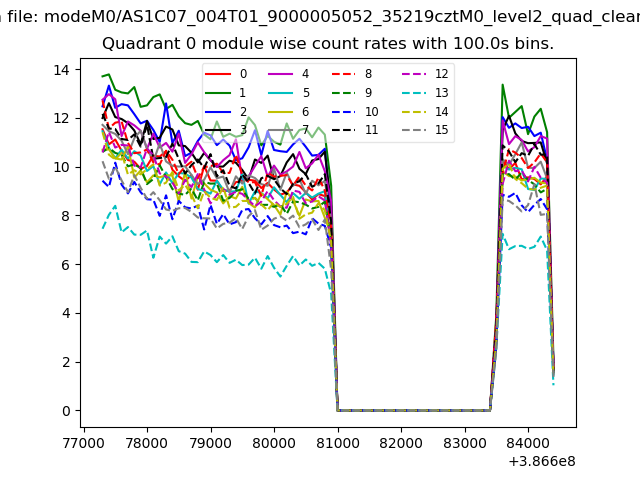 |
 |
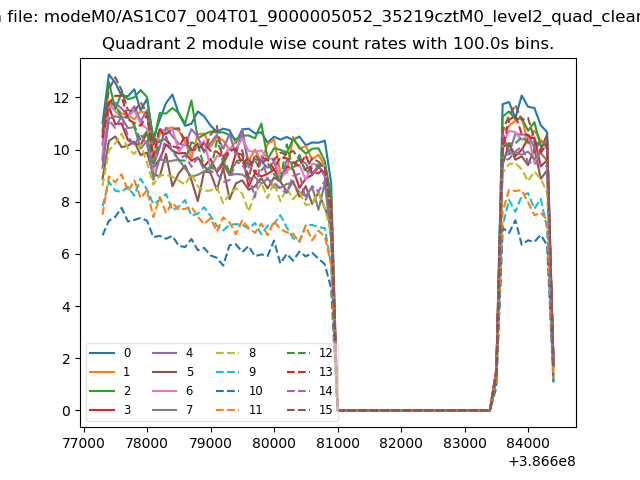
| Module-wise count rates for Quadrant B Data is divided into 100 sec bins |
 |
 |
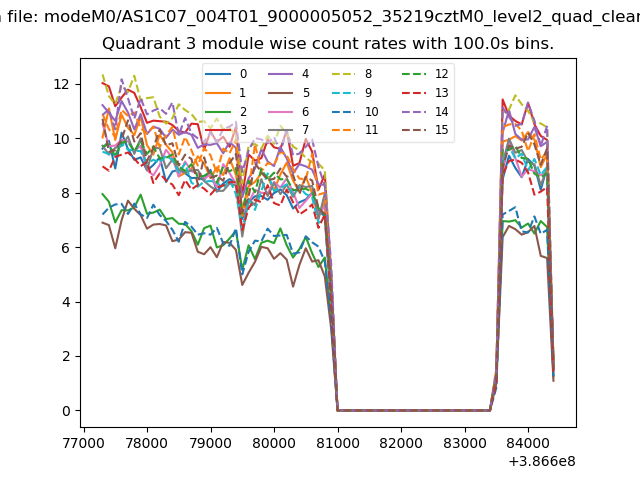
| Module-wise count rates for Quadrant C Data is divided into 100 sec bins |
 |
 |
| Module-wise count rates for Quadrant D Data is divided into 100 sec bins |
 |
 |
| Parameter | Plot |
|---|---|
| CZT HV Monitor | 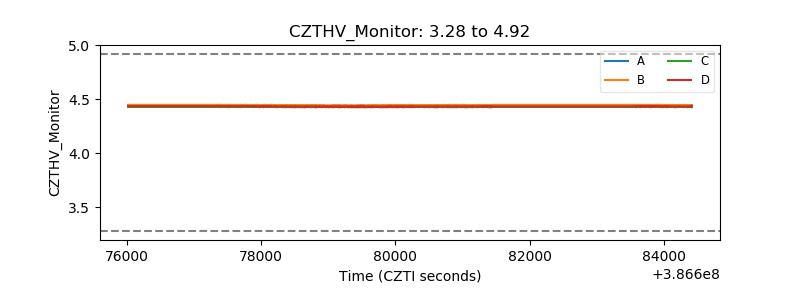 |
| D_VDD |  |
| Temperature 1 | 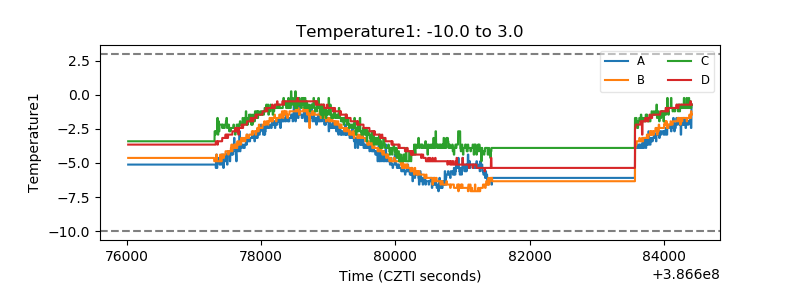 |
| Veto HV Monitor | 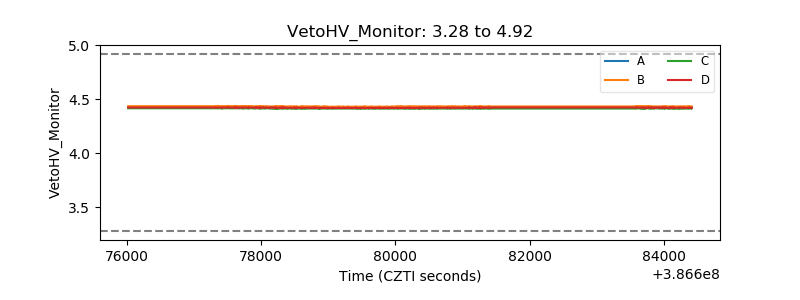 |
| Veto LLD | 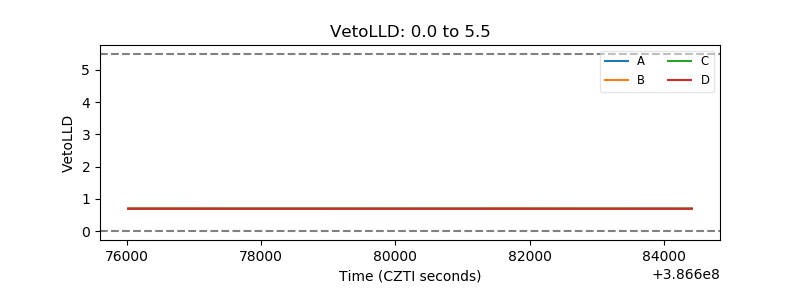 |
| Alpha Counter | 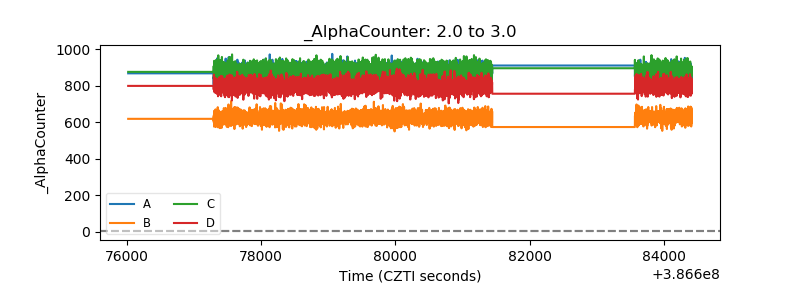 |
| _CPM_Rate | 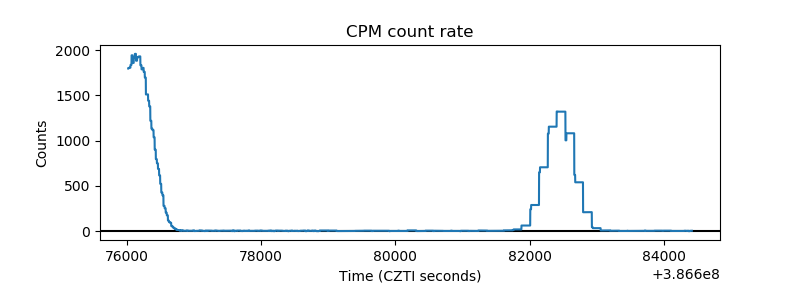 |
| CZT Counter | 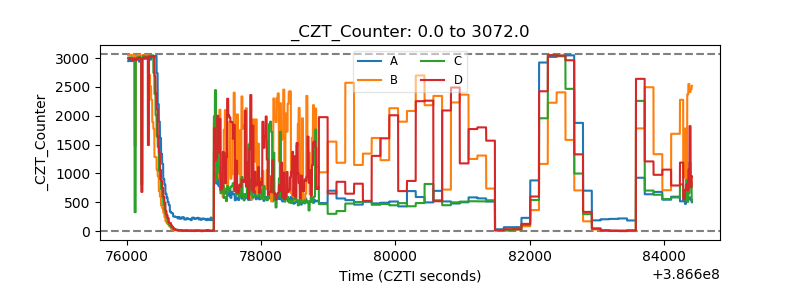 |
| +2.5 Volts monitor | 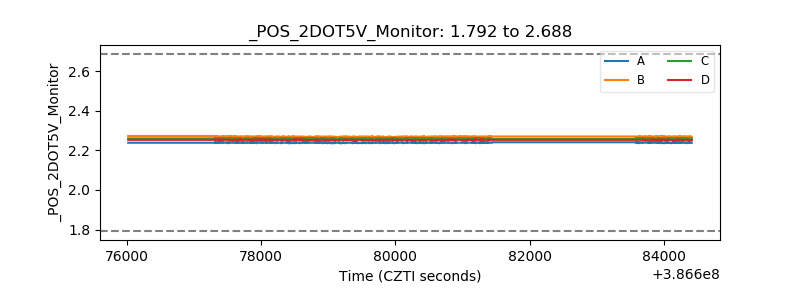 |
| +5 Volts monitor | 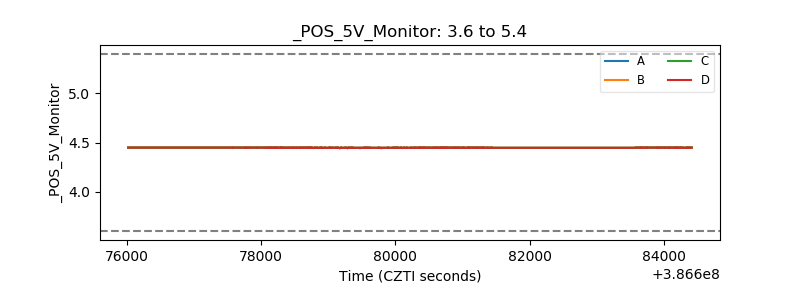 |
| _ROLL_ROT | 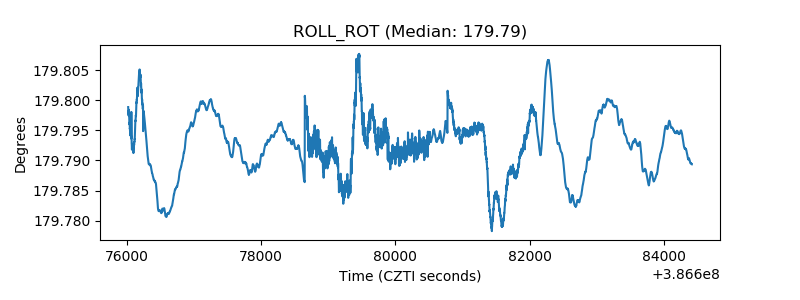 |
| _Roll_DEC | 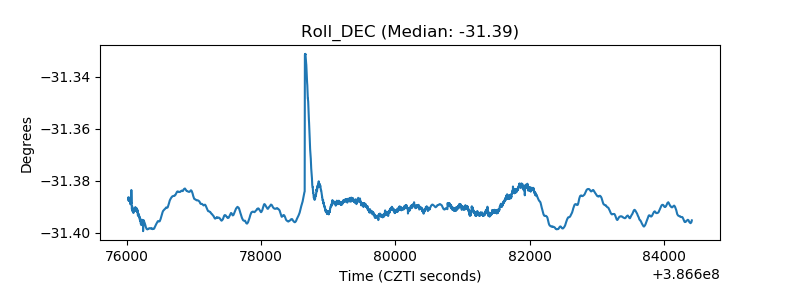 |
| _Roll_RA | 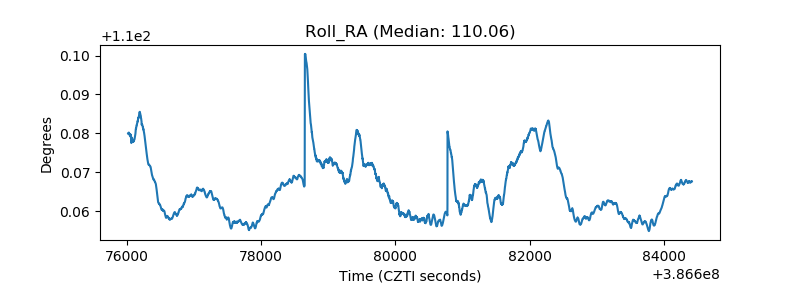 |
| Veto Counter | 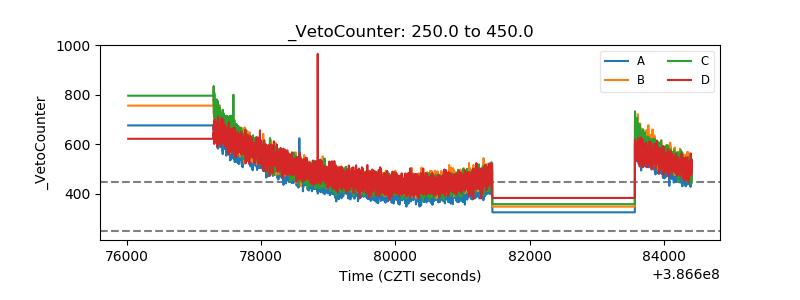 |