| Param | Original file | Final file |
|---|---|---|
| Filename | modeM0/AS1C07_004T01_9000005052_35218cztM0_level2.evt | modeM0/AS1C07_004T01_9000005052_35218cztM0_level2_quad_clean.evt |
| Size (bytes) | 634,959,360 | 98,533,440 |
| Size | 605.5 MB | 94.0 MB |
| Events in quadrant A | 3,275,981 | 689,785 |
| Events in quadrant B | 7,132,372 | 600,951 |
| Events in quadrant C | 2,978,861 | 698,777 |
| Events in quadrant D | 5,506,788 | 644,926 |
| Mode M0 | |||
|---|---|---|---|
| Quadrant | BADHDUFLAG | Total packets | Discarded packets |
| A | 0 | 12826 | 3 |
| B | 0 | 24699 | 2 |
| C | 0 | 11997 | 2 |
| D | 0 | 19971 | 2 |
| Mode SS | |||
|---|---|---|---|
| Quadrant | BADHDUFLAG | Total packets | Discarded packets |
| A | 0 | 104 | 0 |
| B | 0 | 104 | 0 |
| C | 0 | 104 | 0 |
| D | 0 | 104 | 0 |
| Mode M9 | |||
|---|---|---|---|
| Quadrant | BADHDUFLAG | Total packets | Discarded packets |
| A | 0 | 20 | 0 |
| B | 0 | 20 | 0 |
| C | 0 | 20 | 0 |
| D | 0 | 20 | 0 |
| Quadrant | Total seconds | Saturated seconds | Saturation percentage |
|---|---|---|---|
| A | 4967 | 186 | 3.744715% |
| B | 4967 | 1672 | 33.662170% |
| C | 4967 | 58 | 1.167707% |
| D | 4967 | 355 | 7.147171% |
Noise dominated data is calculated using 1-second bins in cleaned event files. If a bin has >2000 counts, and if more than 50% of those come from <1% of pixels, then it is considered to be noise-dominated and hence unusable.
| Quadrant | # 1 sec bins | Bins with >0 counts | Bins with >2000 counts | High rate bins dominated by noise | Noise dominated (total time) | Noise dominated (detector-on time) | Marked lightcurve |
|---|---|---|---|---|---|---|---|
| A | 7030 | 4968 | 140 | 140 | 1.99% | 2.82% | 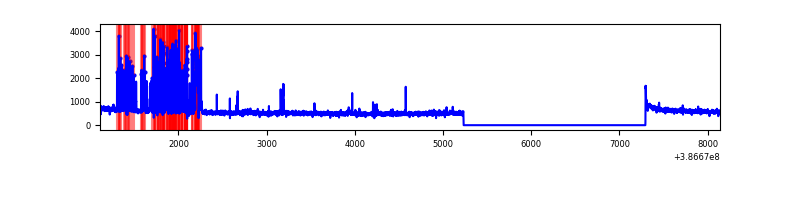 |
| B | 7030 | 4968 | 1127 | 1127 | 16.03% | 22.69% | 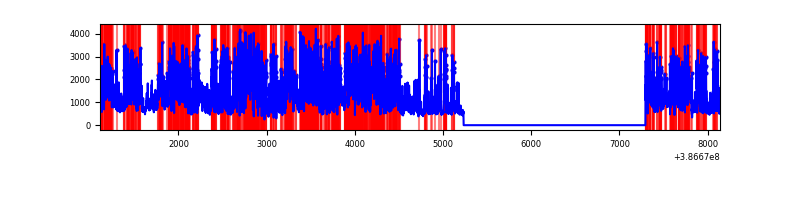 |
| C | 7030 | 4968 | 32 | 32 | 0.46% | 0.64% | 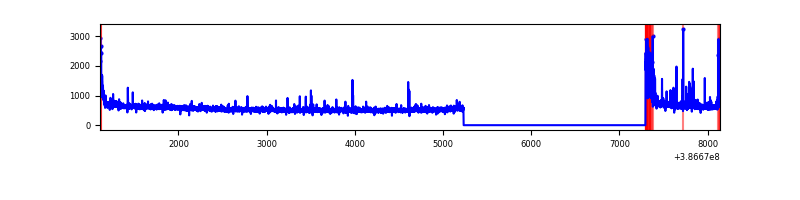 |
| D | 7030 | 4968 | 339 | 339 | 4.82% | 6.82% | 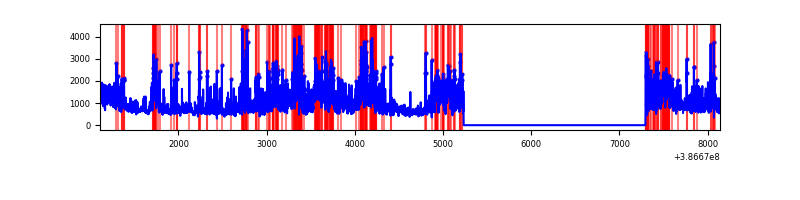 |
Top three noisy pixels from each quadrant. If the there are fewer than three noisy pixels in the level2.evt file, extra rows are filled as -1
| Pixel properties | Quadrant properties | ||||||
|---|---|---|---|---|---|---|---|
| Quadrant | DetID | PixID | Counts | Sigma | Mean | Median | Sigma |
| A | 15 | 174 | 594017 | 4534.65 | 656 | 647 | 130.9 |
| A | 10 | 83 | 78759 | 596.95 | 656 | 647 | 130.9 |
| A | 8 | 144 | 21677 | 160.72 | 656 | 647 | 130.9 |
| B | 5 | 236 | 4437322 | 41089.09 | 574 | 560 | 108.0 |
| B | 5 | 172 | 145460 | 1341.93 | 574 | 560 | 108.0 |
| B | 5 | 200 | 142241 | 1312.12 | 574 | 560 | 108.0 |
| C | 15 | 214 | 213728 | 1471.91 | 636 | 643 | 144.8 |
| C | 0 | 10 | 172541 | 1187.41 | 636 | 643 | 144.8 |
| C | 0 | 207 | 64987 | 444.47 | 636 | 643 | 144.8 |
| D | 8 | 195 | 2227618 | 14455.26 | 633 | 617 | 154.1 |
| D | 10 | 118 | 262758 | 1701.53 | 633 | 617 | 154.1 |
| D | 13 | 249 | 150054 | 969.98 | 633 | 617 | 154.1 |
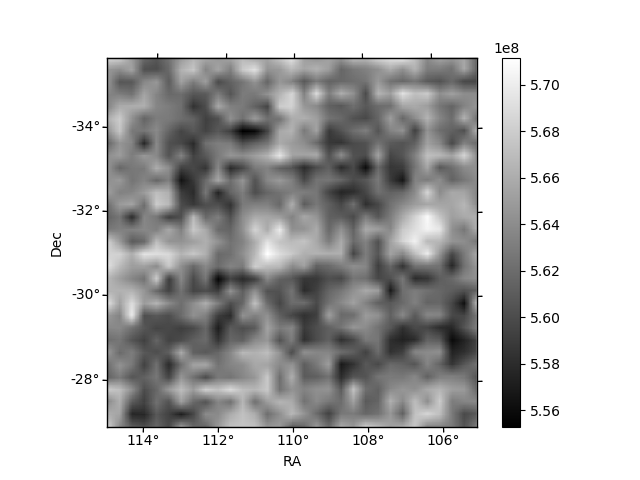
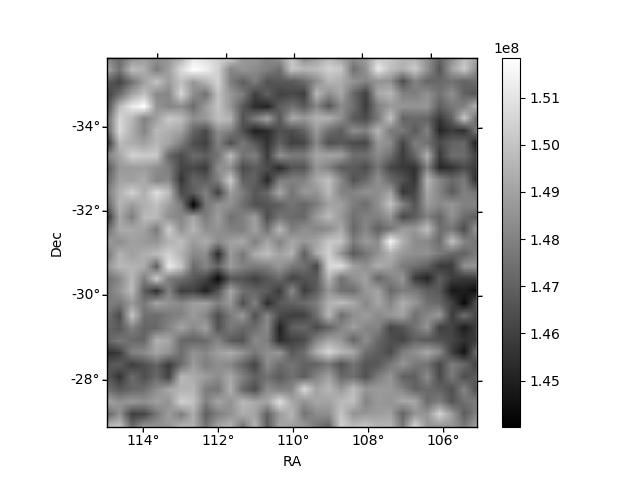
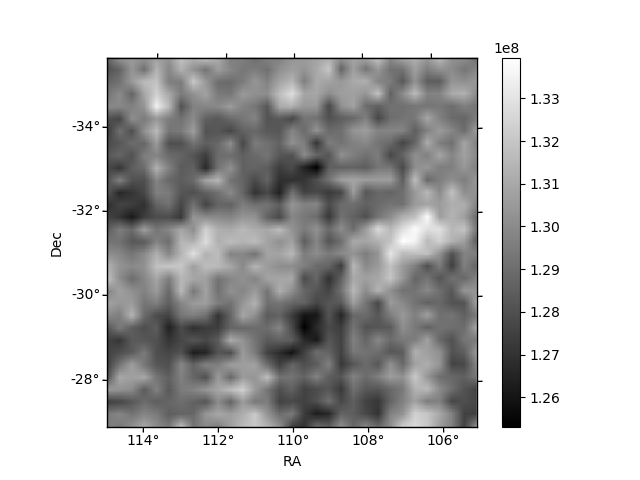
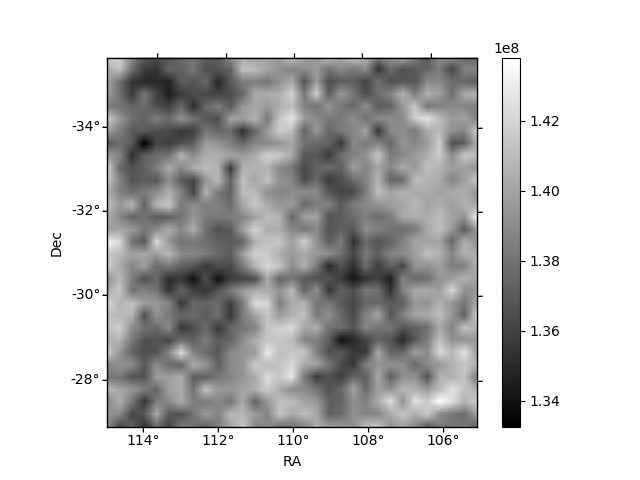
Histogram calculated using DETX and DETY for each event in the final _common_clean file
| Quadrant A | 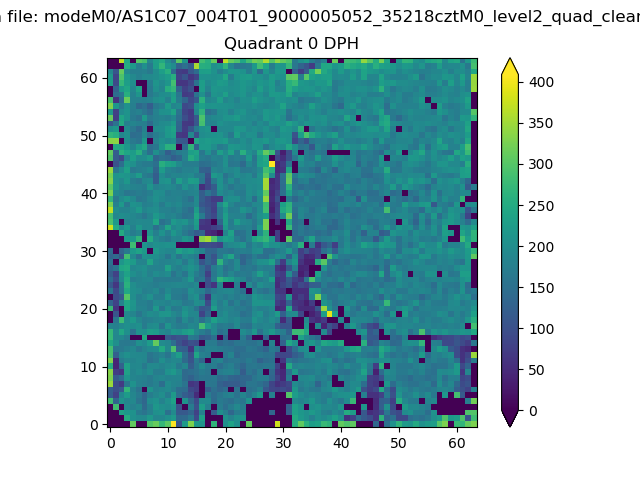 |
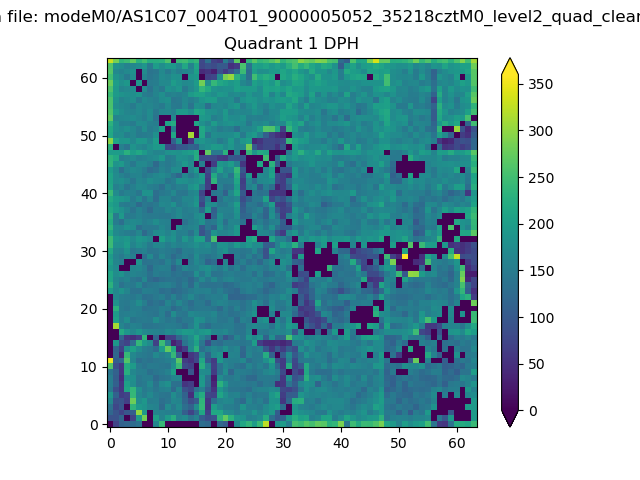 |
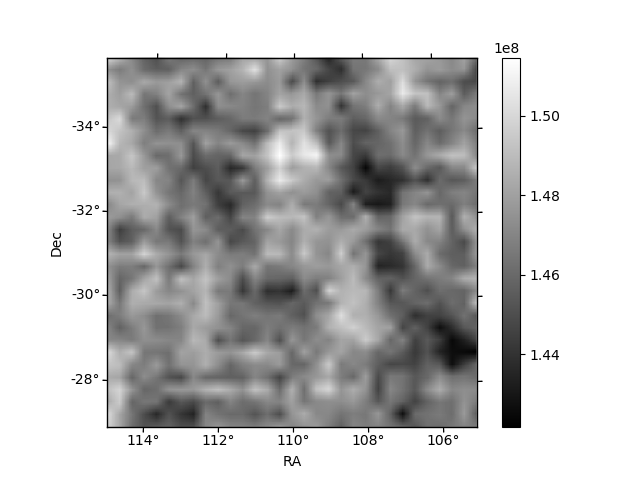
Quadrant B |
|---|---|---|---|
| Quadrant D | 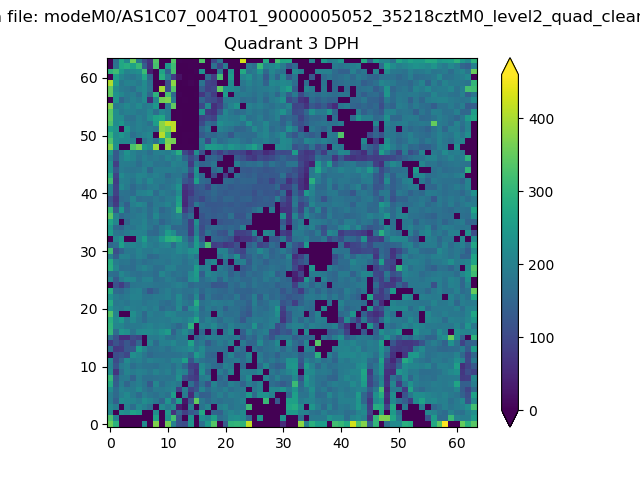 |
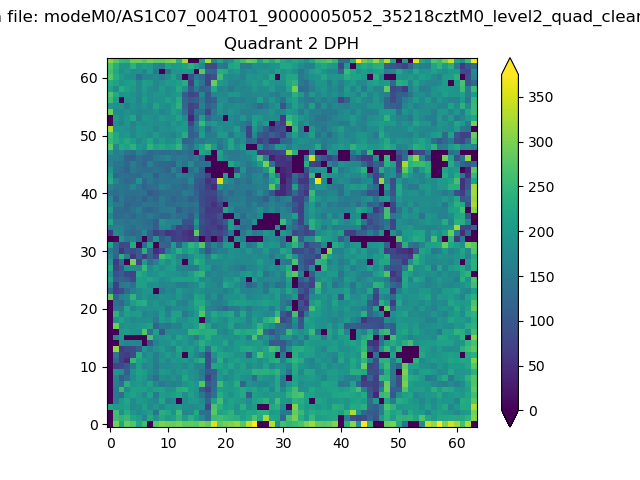 |
Quadrant C |
| Plot type | Count rate plots | Images |
|---|---|---|
| Comparison with Poisson distribution Blue bars denote a histogram of data divided into 1 sec bins. Red curve is a Poisson curve with rate = median count rate of data. |
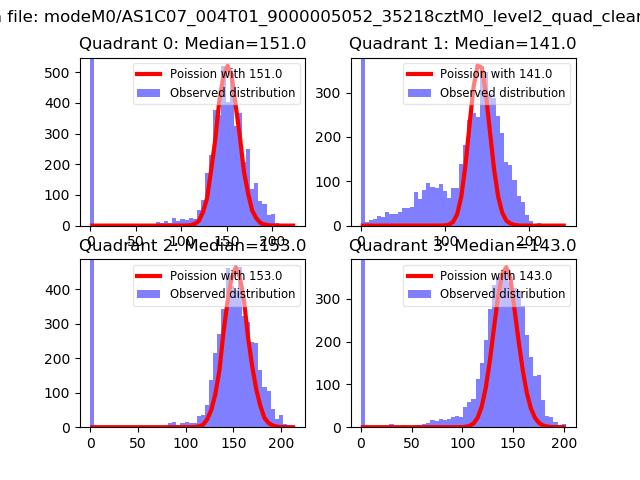 |
 |
| Quadrant-wise count rates Data is divided into 100 sec bins |
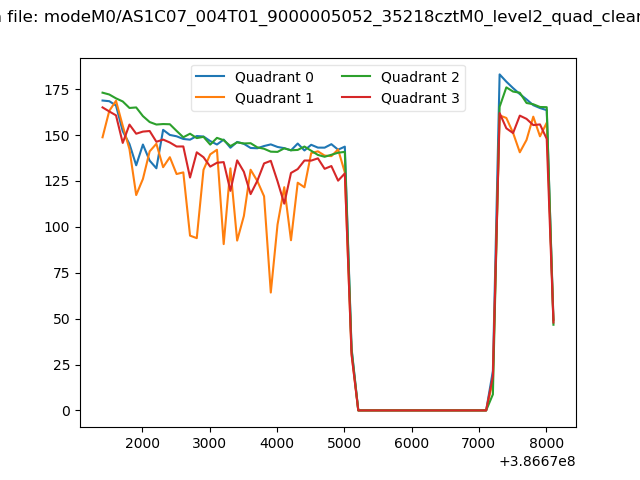 |
|
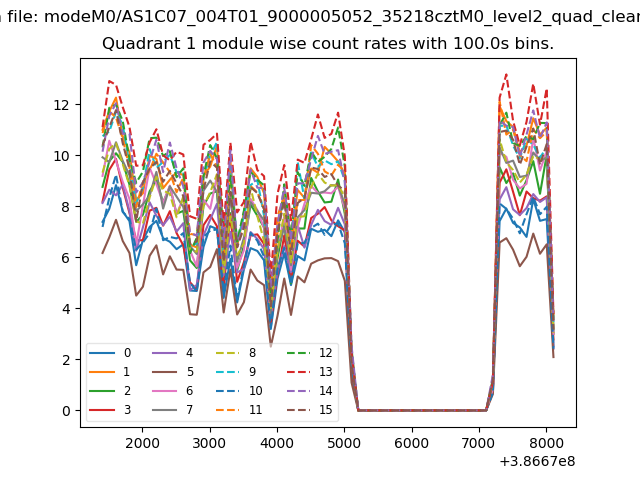
| Module-wise count rates for Quadrant A Data is divided into 100 sec bins |
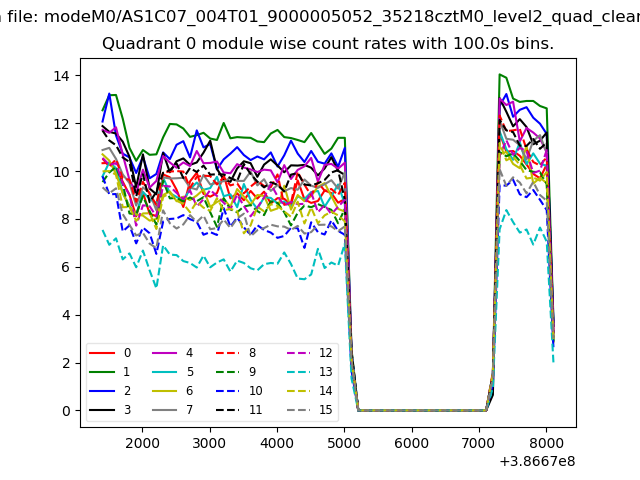 |
 |
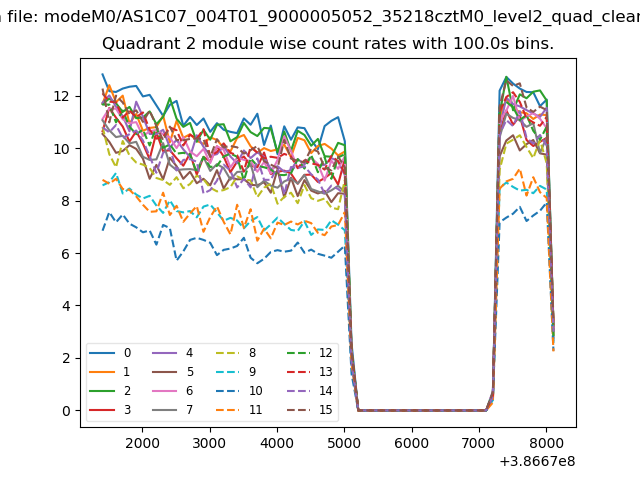
| Module-wise count rates for Quadrant B Data is divided into 100 sec bins |
 |
 |
| Module-wise count rates for Quadrant C Data is divided into 100 sec bins |
 |
 |
| Module-wise count rates for Quadrant D Data is divided into 100 sec bins |
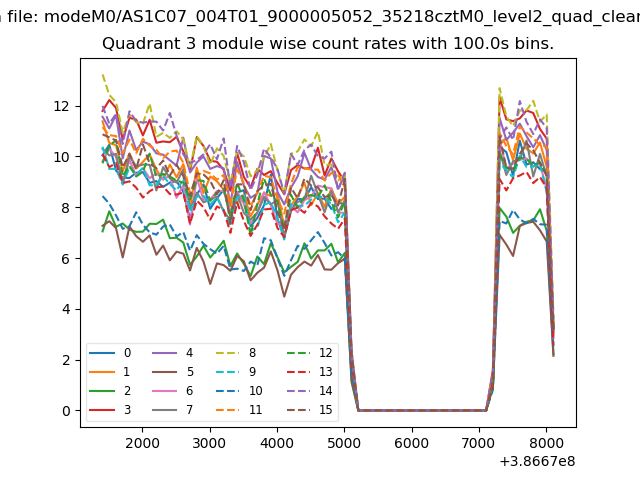 |
 |
| Parameter | Plot |
|---|---|
| CZT HV Monitor | 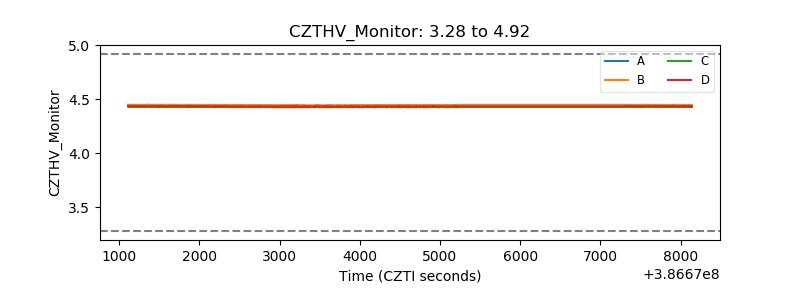 |
| D_VDD | 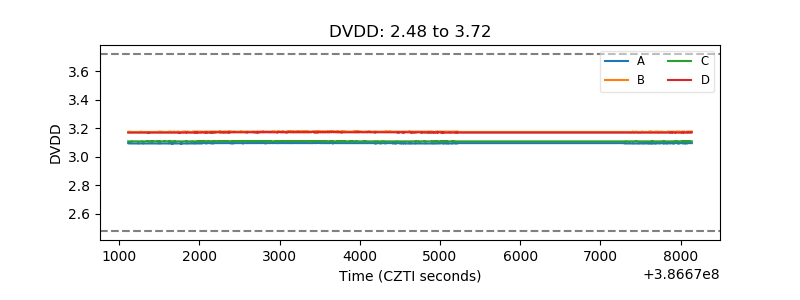 |
| Temperature 1 | 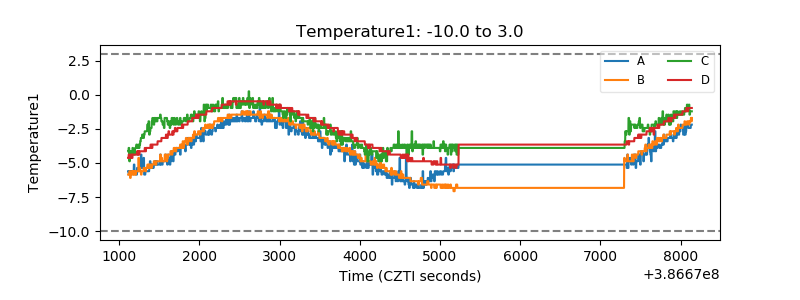 |
| Veto HV Monitor | 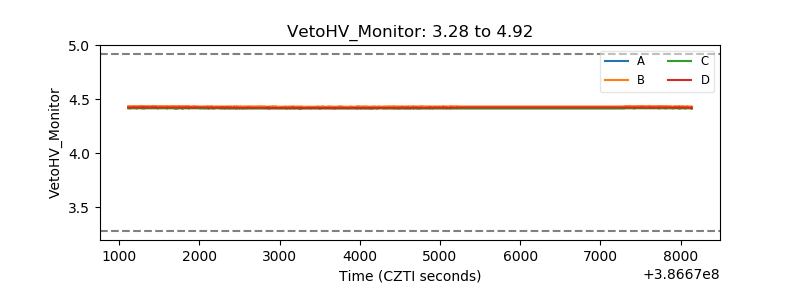 |
| Veto LLD | 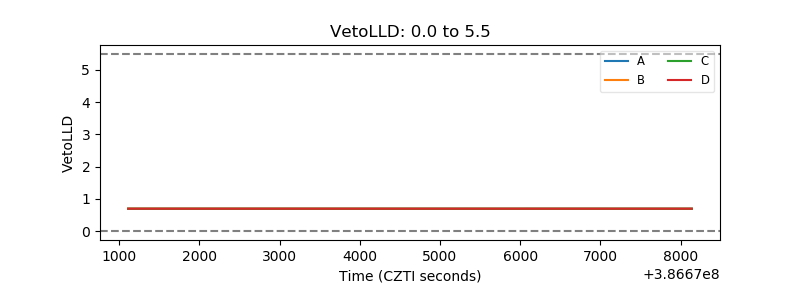 |
| Alpha Counter | 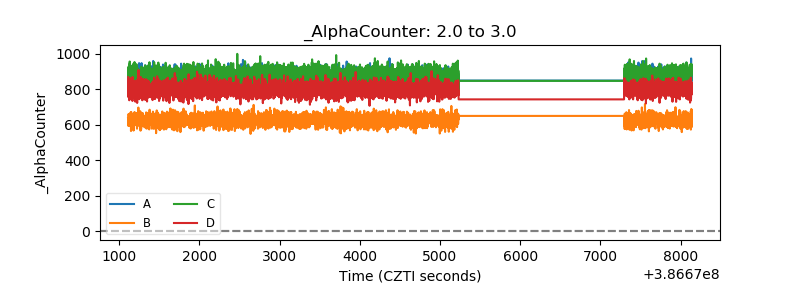 |
| _CPM_Rate | 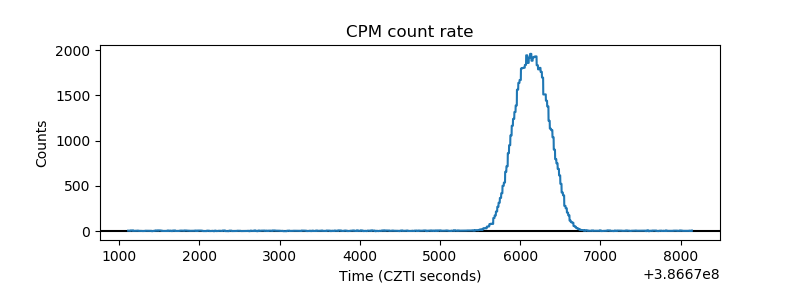 |
| CZT Counter | 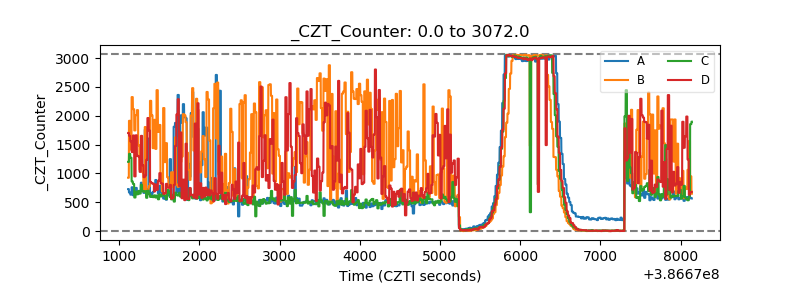 |
| +2.5 Volts monitor | 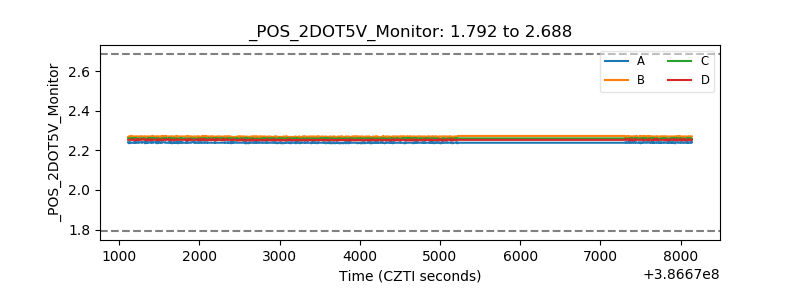 |
| +5 Volts monitor | 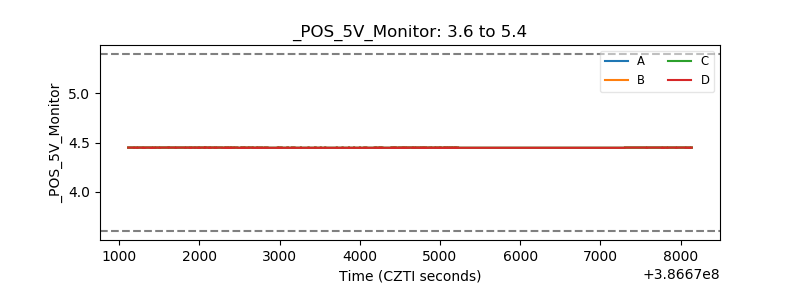 |
| _ROLL_ROT | 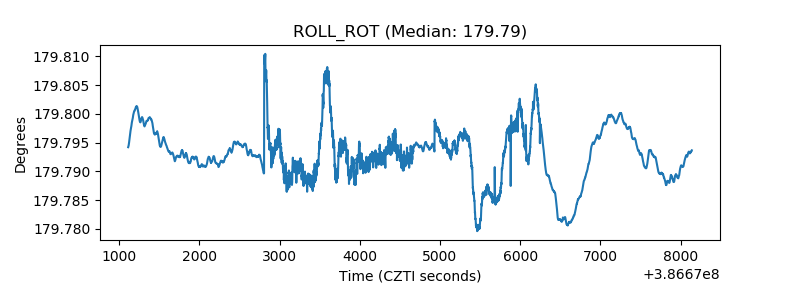 |
| _Roll_DEC | 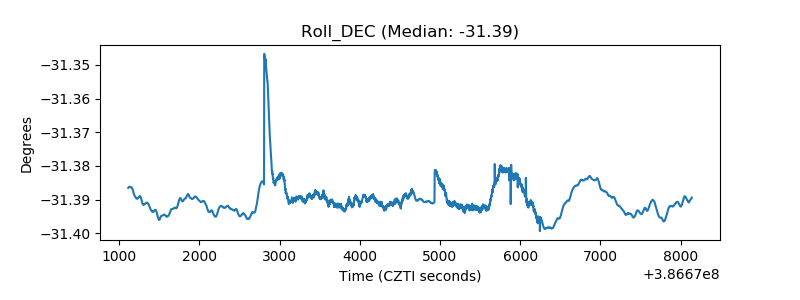 |
| _Roll_RA | 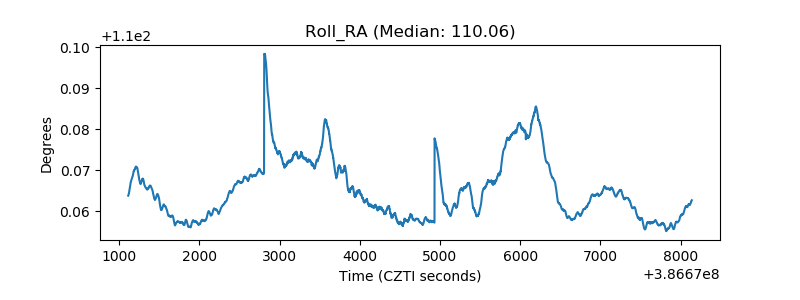 |
| Veto Counter | 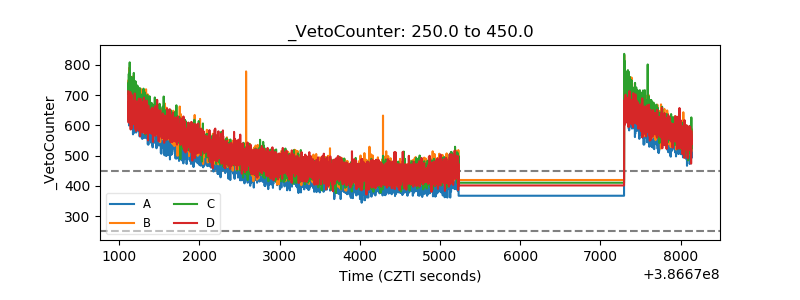 |