| Param | Original file | Final file |
|---|---|---|
| Filename | modeM0/AS1C07_004T01_9000005052_35214cztM0_level2.evt | modeM0/AS1C07_004T01_9000005052_35214cztM0_level2_quad_clean.evt |
| Size (bytes) | 577,984,320 | 60,353,280 |
| Size | 551.2 MB | 57.6 MB |
| Events in quadrant A | 2,638,107 | 366,401 |
| Events in quadrant B | 5,365,345 | 368,728 |
| Events in quadrant C | 3,106,285 | 372,842 |
| Events in quadrant D | 6,025,410 | 337,219 |
| Mode M0 | |||
|---|---|---|---|
| Quadrant | BADHDUFLAG | Total packets | Discarded packets |
| A | 0 | 11258 | 3 |
| B | 0 | 19586 | 2 |
| C | 0 | 12447 | 2 |
| D | 0 | 21799 | 2 |
| Mode SS | |||
|---|---|---|---|
| Quadrant | BADHDUFLAG | Total packets | Discarded packets |
| A | 0 | 112 | 0 |
| B | 0 | 112 | 0 |
| C | 0 | 112 | 0 |
| D | 0 | 112 | 0 |
| Mode M9 | |||
|---|---|---|---|
| Quadrant | BADHDUFLAG | Total packets | Discarded packets |
| A | 0 | 22 | 0 |
| B | 0 | 22 | 0 |
| C | 0 | 22 | 0 |
| D | 0 | 23 | 0 |
| Quadrant | Total seconds | Saturated seconds | Saturation percentage |
|---|---|---|---|
| A | 5453 | 11 | 0.201724% |
| B | 5453 | 1086 | 19.915643% |
| C | 5453 | 54 | 0.990281% |
| D | 5453 | 384 | 7.041995% |
Noise dominated data is calculated using 1-second bins in cleaned event files. If a bin has >2000 counts, and if more than 50% of those come from <1% of pixels, then it is considered to be noise-dominated and hence unusable.
| Quadrant | # 1 sec bins | Bins with >0 counts | Bins with >2000 counts | High rate bins dominated by noise | Noise dominated (total time) | Noise dominated (detector-on time) | Marked lightcurve |
|---|---|---|---|---|---|---|---|
| A | 7157 | 5454 | 2 | 2 | 0.03% | 0.04% |  |
| B | 7156 | 5453 | 779 | 779 | 10.89% | 14.29% | 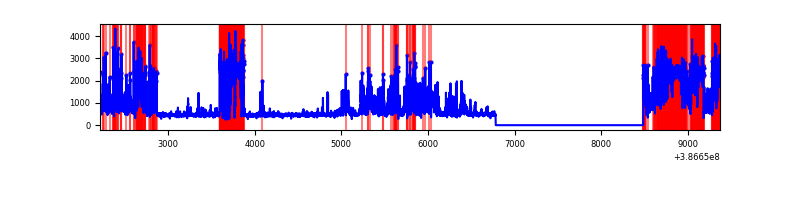 |
| C | 7157 | 5454 | 36 | 36 | 0.50% | 0.66% | 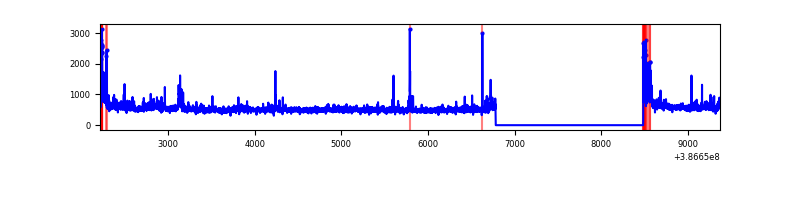 |
| D | 7157 | 5454 | 427 | 427 | 5.97% | 7.83% | 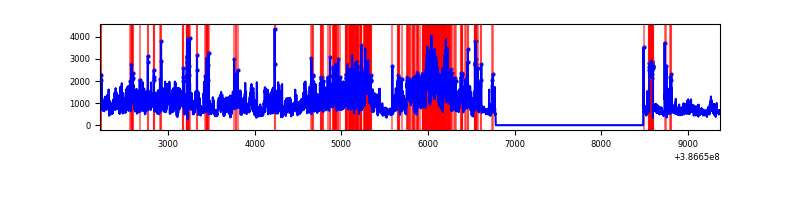 |
Top three noisy pixels from each quadrant. If the there are fewer than three noisy pixels in the level2.evt file, extra rows are filled as -1
| Pixel properties | Quadrant properties | ||||||
|---|---|---|---|---|---|---|---|
| Quadrant | DetID | PixID | Counts | Sigma | Mean | Median | Sigma |
| A | 10 | 83 | 101394 | 769.3 | 648 | 635 | 131.0 |
| A | 13 | 6 | 9023 | 64.04 | 648 | 635 | 131.0 |
| A | 13 | 254 | 8484 | 59.93 | 648 | 635 | 131.0 |
| B | 5 | 236 | 2512556 | 22591.56 | 579 | 564 | 111.2 |
| B | 4 | 232 | 525741 | 4723.17 | 579 | 564 | 111.2 |
| B | 5 | 172 | 24944 | 219.26 | 579 | 564 | 111.2 |
| C | 0 | 10 | 245343 | 1681.7 | 630 | 634 | 145.5 |
| C | 15 | 214 | 231241 | 1584.79 | 630 | 634 | 145.5 |
| C | 3 | 233 | 64589 | 439.52 | 630 | 634 | 145.5 |
| D | 8 | 195 | 2143399 | 14282.48 | 615 | 598 | 150.0 |
| D | 5 | 223 | 719435 | 4791.29 | 615 | 598 | 150.0 |
| D | 13 | 249 | 219820 | 1461.19 | 615 | 598 | 150.0 |
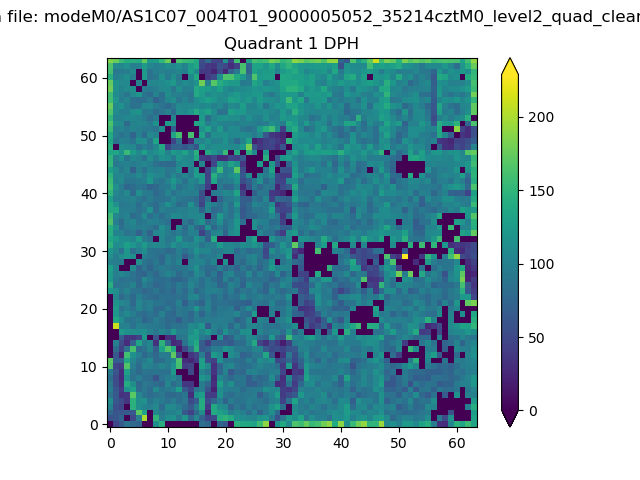
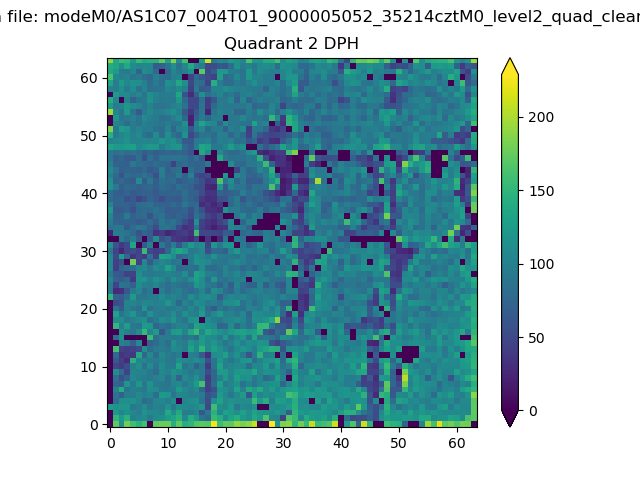
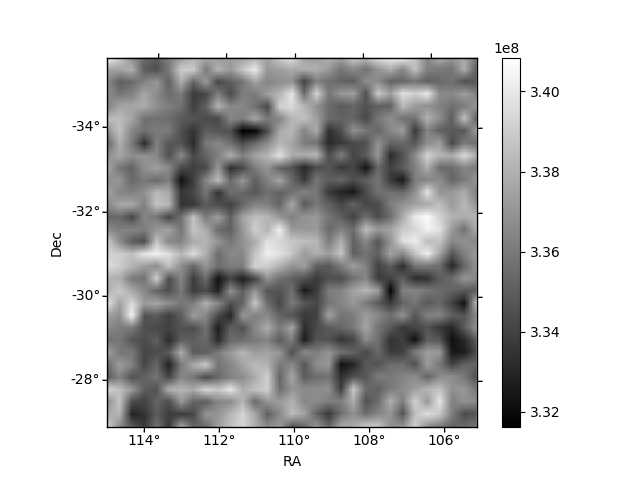
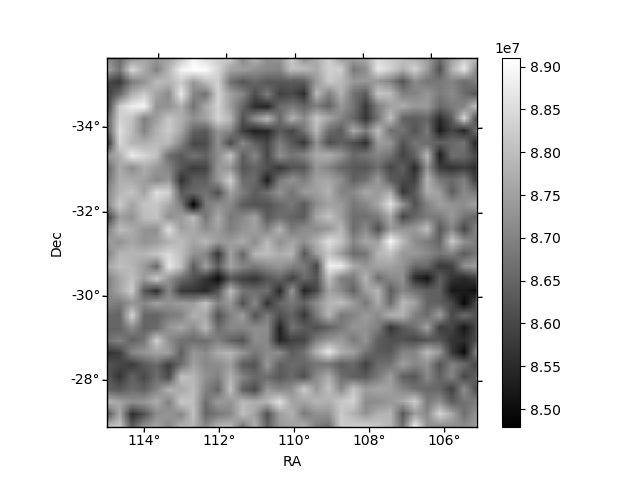
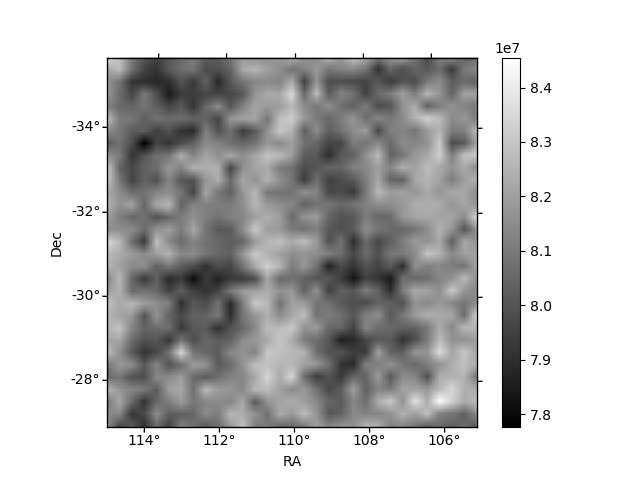
Histogram calculated using DETX and DETY for each event in the final _common_clean file
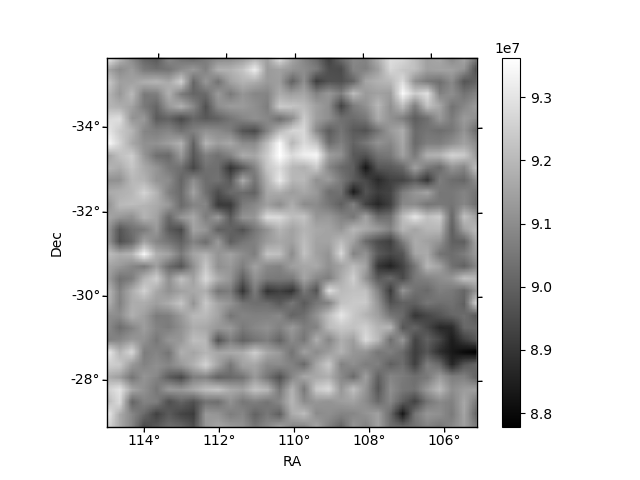
| Quadrant A | 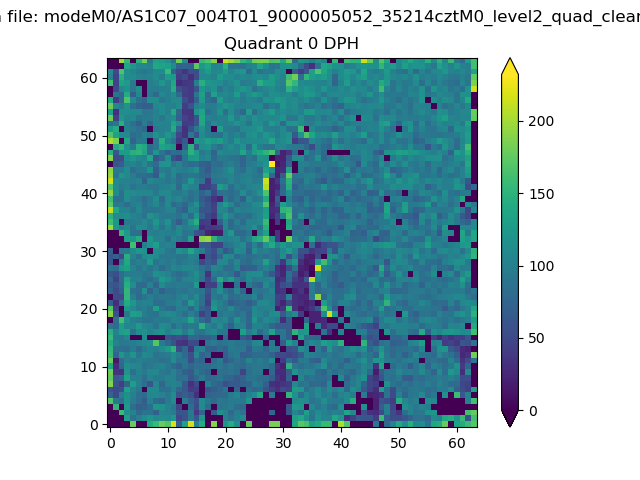 |
 |
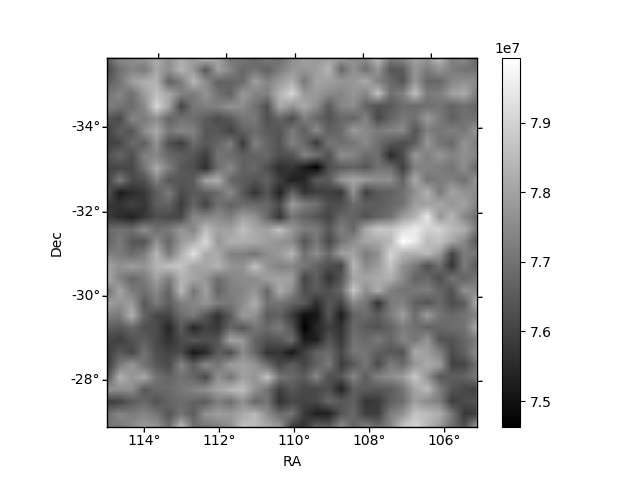
Quadrant B |
|---|---|---|---|
| Quadrant D | 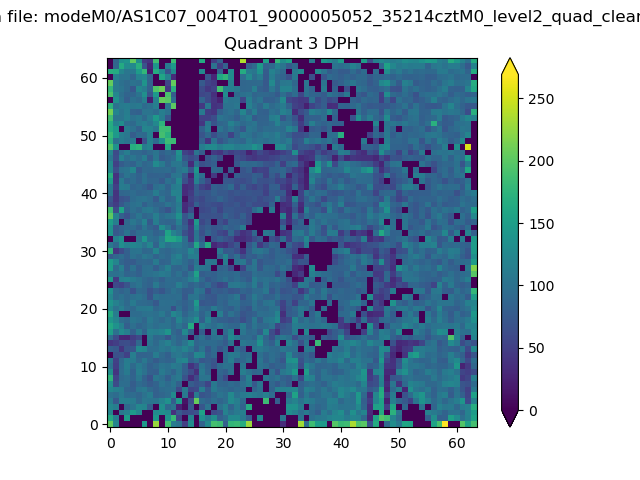 |
 |
Quadrant C |
| Plot type | Count rate plots | Images |
|---|---|---|
| Comparison with Poisson distribution Blue bars denote a histogram of data divided into 1 sec bins. Red curve is a Poisson curve with rate = median count rate of data. |
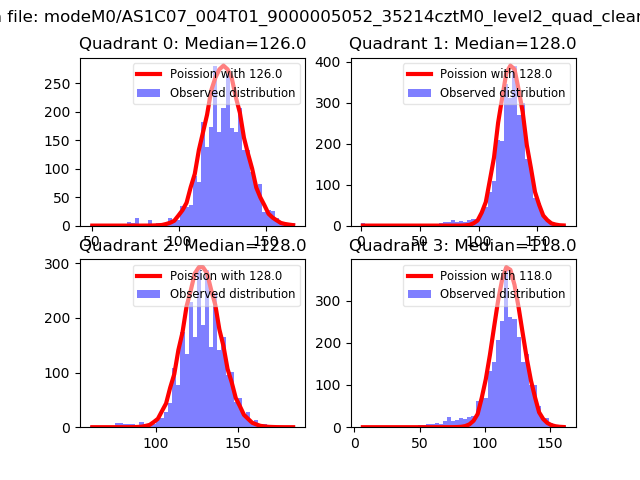 |
 |
| Quadrant-wise count rates Data is divided into 100 sec bins |
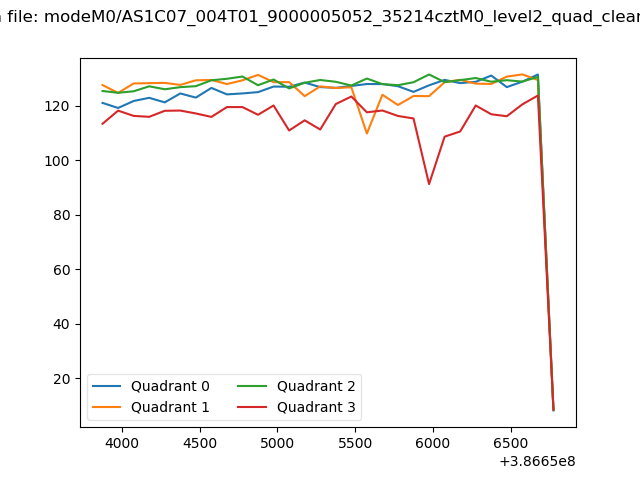 |
|
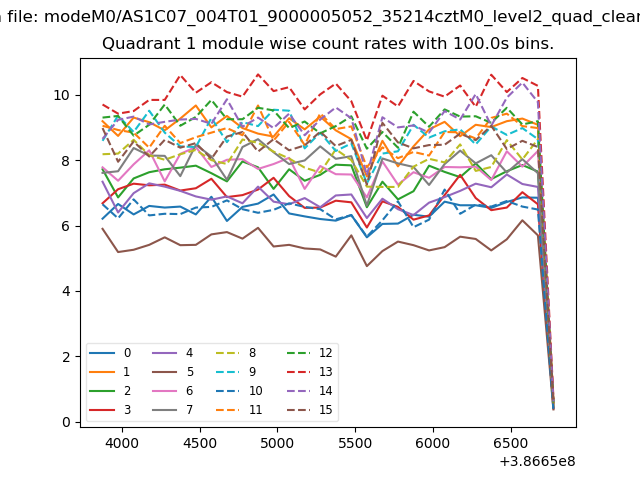
| Module-wise count rates for Quadrant A Data is divided into 100 sec bins |
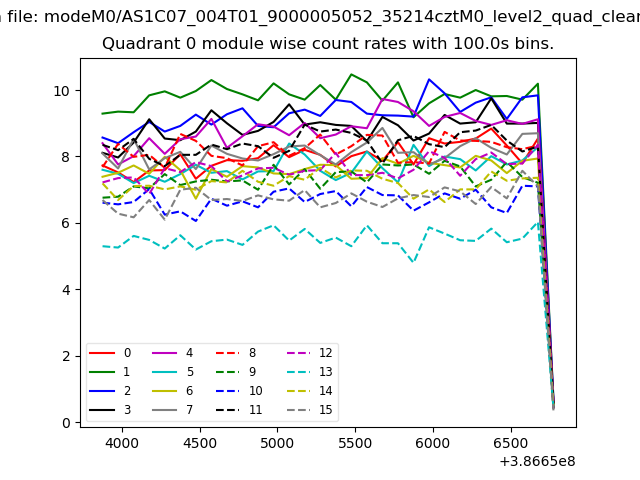 |
 |
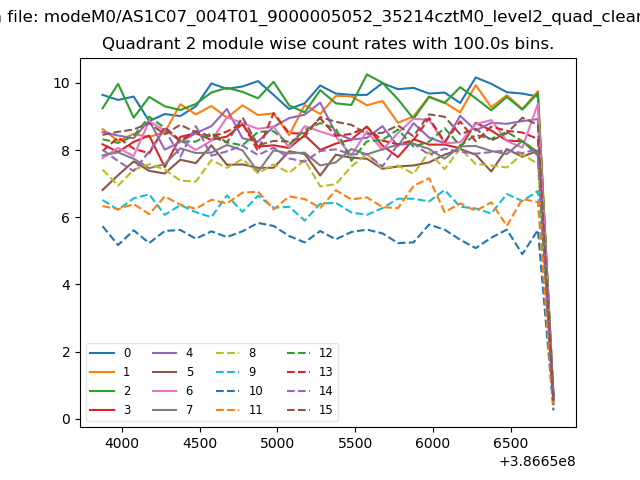
| Module-wise count rates for Quadrant B Data is divided into 100 sec bins |
 |
 |
| Module-wise count rates for Quadrant C Data is divided into 100 sec bins |
 |
 |
| Module-wise count rates for Quadrant D Data is divided into 100 sec bins |
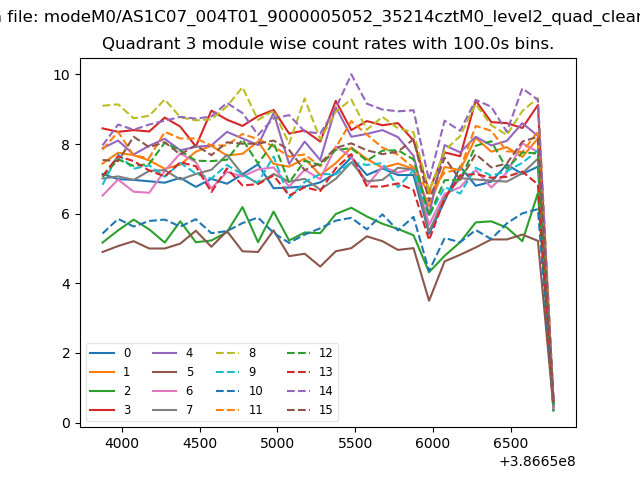 |
 |
| Parameter | Plot |
|---|---|
| CZT HV Monitor | 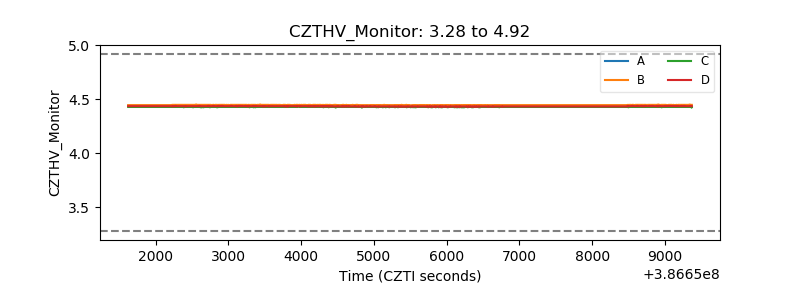 |
| D_VDD | 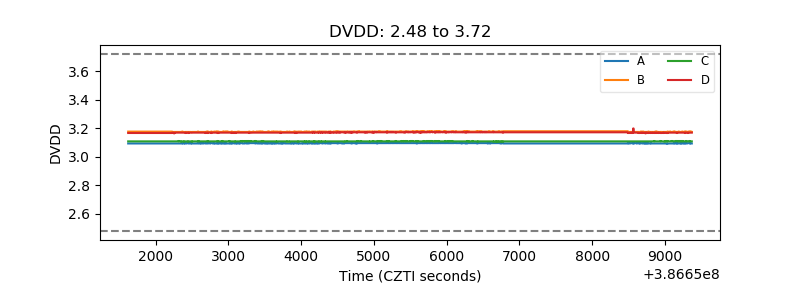 |
| Temperature 1 | 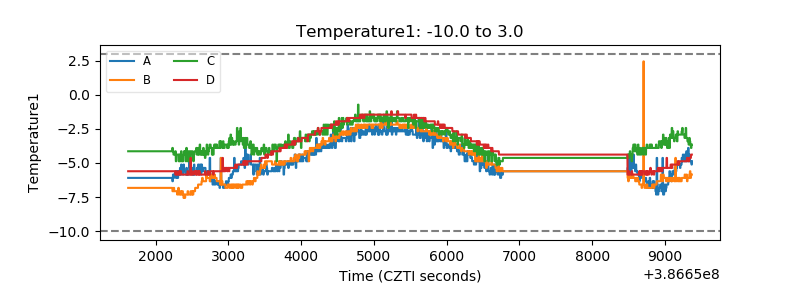 |
| Veto HV Monitor | 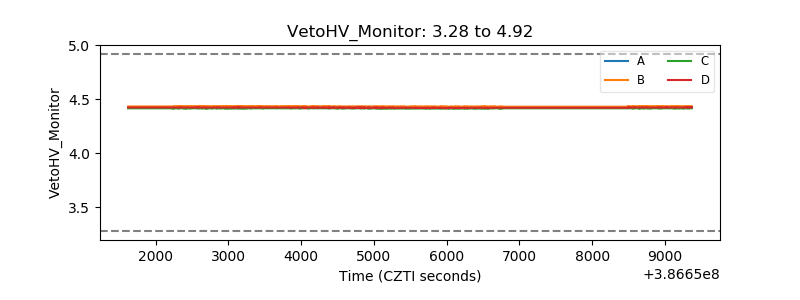 |
| Veto LLD | 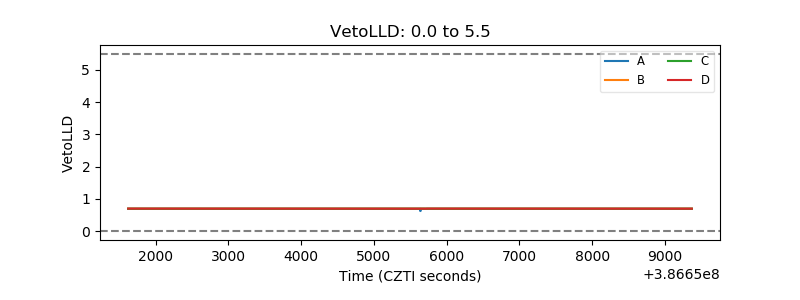 |
| Alpha Counter | 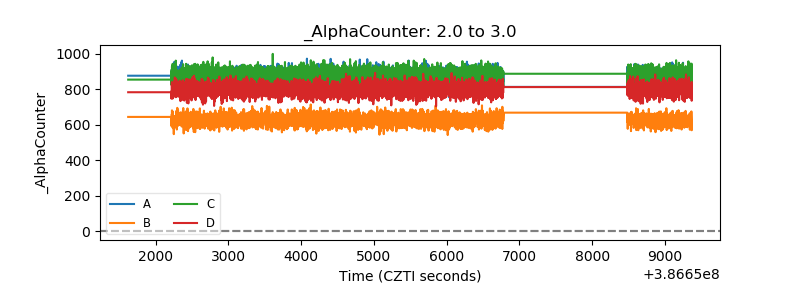 |
| _CPM_Rate | 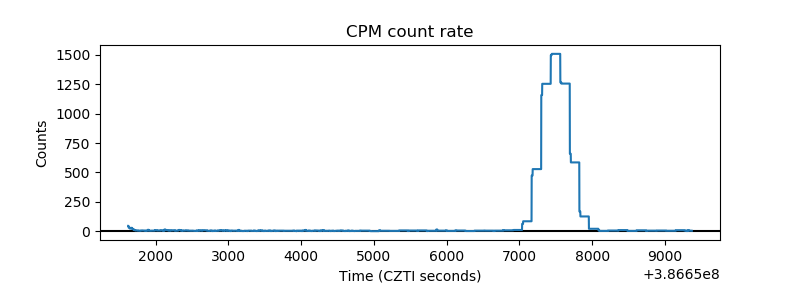 |
| CZT Counter | 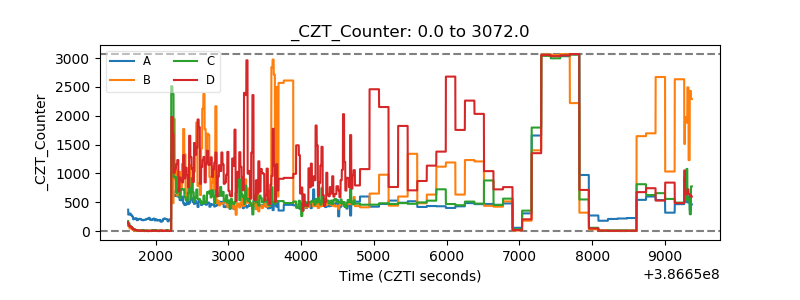 |
| +2.5 Volts monitor | 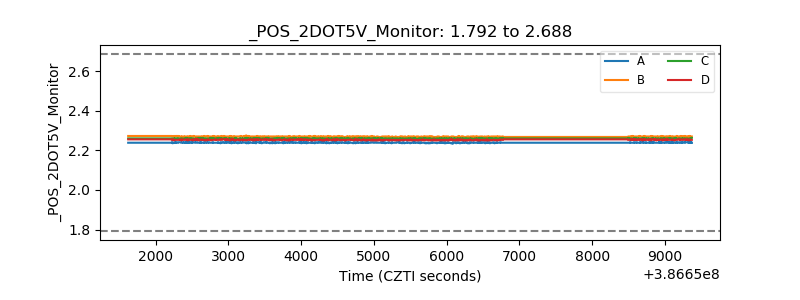 |
| +5 Volts monitor | 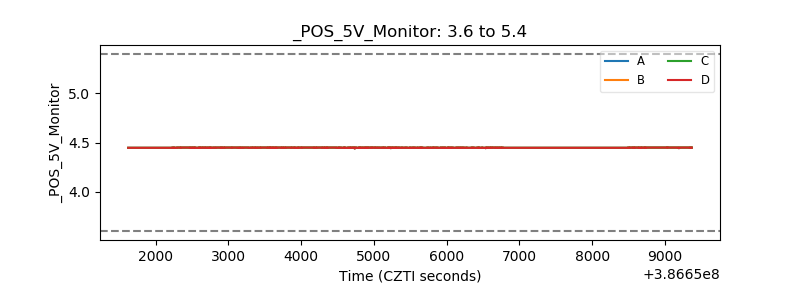 |
| _ROLL_ROT | 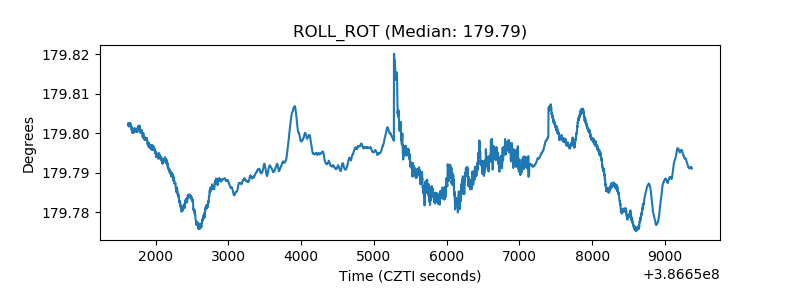 |
| _Roll_DEC | 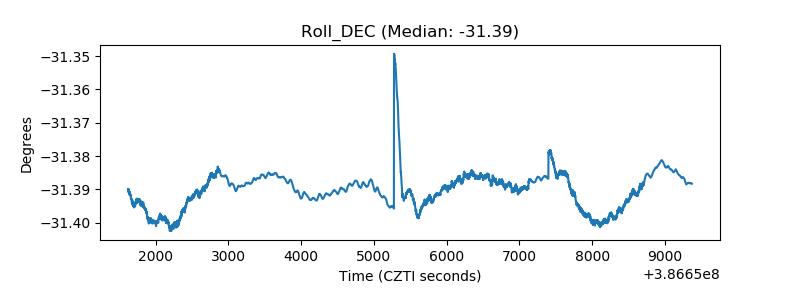 |
| _Roll_RA | 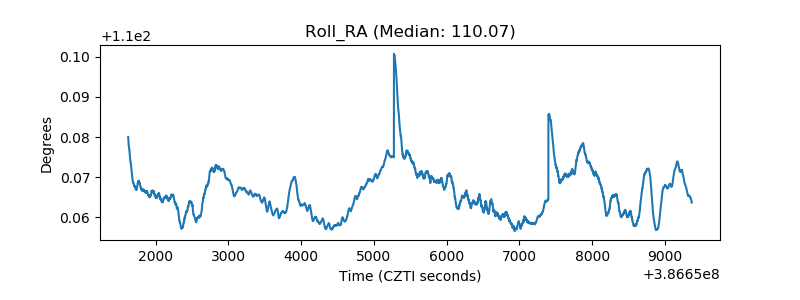 |
| Veto Counter |  |