| Param | Original file | Final file |
|---|---|---|
| Filename | modeM0/AS1C07_004T01_9000005052_35212cztM0_level2.evt | modeM0/AS1C07_004T01_9000005052_35212cztM0_level2_quad_clean.evt |
| Size (bytes) | 1,179,642,240 | 112,512,960 |
| Size | 1.1 GB | 107.3 MB |
| Events in quadrant A | 5,185,463 | 695,054 |
| Events in quadrant B | 11,927,409 | 626,890 |
| Events in quadrant C | 6,071,015 | 699,822 |
| Events in quadrant D | 11,814,572 | 636,076 |
| Mode M0 | |||
|---|---|---|---|
| Quadrant | BADHDUFLAG | Total packets | Discarded packets |
| A | 0 | 22308 | 4 |
| B | 0 | 42964 | 3 |
| C | 0 | 24434 | 3 |
| D | 0 | 42650 | 3 |
| Mode SS | |||
|---|---|---|---|
| Quadrant | BADHDUFLAG | Total packets | Discarded packets |
| A | 0 | 220 | 0 |
| B | 0 | 220 | 0 |
| C | 0 | 220 | 0 |
| D | 0 | 220 | 0 |
| Mode M9 | |||
|---|---|---|---|
| Quadrant | BADHDUFLAG | Total packets | Discarded packets |
| A | 0 | 31 | 0 |
| B | 0 | 31 | 0 |
| C | 0 | 31 | 0 |
| D | 0 | 32 | 0 |
| Quadrant | Total seconds | Saturated seconds | Saturation percentage |
|---|---|---|---|
| A | 10809 | 40 | 0.370062% |
| B | 10809 | 2358 | 21.815154% |
| C | 10809 | 133 | 1.230456% |
| D | 10809 | 707 | 6.540846% |
Noise dominated data is calculated using 1-second bins in cleaned event files. If a bin has >2000 counts, and if more than 50% of those come from <1% of pixels, then it is considered to be noise-dominated and hence unusable.
| Quadrant | # 1 sec bins | Bins with >0 counts | Bins with >2000 counts | High rate bins dominated by noise | Noise dominated (total time) | Noise dominated (detector-on time) | Marked lightcurve |
|---|---|---|---|---|---|---|---|
| A | 13615 | 10811 | 27 | 27 | 0.20% | 0.25% | 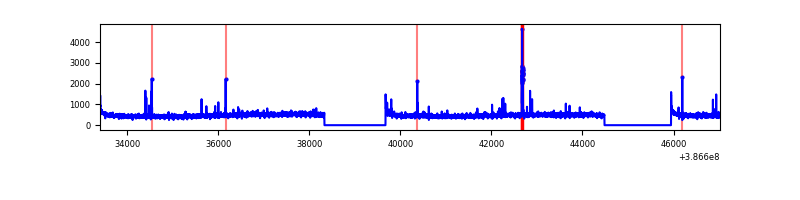 |
| B | 13615 | 10811 | 1533 | 1533 | 11.26% | 14.18% | 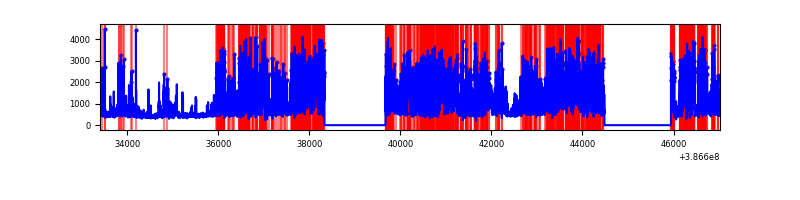 |
| C | 13615 | 10811 | 105 | 105 | 0.77% | 0.97% | 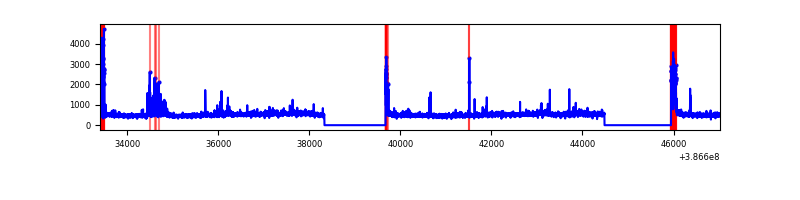 |
| D | 13615 | 10811 | 714 | 714 | 5.24% | 6.60% | 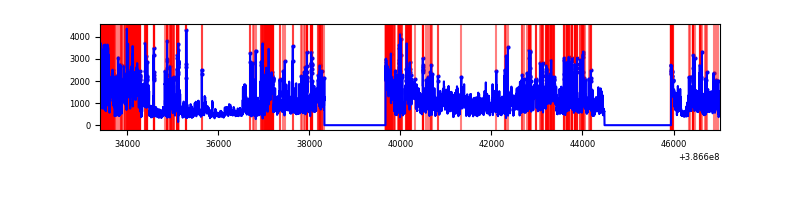 |
Top three noisy pixels from each quadrant. If the there are fewer than three noisy pixels in the level2.evt file, extra rows are filled as -1
| Pixel properties | Quadrant properties | ||||||
|---|---|---|---|---|---|---|---|
| Quadrant | DetID | PixID | Counts | Sigma | Mean | Median | Sigma |
| A | 10 | 83 | 169240 | 672.34 | 1250 | 1228 | 249.9 |
| A | 9 | 143 | 104693 | 414.04 | 1250 | 1228 | 249.9 |
| A | 13 | 6 | 38247 | 148.14 | 1250 | 1228 | 249.9 |
| B | 5 | 236 | 6819006 | 31462.08 | 1139 | 1110 | 216.7 |
| B | 4 | 232 | 394534 | 1815.5 | 1139 | 1110 | 216.7 |
| B | 3 | 112 | 67493 | 306.33 | 1139 | 1110 | 216.7 |
| C | 15 | 214 | 449758 | 1599.72 | 1210 | 1217 | 280.4 |
| C | 0 | 10 | 420229 | 1494.4 | 1210 | 1217 | 280.4 |
| C | 12 | 250 | 269527 | 956.93 | 1210 | 1217 | 280.4 |
| D | 8 | 195 | 5185480 | 17975.26 | 1189 | 1156 | 288.4 |
| D | 5 | 223 | 676794 | 2342.59 | 1189 | 1156 | 288.4 |
| D | 13 | 249 | 472184 | 1633.16 | 1189 | 1156 | 288.4 |
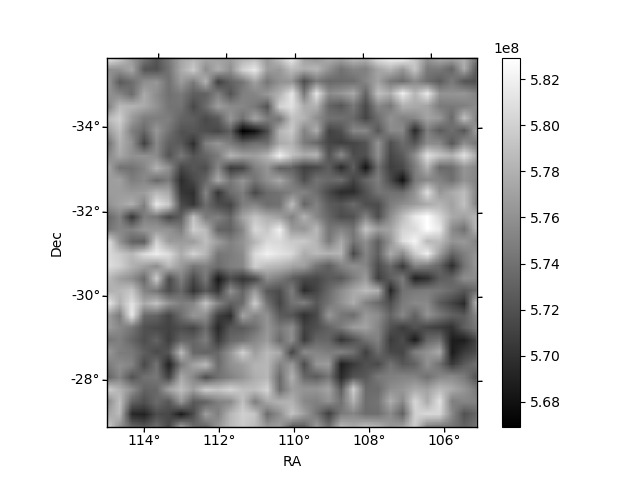
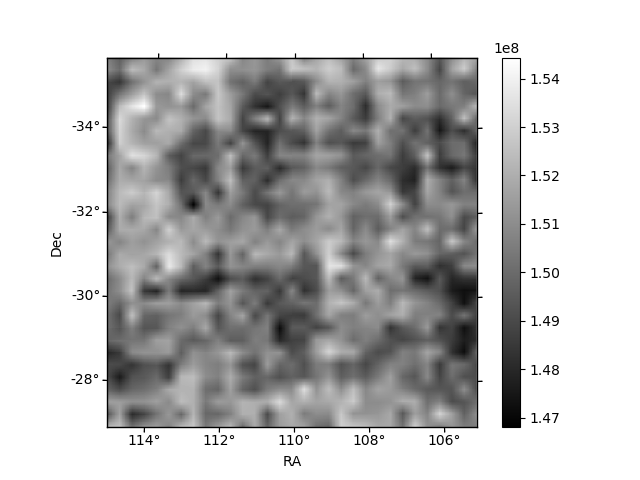
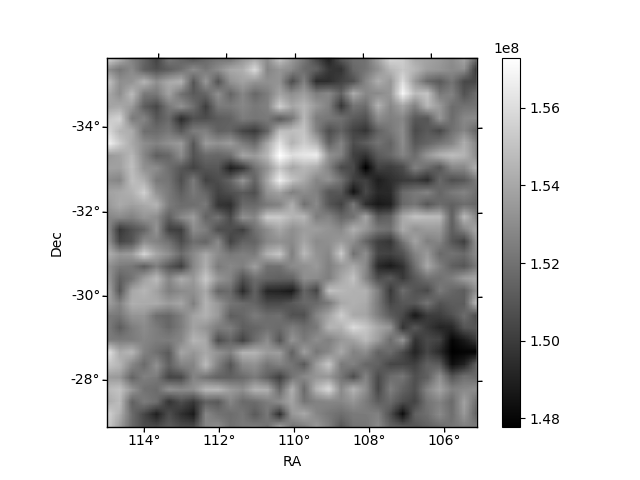
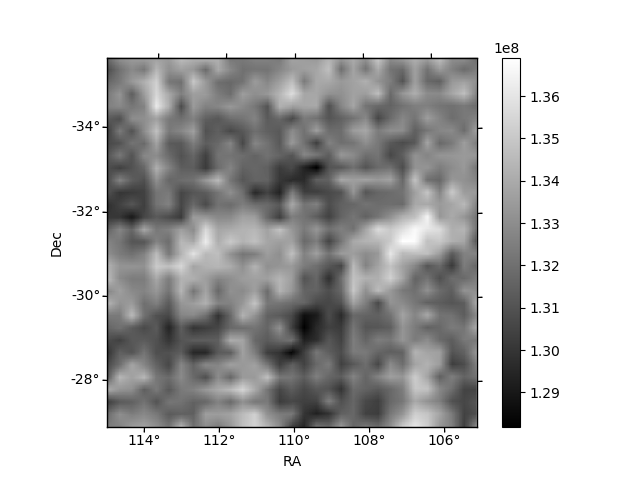
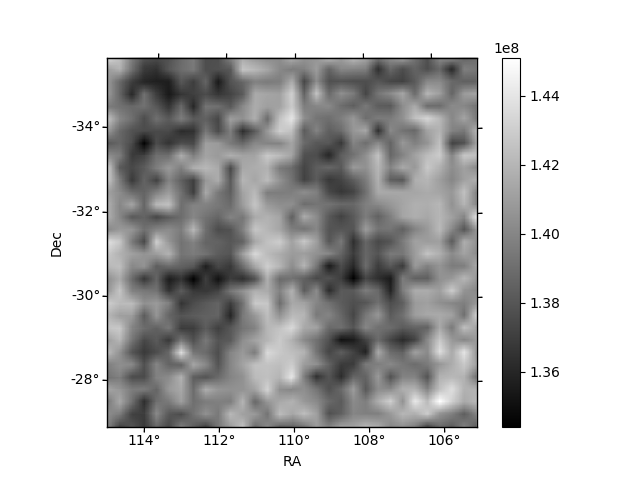
Histogram calculated using DETX and DETY for each event in the final _common_clean file
| Quadrant A | 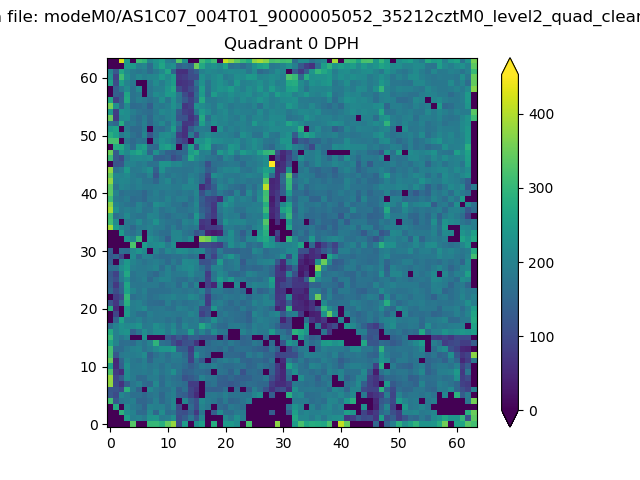 |
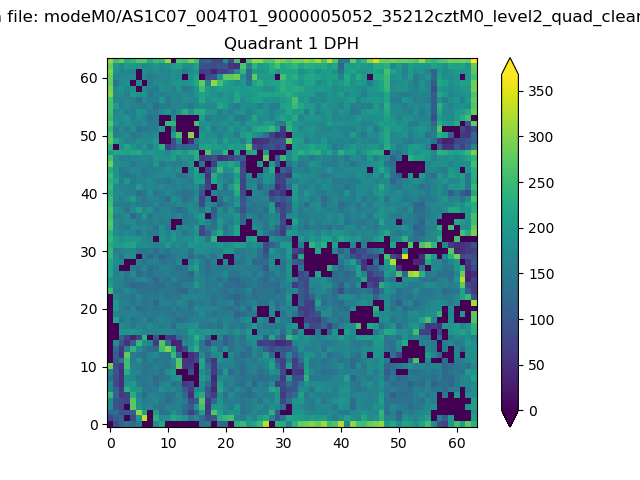 |
Quadrant B |
|---|---|---|---|
| Quadrant D | 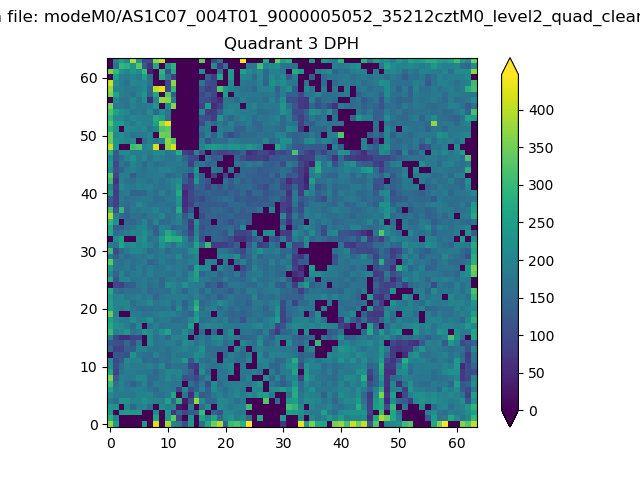 |
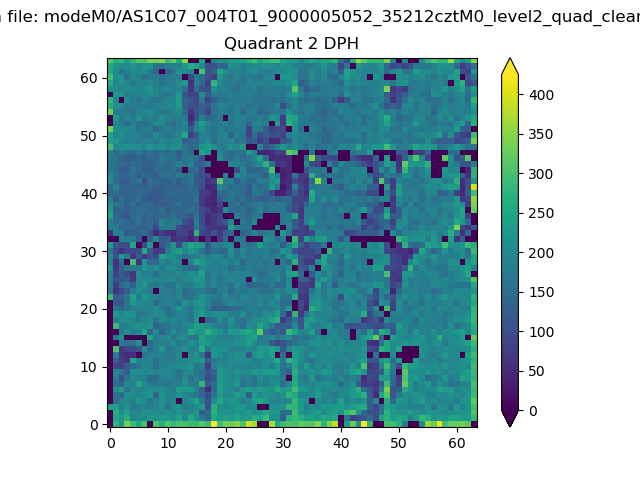 |
Quadrant C |
| Plot type | Count rate plots | Images |
|---|---|---|
| Comparison with Poisson distribution Blue bars denote a histogram of data divided into 1 sec bins. Red curve is a Poisson curve with rate = median count rate of data. |
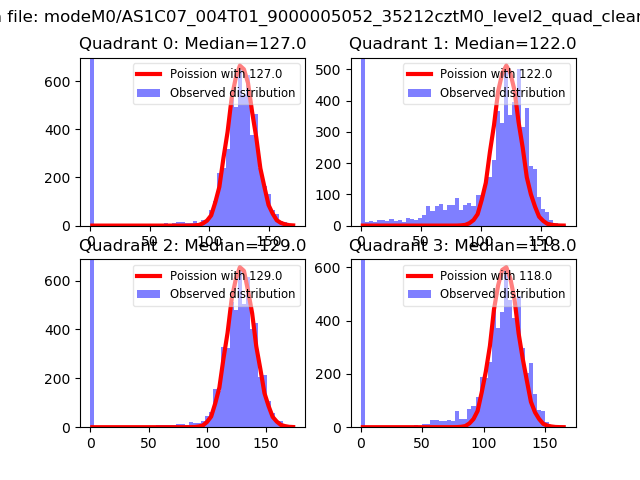 |
 |
| Quadrant-wise count rates Data is divided into 100 sec bins |
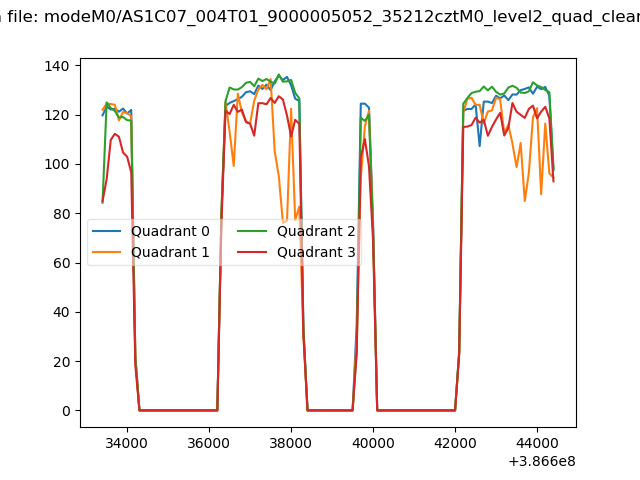 |
|
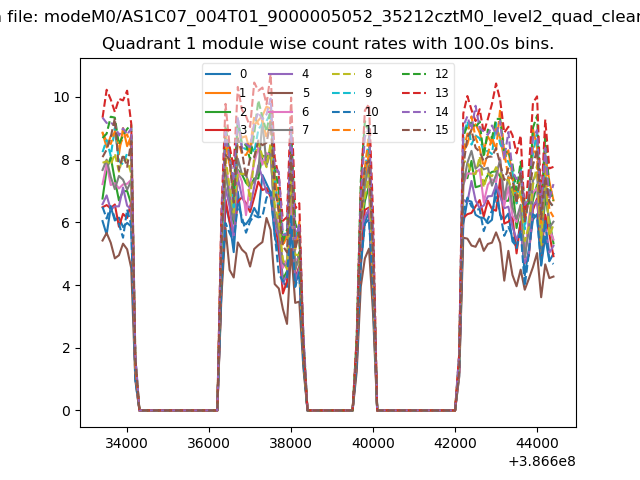
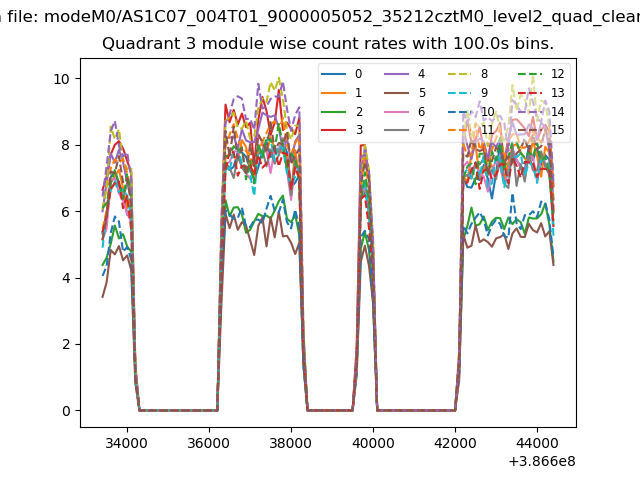
| Module-wise count rates for Quadrant A Data is divided into 100 sec bins |
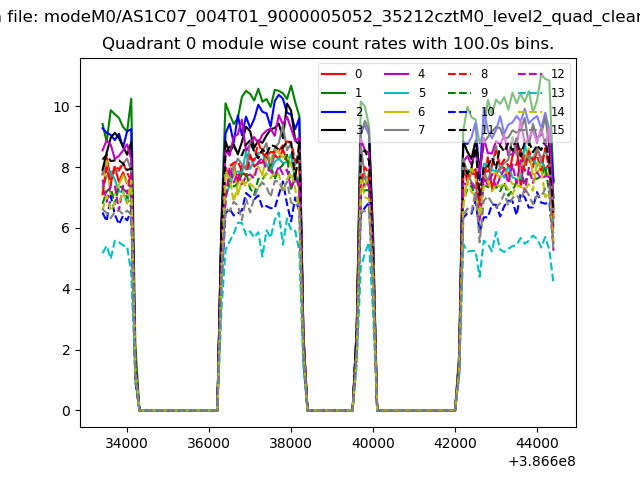 |
 |
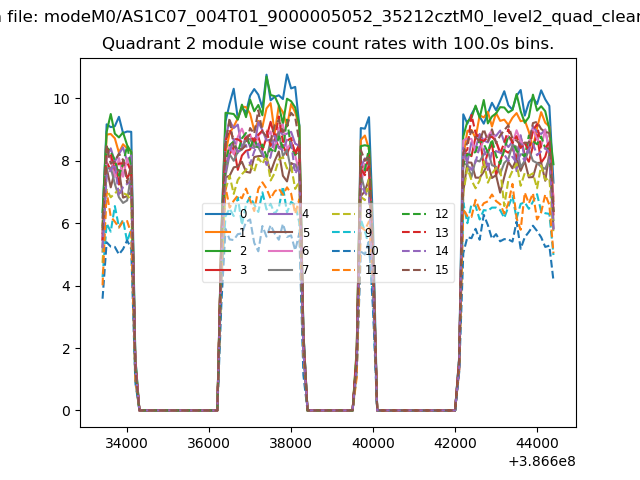
| Module-wise count rates for Quadrant B Data is divided into 100 sec bins |
 |
 |
| Module-wise count rates for Quadrant C Data is divided into 100 sec bins |
 |
 |
| Module-wise count rates for Quadrant D Data is divided into 100 sec bins |
 |
 |
| Parameter | Plot |
|---|---|
| CZT HV Monitor | 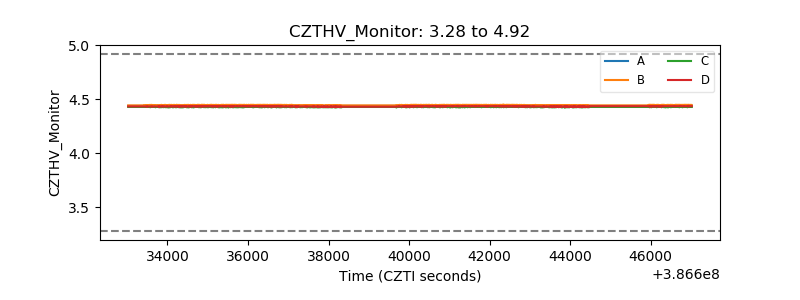 |
| D_VDD | 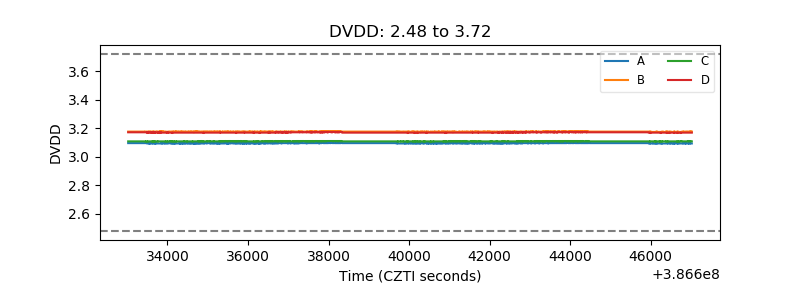 |
| Temperature 1 | 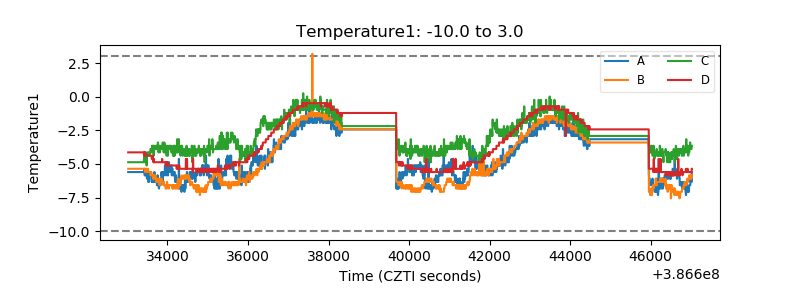 |
| Veto HV Monitor | 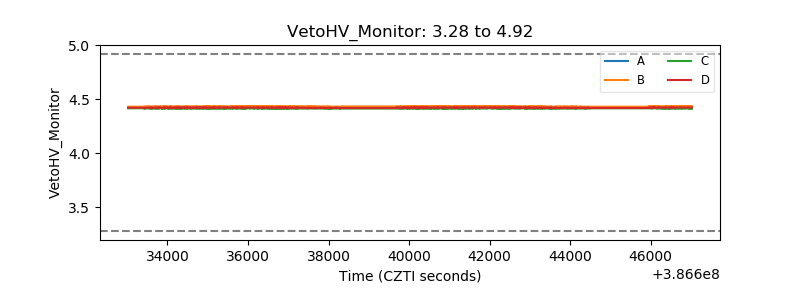 |
| Veto LLD | 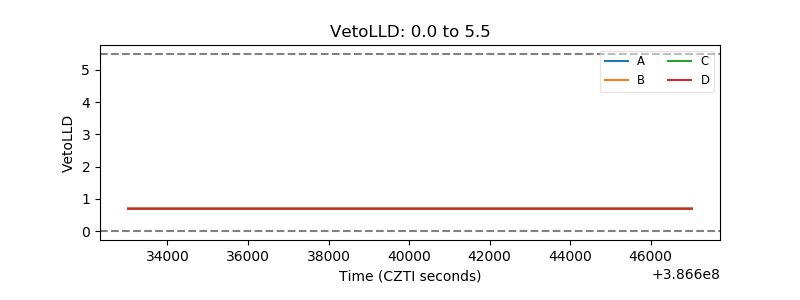 |
| Alpha Counter | 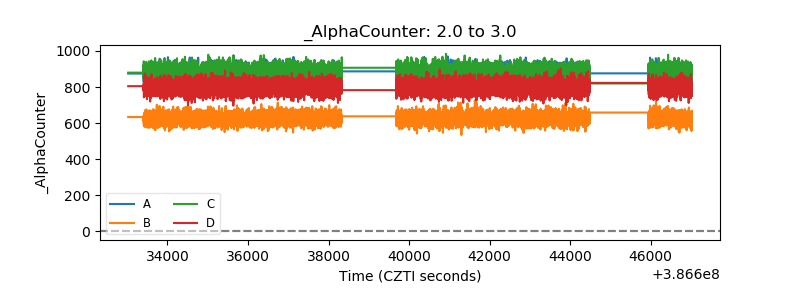 |
| _CPM_Rate | 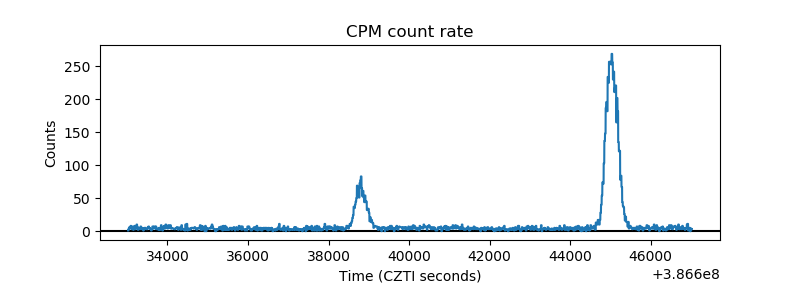 |
| CZT Counter | 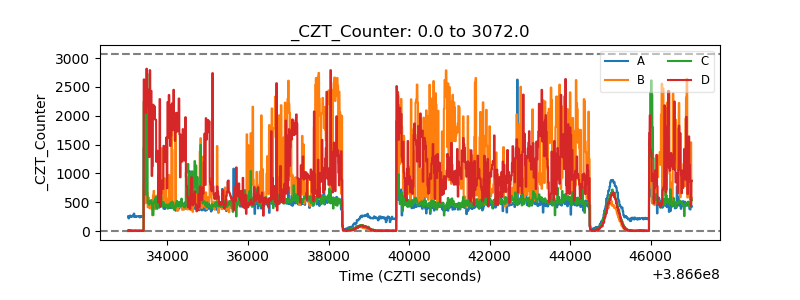 |
| +2.5 Volts monitor | 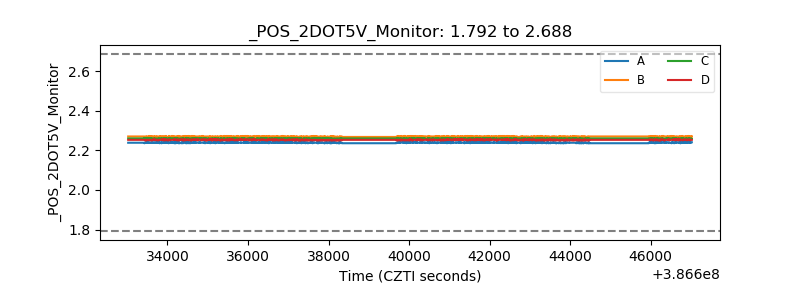 |
| +5 Volts monitor | 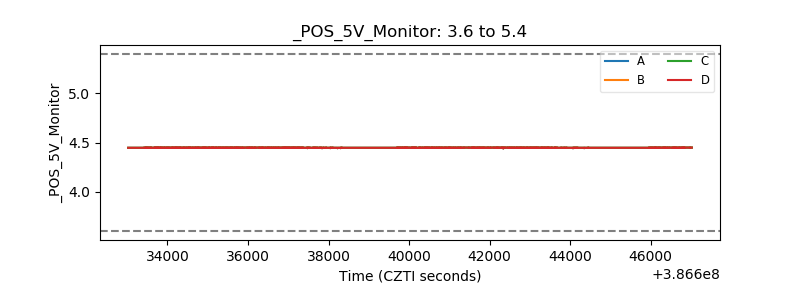 |
| _ROLL_ROT | 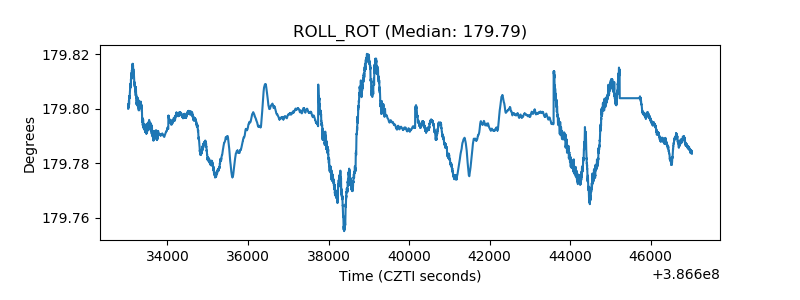 |
| _Roll_DEC | 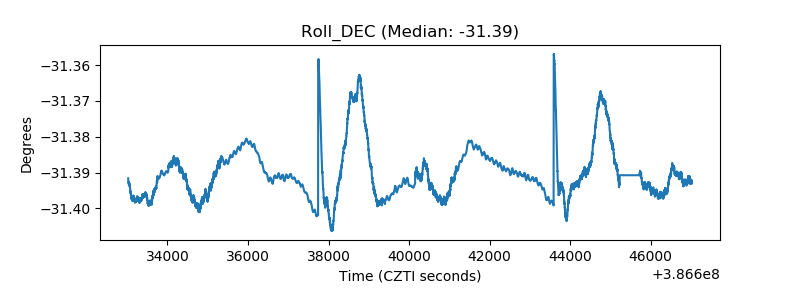 |
| _Roll_RA | 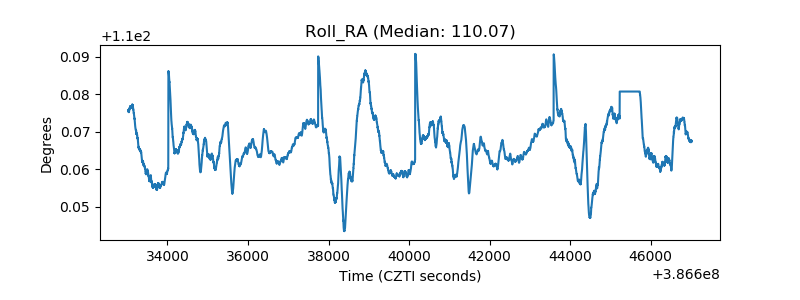 |
| Veto Counter | 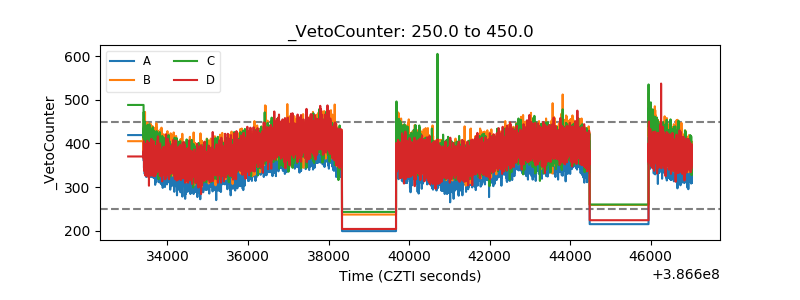 |