| Param | Original file | Final file |
|---|---|---|
| Filename | modeM0/AS1C07_004T01_9000005052_35207cztM0_level2.evt | modeM0/AS1C07_004T01_9000005052_35207cztM0_level2_quad_clean.evt |
| Size (bytes) | 588,741,120 | 67,864,320 |
| Size | 561.5 MB | 64.7 MB |
| Events in quadrant A | 2,573,284 | 442,482 |
| Events in quadrant B | 6,533,180 | 404,403 |
| Events in quadrant C | 3,044,001 | 429,115 |
| Events in quadrant D | 5,316,532 | 402,892 |
| Mode M0 | |||
|---|---|---|---|
| Quadrant | BADHDUFLAG | Total packets | Discarded packets |
| A | 0 | 11179 | 3 |
| B | 0 | 23130 | 2 |
| C | 0 | 12331 | 2 |
| D | 0 | 19528 | 2 |
| Mode SS | |||
|---|---|---|---|
| Quadrant | BADHDUFLAG | Total packets | Discarded packets |
| A | 0 | 108 | 0 |
| B | 0 | 108 | 0 |
| C | 0 | 108 | 0 |
| D | 0 | 108 | 0 |
| Mode M9 | |||
|---|---|---|---|
| Quadrant | BADHDUFLAG | Total packets | Discarded packets |
| A | 0 | 20 | 0 |
| B | 0 | 20 | 0 |
| C | 0 | 20 | 0 |
| D | 0 | 21 | 0 |
| Quadrant | Total seconds | Saturated seconds | Saturation percentage |
|---|---|---|---|
| A | 5370 | 12 | 0.223464% |
| B | 5370 | 1416 | 26.368715% |
| C | 5370 | 136 | 2.532588% |
| D | 5370 | 322 | 5.996276% |
Noise dominated data is calculated using 1-second bins in cleaned event files. If a bin has >2000 counts, and if more than 50% of those come from <1% of pixels, then it is considered to be noise-dominated and hence unusable.
| Quadrant | # 1 sec bins | Bins with >0 counts | Bins with >2000 counts | High rate bins dominated by noise | Noise dominated (total time) | Noise dominated (detector-on time) | Marked lightcurve |
|---|---|---|---|---|---|---|---|
| A | 7193 | 5371 | 2 | 2 | 0.03% | 0.04% | 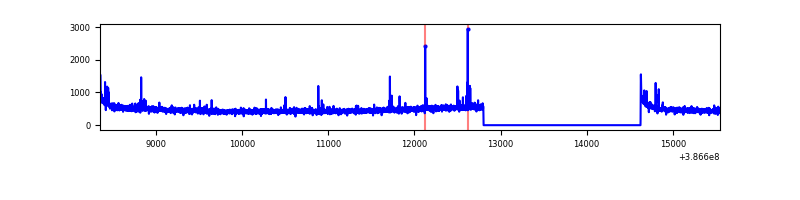 |
| B | 7193 | 5371 | 941 | 941 | 13.08% | 17.52% | 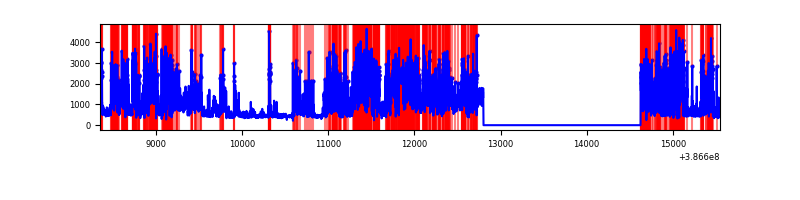 |
| C | 7193 | 5371 | 107 | 107 | 1.49% | 1.99% | 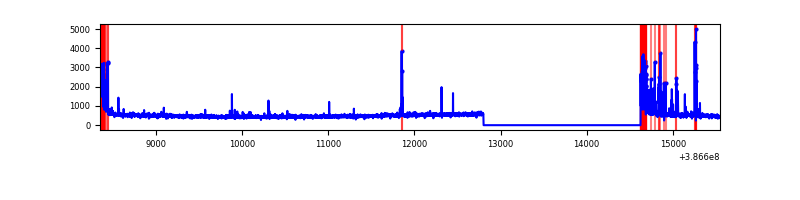 |
| D | 7193 | 5371 | 363 | 363 | 5.05% | 6.76% | 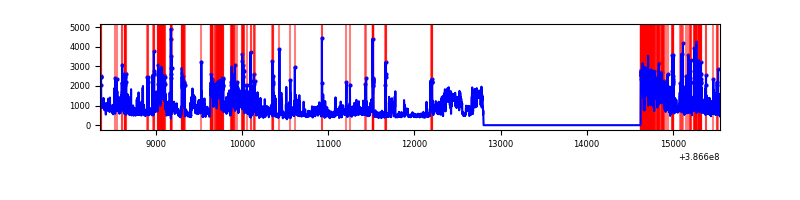 |
Top three noisy pixels from each quadrant. If the there are fewer than three noisy pixels in the level2.evt file, extra rows are filled as -1
| Pixel properties | Quadrant properties | ||||||
|---|---|---|---|---|---|---|---|
| Quadrant | DetID | PixID | Counts | Sigma | Mean | Median | Sigma |
| A | 10 | 83 | 103596 | 827.22 | 622 | 613 | 124.5 |
| A | 9 | 143 | 33730 | 266.02 | 622 | 613 | 124.5 |
| A | 13 | 6 | 10480 | 79.26 | 622 | 613 | 124.5 |
| B | 5 | 236 | 4236247 | 40068.85 | 555 | 541 | 105.7 |
| B | 4 | 232 | 86945 | 817.36 | 555 | 541 | 105.7 |
| B | 0 | 189 | 17692 | 162.24 | 555 | 541 | 105.7 |
| C | 0 | 10 | 365850 | 2667.84 | 592 | 597 | 136.9 |
| C | 15 | 214 | 223905 | 1631.06 | 592 | 597 | 136.9 |
| C | 1 | 23 | 91769 | 665.93 | 592 | 597 | 136.9 |
| D | 8 | 195 | 1746755 | 12072.14 | 589 | 573 | 144.6 |
| D | 1 | 47 | 472694 | 3263.98 | 589 | 573 | 144.6 |
| D | 10 | 118 | 291234 | 2009.47 | 589 | 573 | 144.6 |
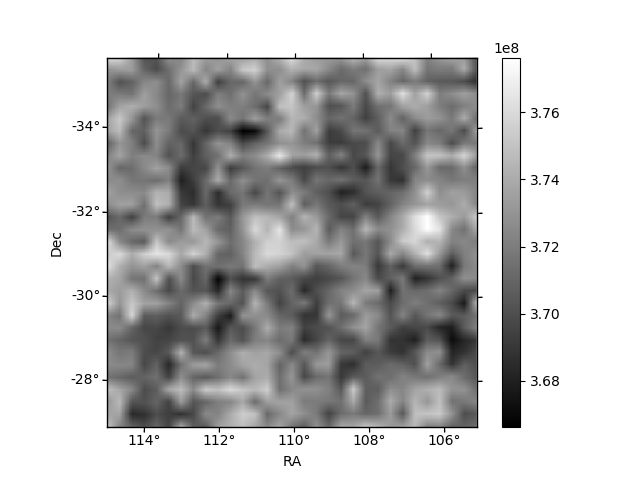
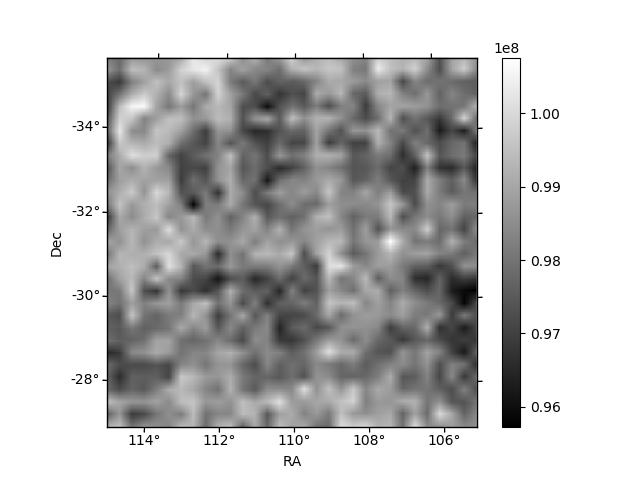
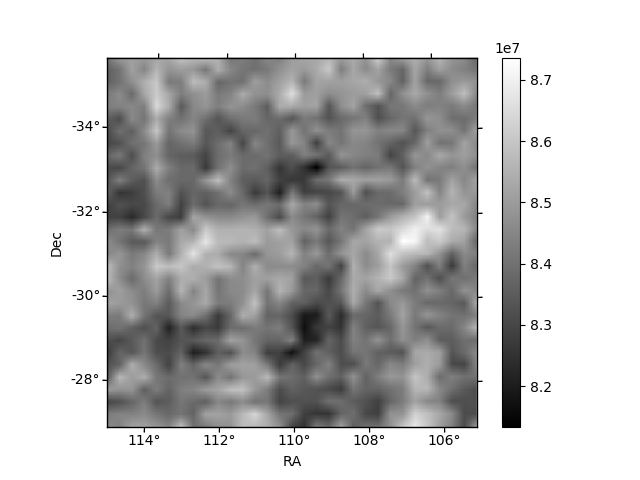
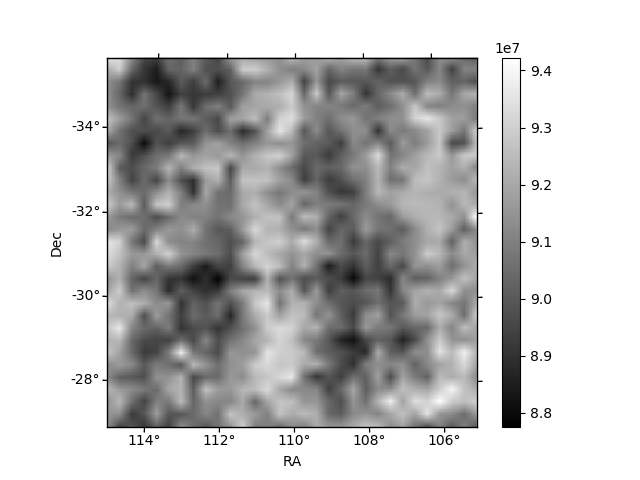
Histogram calculated using DETX and DETY for each event in the final _common_clean file
| Quadrant A | 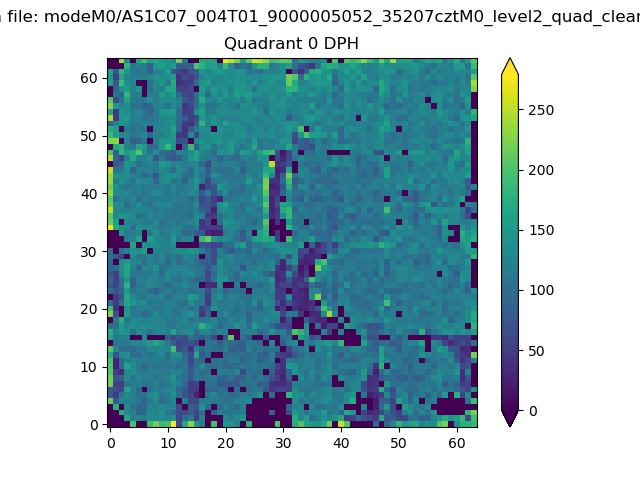 |
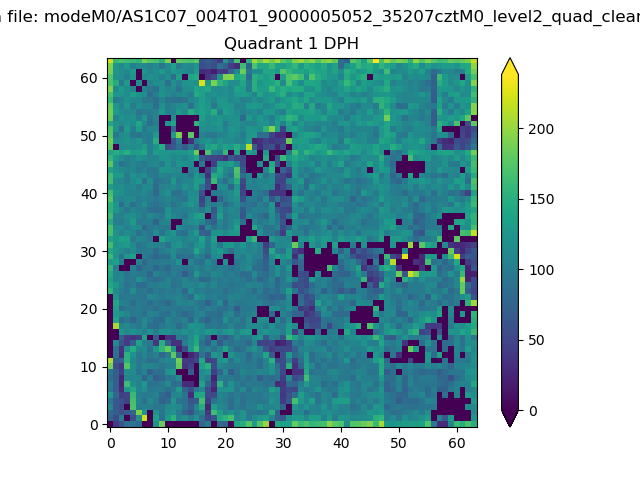 |
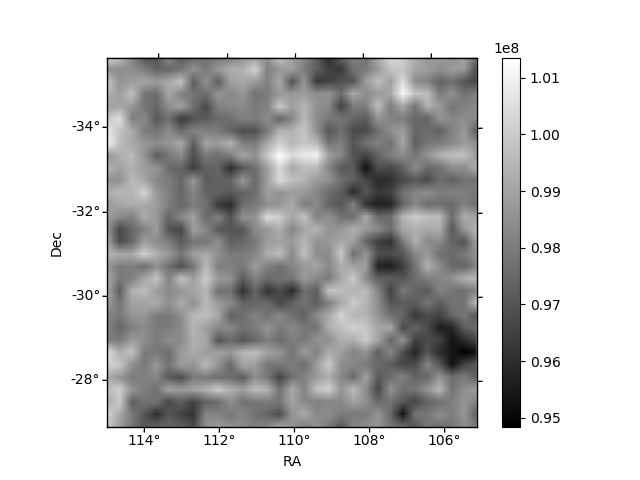
Quadrant B |
|---|---|---|---|
| Quadrant D | 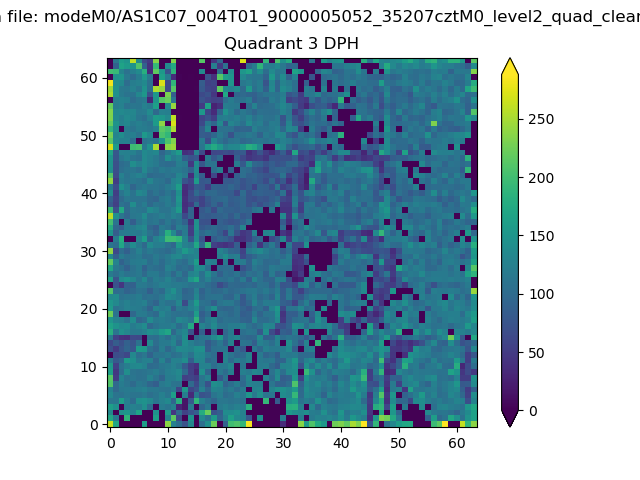 |
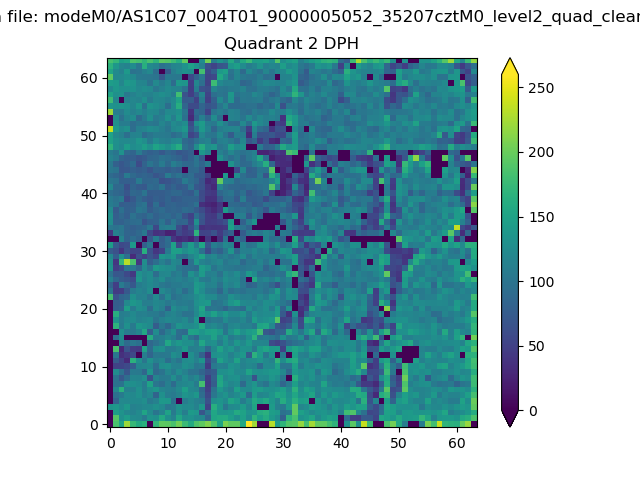 |
Quadrant C |
| Plot type | Count rate plots | Images |
|---|---|---|
| Comparison with Poisson distribution Blue bars denote a histogram of data divided into 1 sec bins. Red curve is a Poisson curve with rate = median count rate of data. |
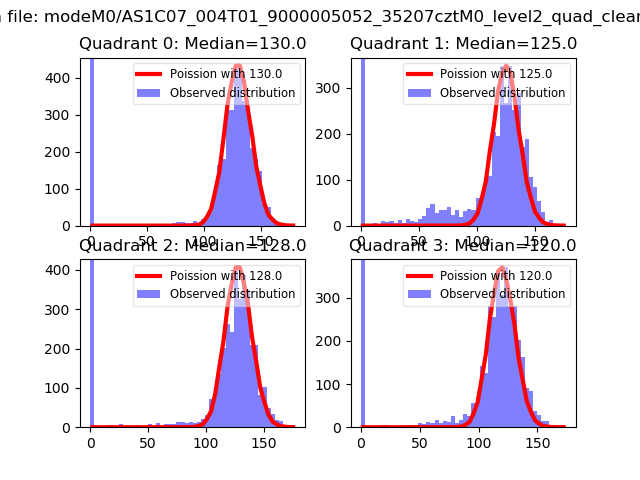 |
 |
| Quadrant-wise count rates Data is divided into 100 sec bins |
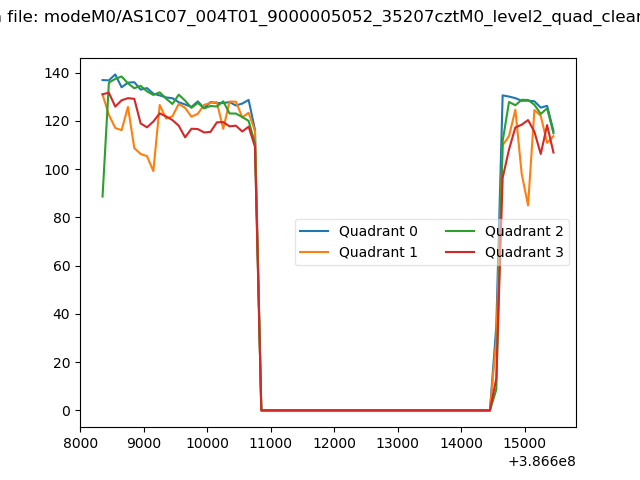 |
|
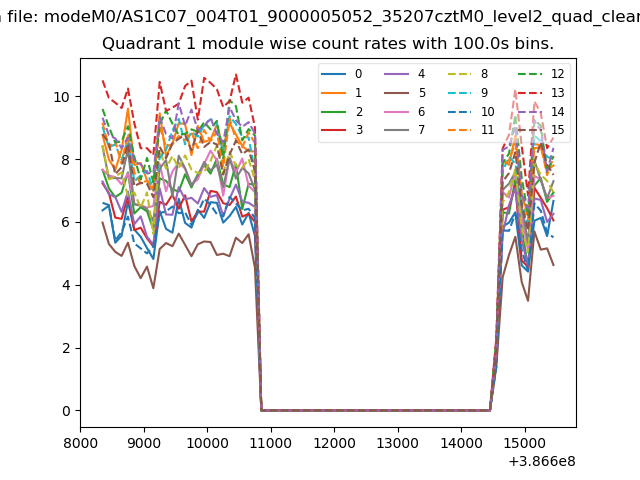
| Module-wise count rates for Quadrant A Data is divided into 100 sec bins |
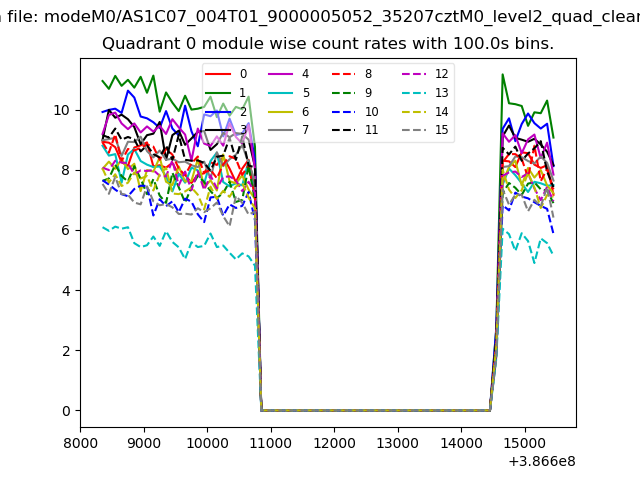 |
 |
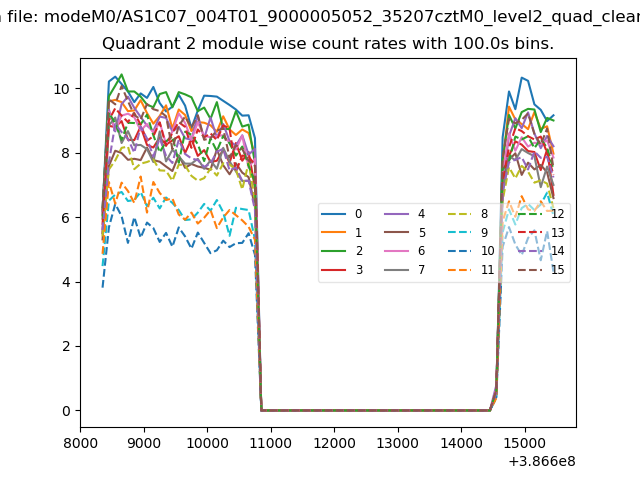
| Module-wise count rates for Quadrant B Data is divided into 100 sec bins |
 |
 |
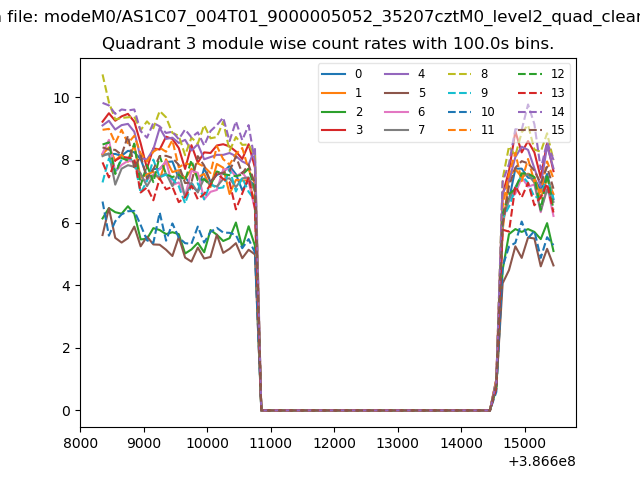
| Module-wise count rates for Quadrant C Data is divided into 100 sec bins |
 |
 |
| Module-wise count rates for Quadrant D Data is divided into 100 sec bins |
 |
 |
| Parameter | Plot |
|---|---|
| CZT HV Monitor | 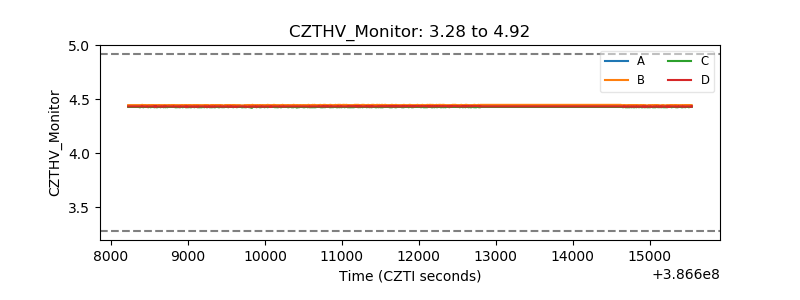 |
| D_VDD | 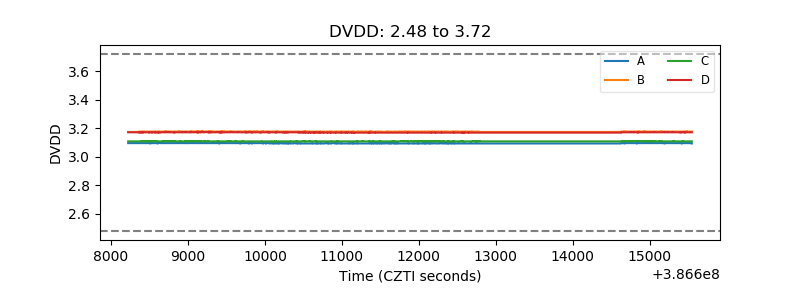 |
| Temperature 1 | 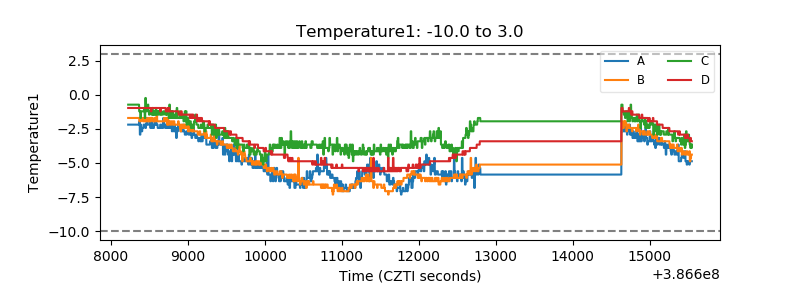 |
| Veto HV Monitor | 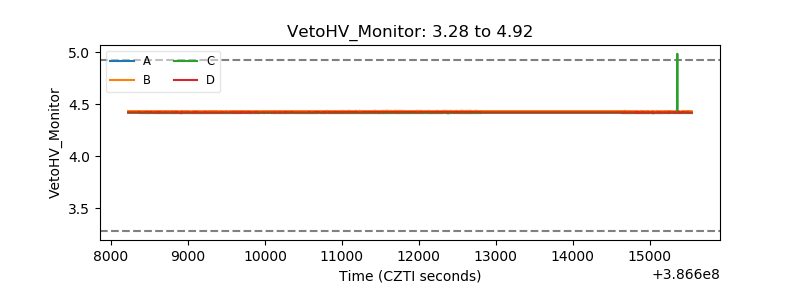 |
| Veto LLD | 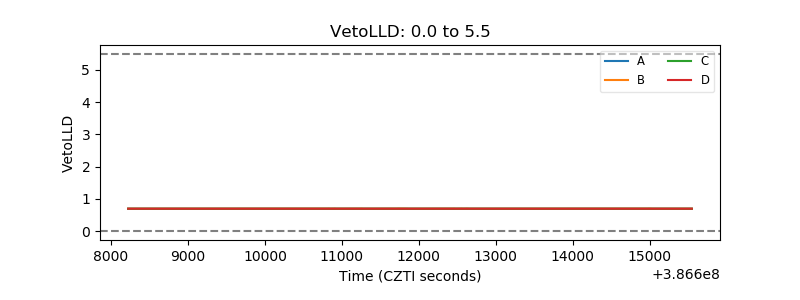 |
| Alpha Counter | 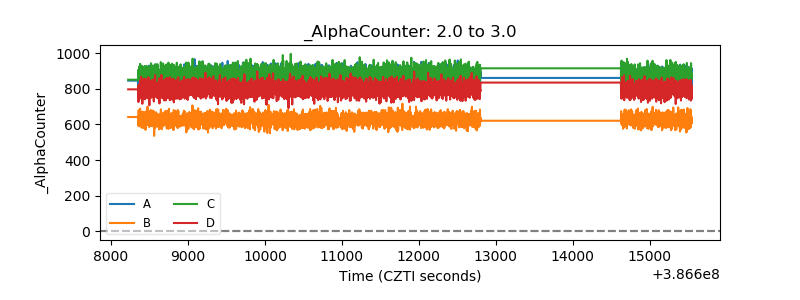 |
| _CPM_Rate | 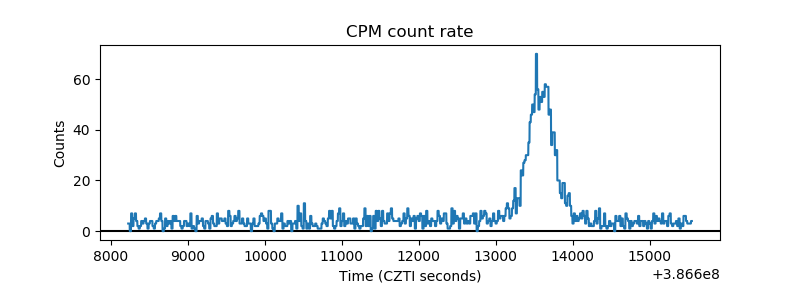 |
| CZT Counter | 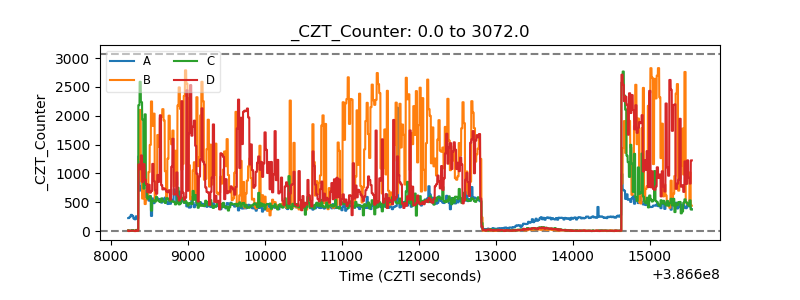 |
| +2.5 Volts monitor | 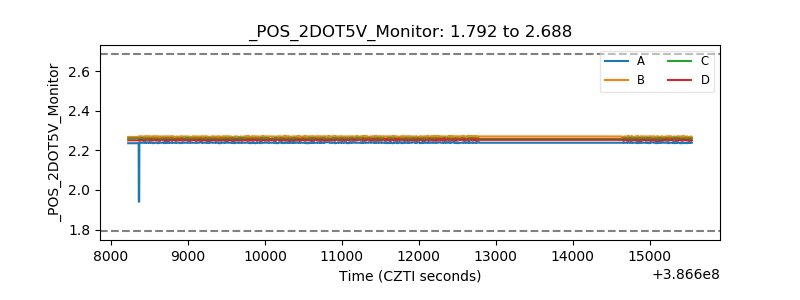 |
| +5 Volts monitor | 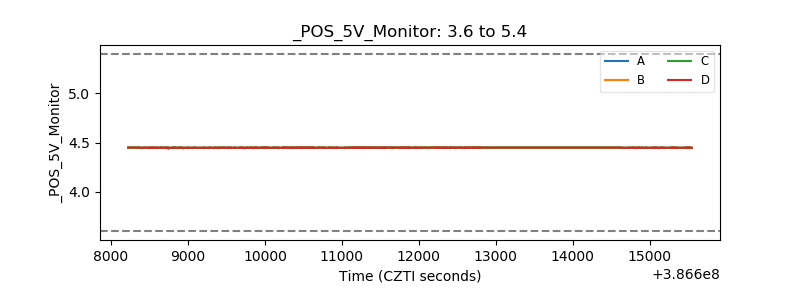 |
| _ROLL_ROT | 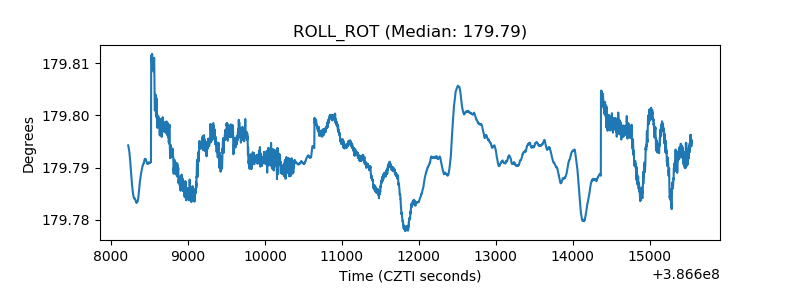 |
| _Roll_DEC | 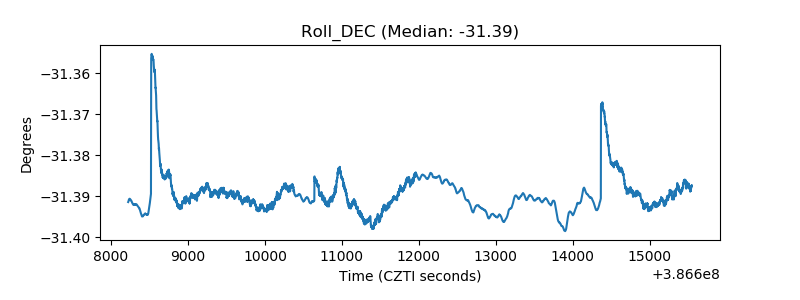 |
| _Roll_RA | 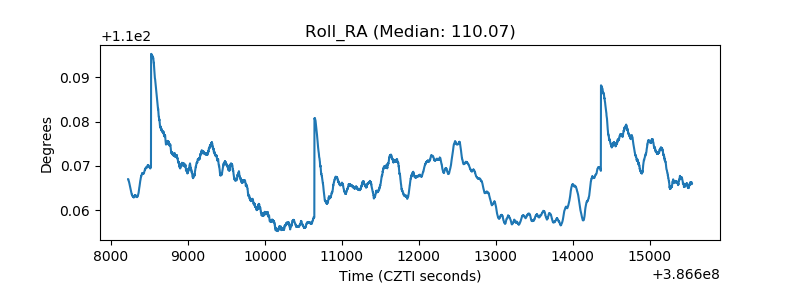 |
| Veto Counter | 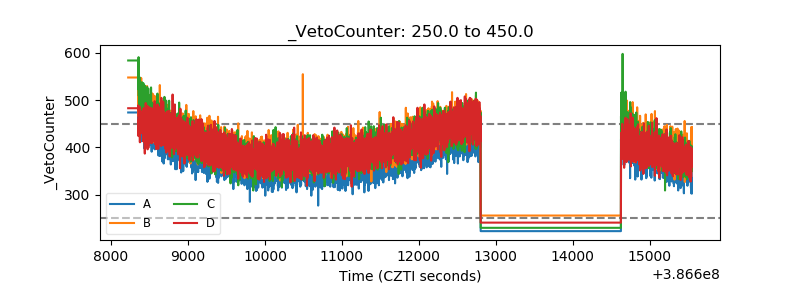 |