| Param | Original file | Final file |
|---|---|---|
| Filename | modeM0/AS1C07_004T01_9000005052_35206cztM0_level2.evt | modeM0/AS1C07_004T01_9000005052_35206cztM0_level2_quad_clean.evt |
| Size (bytes) | 523,820,160 | 73,811,520 |
| Size | 499.6 MB | 70.4 MB |
| Events in quadrant A | 2,414,755 | 501,415 |
| Events in quadrant B | 5,765,489 | 446,823 |
| Events in quadrant C | 2,781,300 | 480,754 |
| Events in quadrant D | 4,570,856 | 462,337 |
| Mode M0 | |||
|---|---|---|---|
| Quadrant | BADHDUFLAG | Total packets | Discarded packets |
| A | 0 | 10204 | 2 |
| B | 0 | 20457 | 1 |
| C | 0 | 11143 | 1 |
| D | 0 | 17038 | 1 |
| Mode SS | |||
|---|---|---|---|
| Quadrant | BADHDUFLAG | Total packets | Discarded packets |
| A | 0 | 100 | 0 |
| B | 0 | 100 | 0 |
| C | 0 | 100 | 0 |
| D | 0 | 100 | 0 |
| Mode M9 | |||
|---|---|---|---|
| Quadrant | BADHDUFLAG | Total packets | Discarded packets |
| A | 0 | 21 | 0 |
| B | 0 | 21 | 0 |
| C | 0 | 21 | 0 |
| D | 0 | 21 | 0 |
| Quadrant | Total seconds | Saturated seconds | Saturation percentage |
|---|---|---|---|
| A | 4893 | 12 | 0.245248% |
| B | 4893 | 1191 | 24.340895% |
| C | 4893 | 147 | 3.004292% |
| D | 4893 | 165 | 3.372164% |
Noise dominated data is calculated using 1-second bins in cleaned event files. If a bin has >2000 counts, and if more than 50% of those come from <1% of pixels, then it is considered to be noise-dominated and hence unusable.
| Quadrant | # 1 sec bins | Bins with >0 counts | Bins with >2000 counts | High rate bins dominated by noise | Noise dominated (total time) | Noise dominated (detector-on time) | Marked lightcurve |
|---|---|---|---|---|---|---|---|
| A | 6984 | 4894 | 6 | 6 | 0.09% | 0.12% | 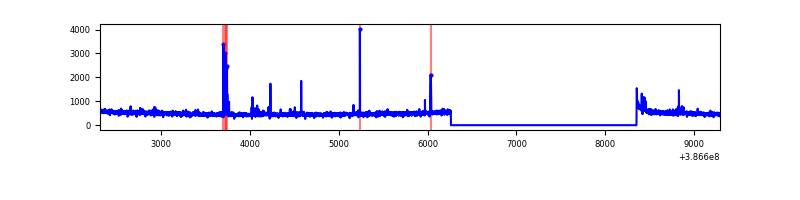 |
| B | 6984 | 4894 | 818 | 818 | 11.71% | 16.71% | 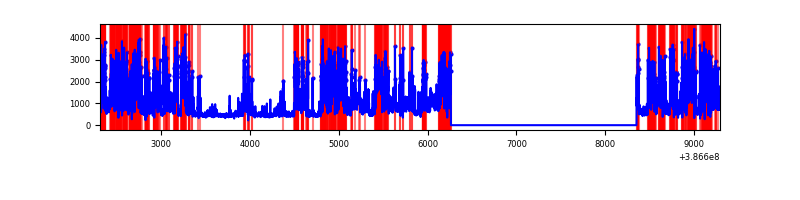 |
| C | 6984 | 4894 | 117 | 117 | 1.68% | 2.39% | 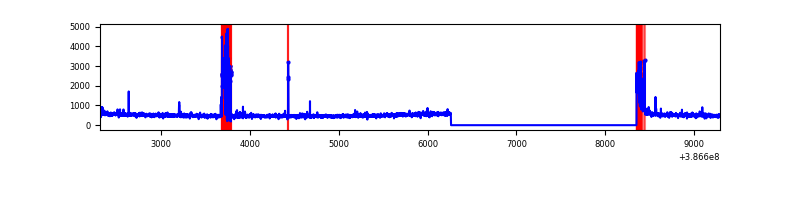 |
| D | 6984 | 4894 | 211 | 211 | 3.02% | 4.31% | 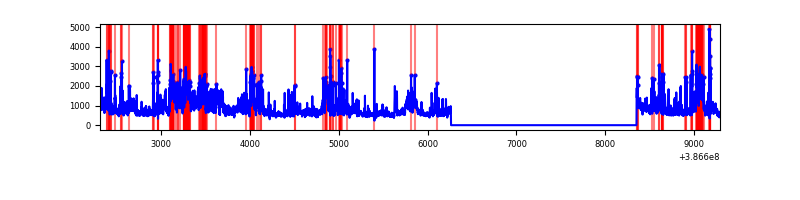 |
Top three noisy pixels from each quadrant. If the there are fewer than three noisy pixels in the level2.evt file, extra rows are filled as -1
| Pixel properties | Quadrant properties | ||||||
|---|---|---|---|---|---|---|---|
| Quadrant | DetID | PixID | Counts | Sigma | Mean | Median | Sigma |
| A | 10 | 83 | 73472 | 617.03 | 585 | 576 | 118.1 |
| A | 10 | 255 | 33876 | 281.87 | 585 | 576 | 118.1 |
| A | 9 | 143 | 22718 | 187.42 | 585 | 576 | 118.1 |
| B | 5 | 236 | 3644563 | 36698.12 | 524 | 513 | 99.3 |
| B | 4 | 232 | 29639 | 293.32 | 524 | 513 | 99.3 |
| B | 5 | 172 | 16341 | 159.4 | 524 | 513 | 99.3 |
| C | 9 | 187 | 215265 | 1697.13 | 547 | 552 | 126.5 |
| C | 15 | 214 | 201442 | 1587.87 | 547 | 552 | 126.5 |
| C | 0 | 10 | 169583 | 1336.05 | 547 | 552 | 126.5 |
| D | 8 | 195 | 1431221 | 10529.76 | 557 | 543 | 135.9 |
| D | 1 | 47 | 415911 | 3057.1 | 557 | 543 | 135.9 |
| D | 10 | 118 | 167516 | 1228.92 | 557 | 543 | 135.9 |
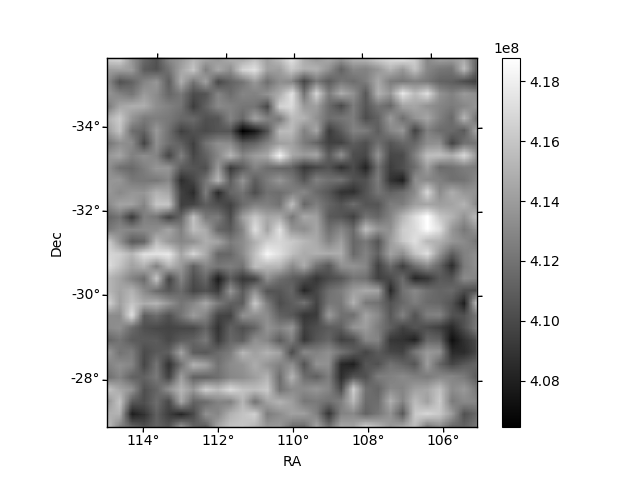
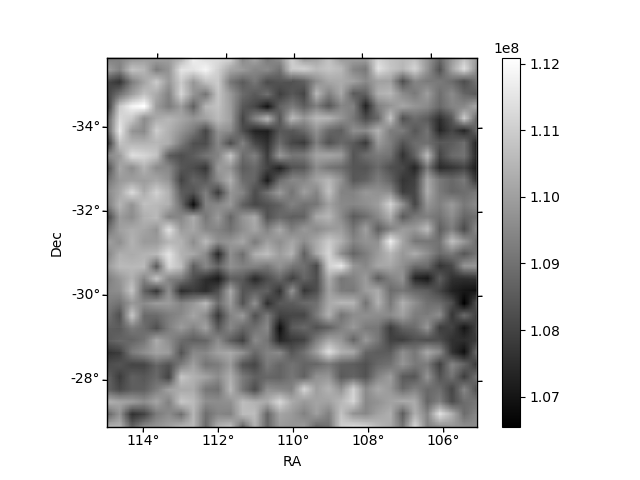
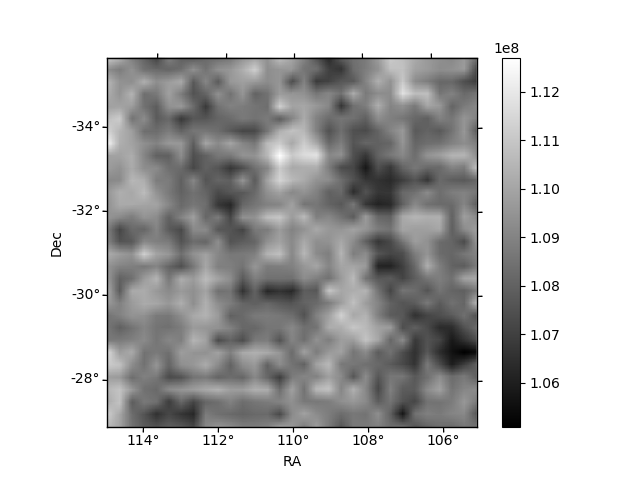
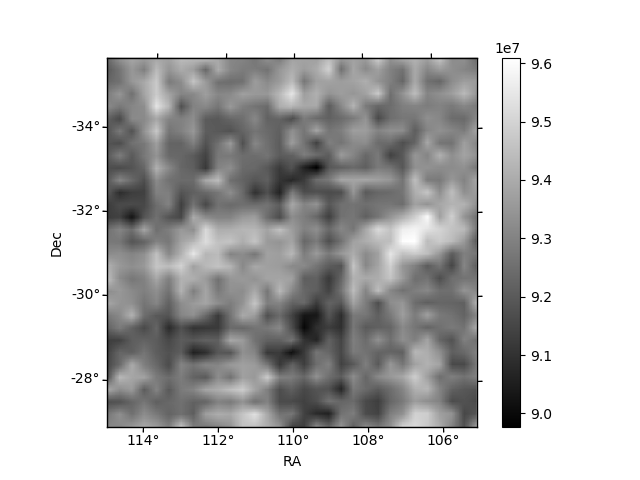
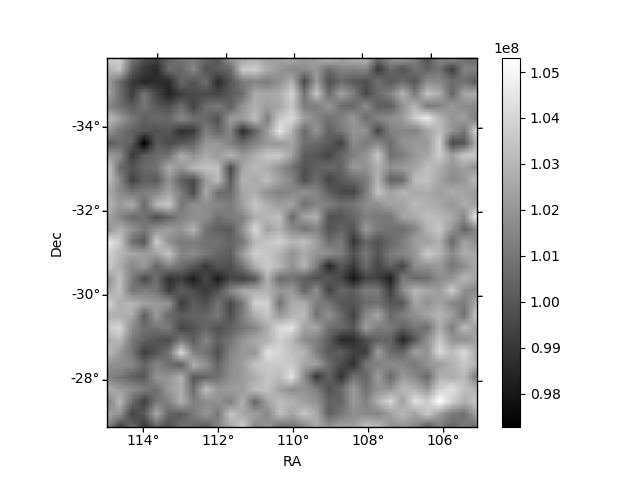
Histogram calculated using DETX and DETY for each event in the final _common_clean file
| Quadrant A | 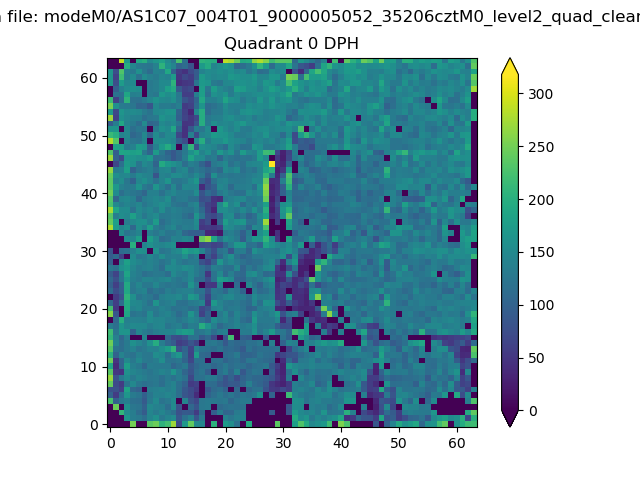 |
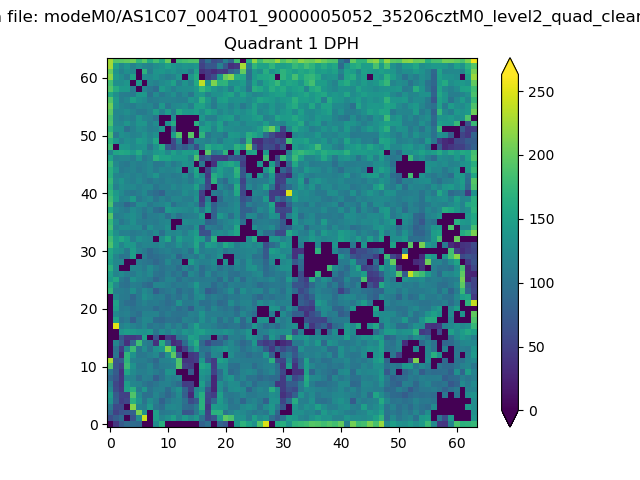 |
Quadrant B |
|---|---|---|---|
| Quadrant D | 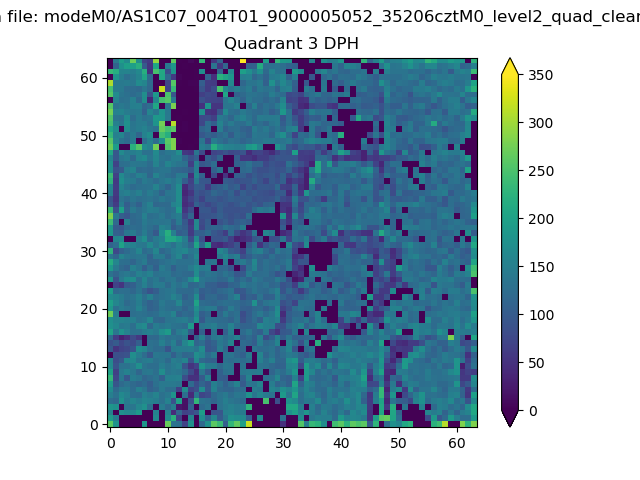 |
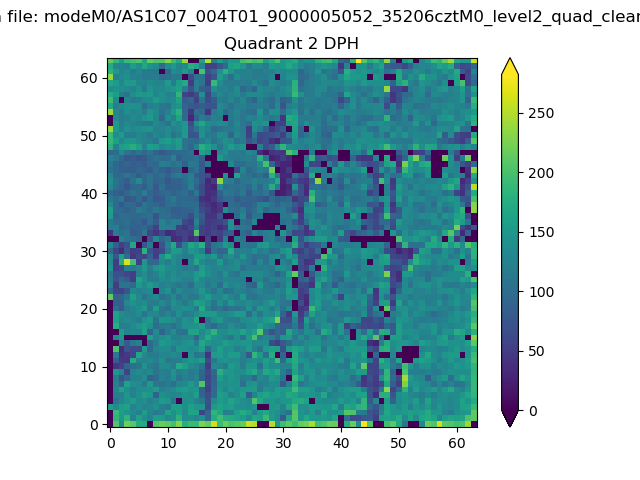 |
Quadrant C |
| Plot type | Count rate plots | Images |
|---|---|---|
| Comparison with Poisson distribution Blue bars denote a histogram of data divided into 1 sec bins. Red curve is a Poisson curve with rate = median count rate of data. |
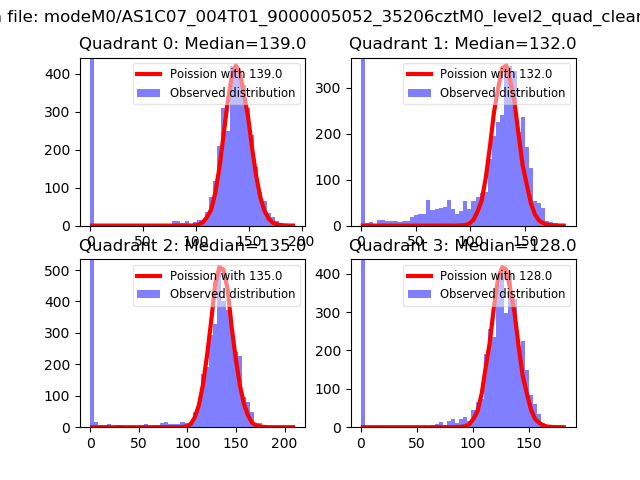 |
 |
| Quadrant-wise count rates Data is divided into 100 sec bins |
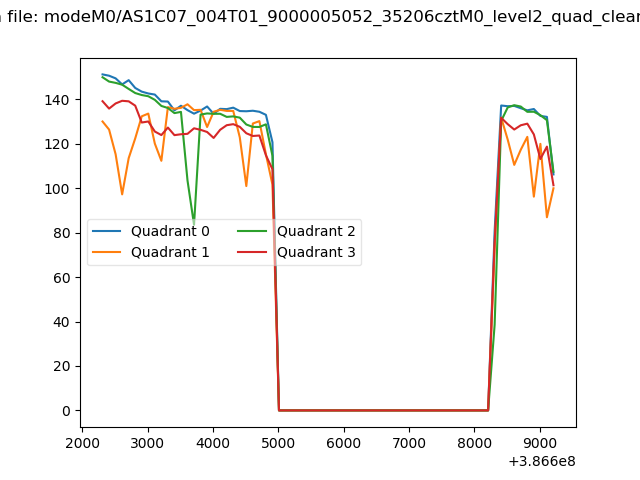 |
|
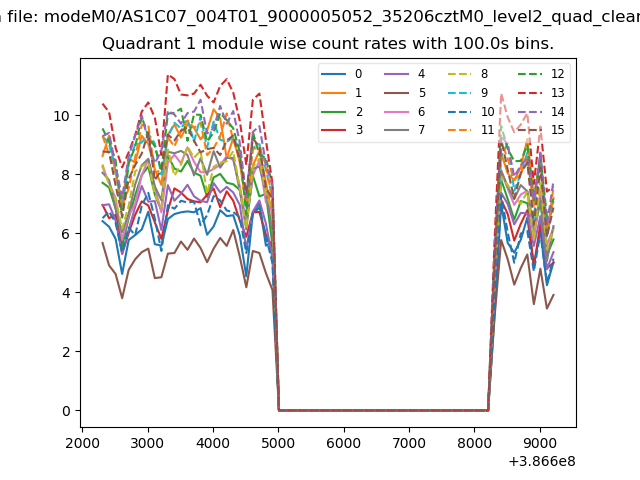
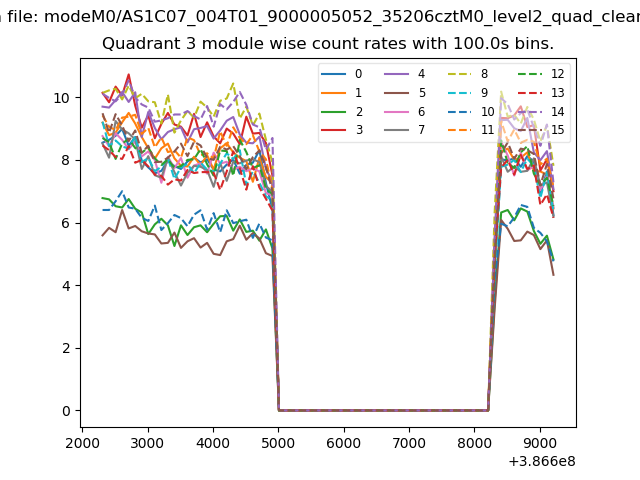
| Module-wise count rates for Quadrant A Data is divided into 100 sec bins |
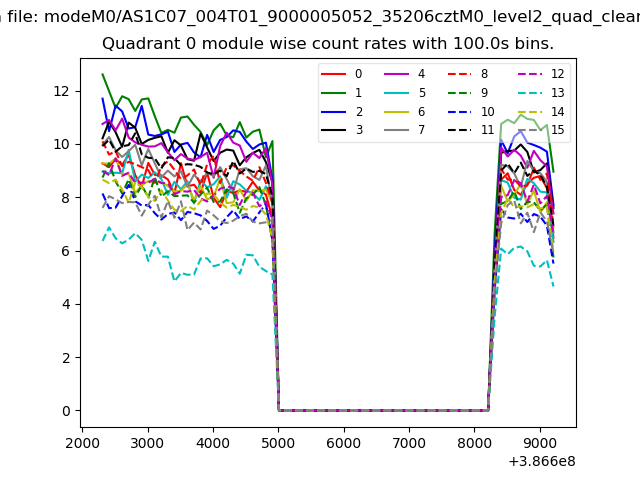 |
 |
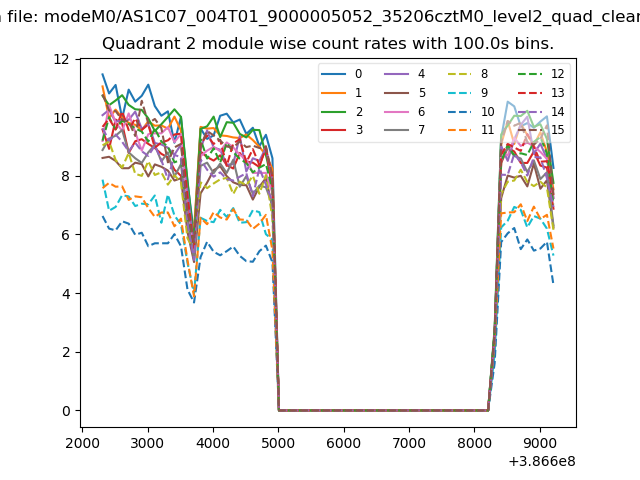
| Module-wise count rates for Quadrant B Data is divided into 100 sec bins |
 |
 |
| Module-wise count rates for Quadrant C Data is divided into 100 sec bins |
 |
 |
| Module-wise count rates for Quadrant D Data is divided into 100 sec bins |
 |
 |
| Parameter | Plot |
|---|---|
| CZT HV Monitor | 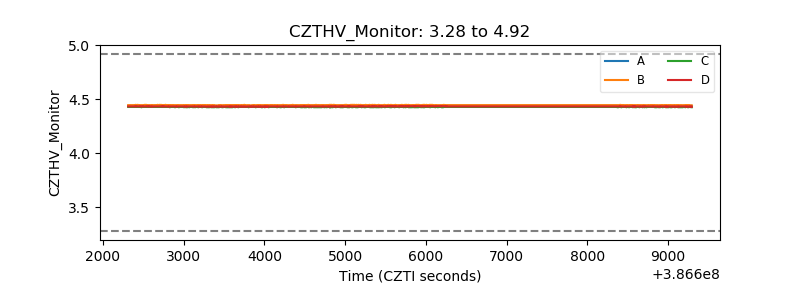 |
| D_VDD | 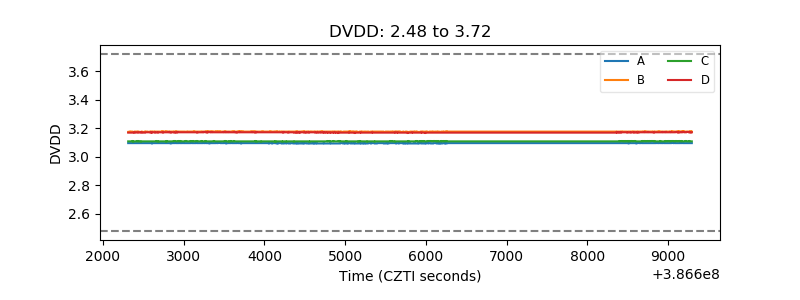 |
| Temperature 1 | 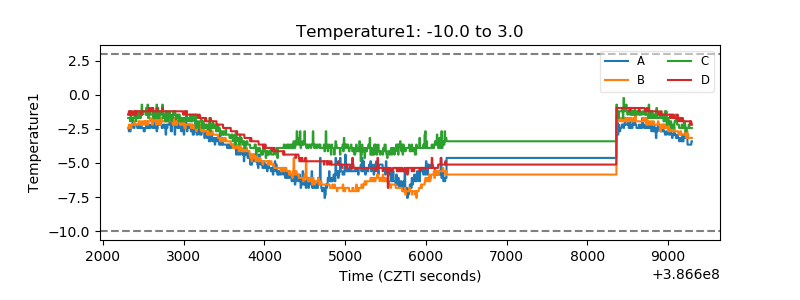 |
| Veto HV Monitor |  |
| Veto LLD | 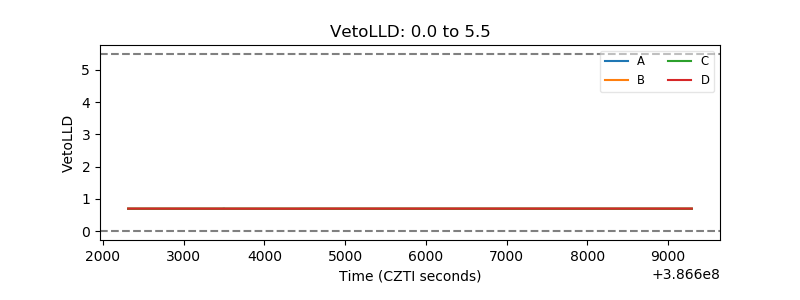 |
| Alpha Counter | 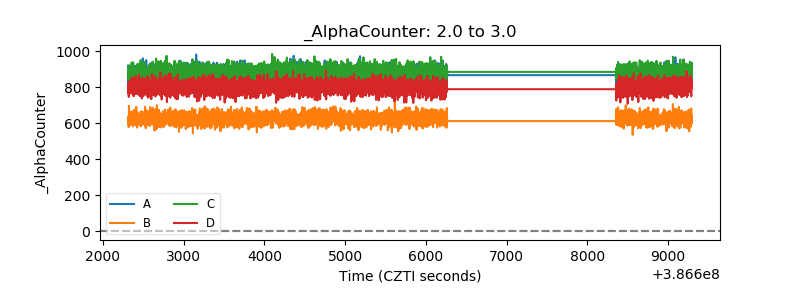 |
| _CPM_Rate | 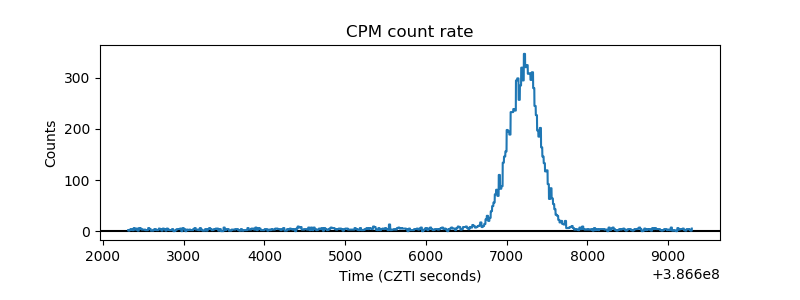 |
| CZT Counter | 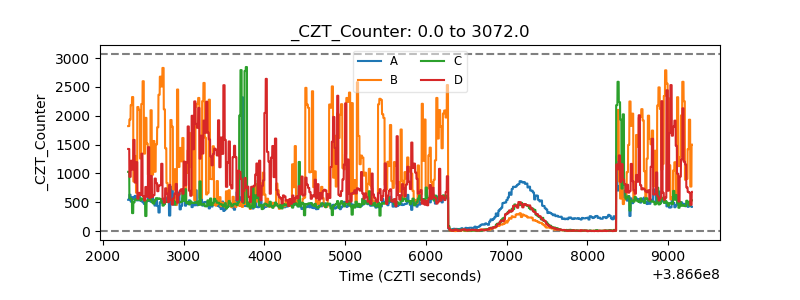 |
| +2.5 Volts monitor | 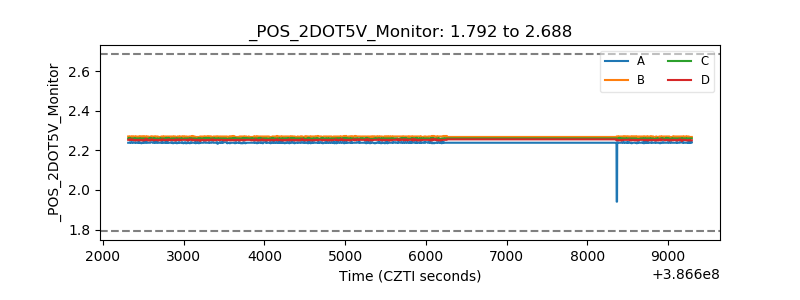 |
| +5 Volts monitor | 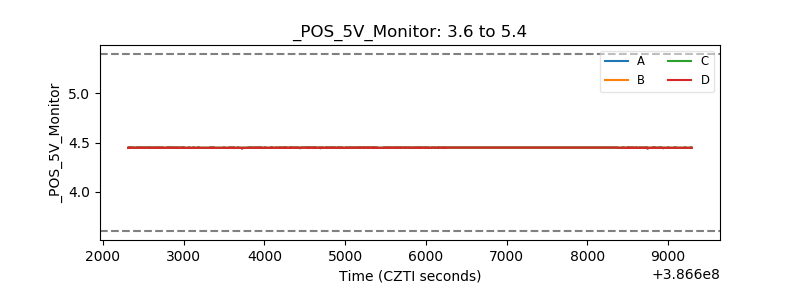 |
| _ROLL_ROT | 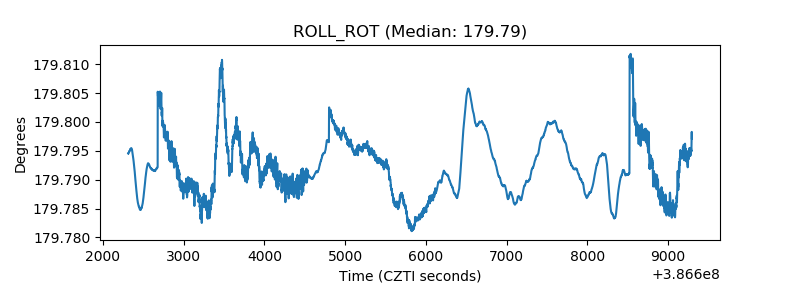 |
| _Roll_DEC | 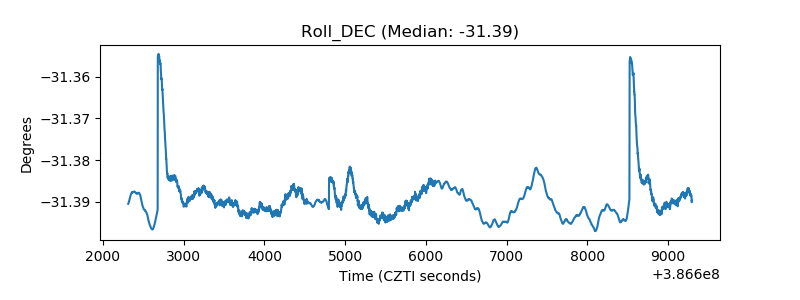 |
| _Roll_RA | 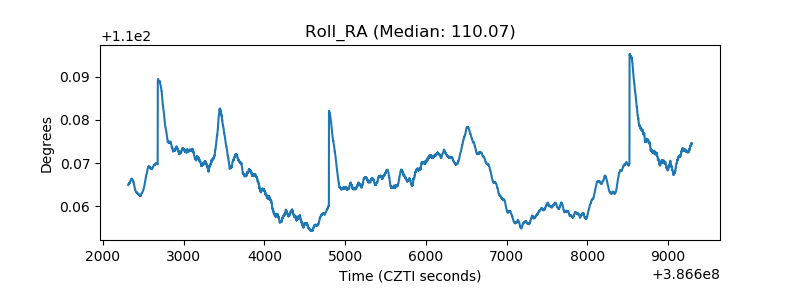 |
| Veto Counter | 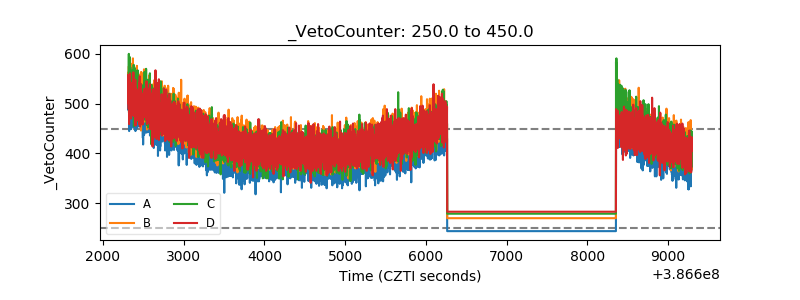 |