| Param | Original file | Final file |
|---|---|---|
| Filename | modeM0/AS1C07_004T01_9000005052_35204cztM0_level2.evt | modeM0/AS1C07_004T01_9000005052_35204cztM0_level2_quad_clean.evt |
| Size (bytes) | 689,169,600 | 95,276,160 |
| Size | 657.2 MB | 90.9 MB |
| Events in quadrant A | 2,831,903 | 696,102 |
| Events in quadrant B | 8,248,887 | 549,674 |
| Events in quadrant C | 3,114,693 | 680,148 |
| Events in quadrant D | 6,345,464 | 614,398 |
| Mode M0 | |||
|---|---|---|---|
| Quadrant | BADHDUFLAG | Total packets | Discarded packets |
| A | 0 | 11606 | 3 |
| B | 0 | 27950 | 2 |
| C | 0 | 12267 | 2 |
| D | 0 | 22360 | 2 |
| Mode SS | |||
|---|---|---|---|
| Quadrant | BADHDUFLAG | Total packets | Discarded packets |
| A | 0 | 100 | 0 |
| B | 0 | 100 | 0 |
| C | 0 | 100 | 0 |
| D | 0 | 100 | 0 |
| Mode M9 | |||
|---|---|---|---|
| Quadrant | BADHDUFLAG | Total packets | Discarded packets |
| A | 0 | 24 | 0 |
| B | 0 | 24 | 0 |
| C | 0 | 24 | 0 |
| D | 0 | 25 | 0 |
| Quadrant | Total seconds | Saturated seconds | Saturation percentage |
|---|---|---|---|
| A | 4903 | 20 | 0.407914% |
| B | 4903 | 2338 | 47.685091% |
| C | 4903 | 163 | 3.324495% |
| D | 4903 | 590 | 12.033449% |
Noise dominated data is calculated using 1-second bins in cleaned event files. If a bin has >2000 counts, and if more than 50% of those come from <1% of pixels, then it is considered to be noise-dominated and hence unusable.
| Quadrant | # 1 sec bins | Bins with >0 counts | Bins with >2000 counts | High rate bins dominated by noise | Noise dominated (total time) | Noise dominated (detector-on time) | Marked lightcurve |
|---|---|---|---|---|---|---|---|
| A | 7026 | 4904 | 6 | 6 | 0.09% | 0.12% | 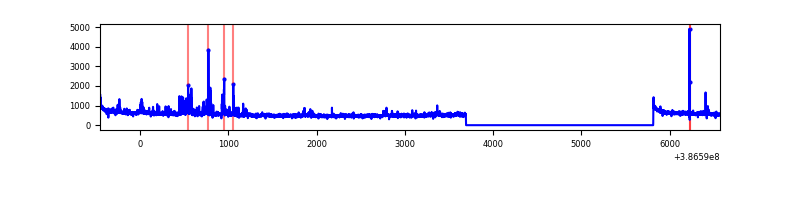 |
| B | 7026 | 4904 | 1663 | 1663 | 23.67% | 33.91% | 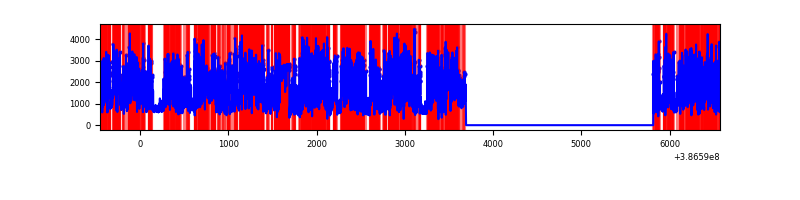 |
| C | 7026 | 4904 | 118 | 118 | 1.68% | 2.41% | 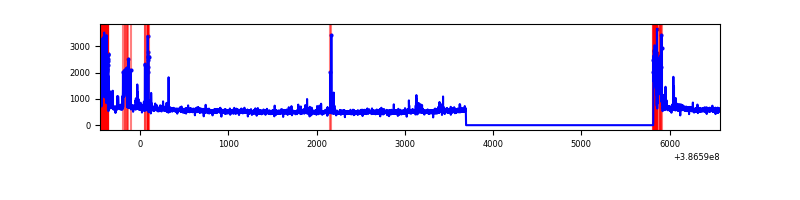 |
| D | 7026 | 4904 | 574 | 574 | 8.17% | 11.70% | 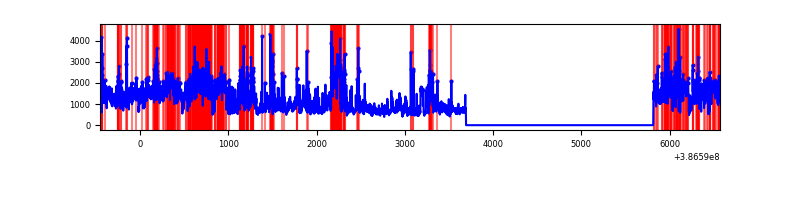 |
Top three noisy pixels from each quadrant. If the there are fewer than three noisy pixels in the level2.evt file, extra rows are filled as -1
| Pixel properties | Quadrant properties | ||||||
|---|---|---|---|---|---|---|---|
| Quadrant | DetID | PixID | Counts | Sigma | Mean | Median | Sigma |
| A | 14 | 250 | 178099 | 1379.21 | 651 | 641 | 128.7 |
| A | 10 | 83 | 94765 | 731.53 | 651 | 641 | 128.7 |
| A | 13 | 6 | 21129 | 159.23 | 651 | 641 | 128.7 |
| B | 5 | 236 | 5725954 | 57955.86 | 524 | 513 | 98.8 |
| B | 5 | 200 | 325237 | 3287.02 | 524 | 513 | 98.8 |
| B | 4 | 232 | 59821 | 600.35 | 524 | 513 | 98.8 |
| C | 0 | 10 | 333137 | 2389.76 | 611 | 617 | 139.1 |
| C | 15 | 214 | 207115 | 1484.06 | 611 | 617 | 139.1 |
| C | 1 | 23 | 152232 | 1089.63 | 611 | 617 | 139.1 |
| D | 8 | 195 | 2822399 | 19248.67 | 609 | 595 | 146.6 |
| D | 10 | 118 | 386250 | 2630.71 | 609 | 595 | 146.6 |
| D | 7 | 80 | 154228 | 1047.99 | 609 | 595 | 146.6 |
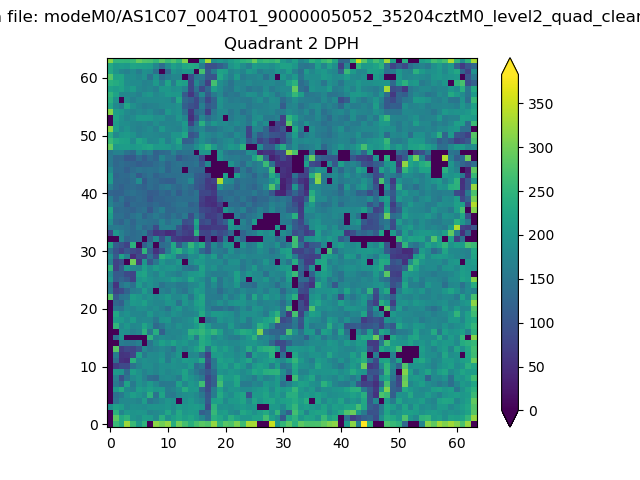
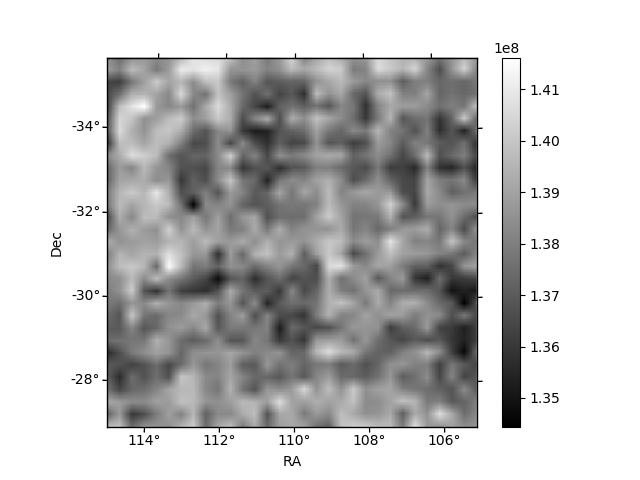
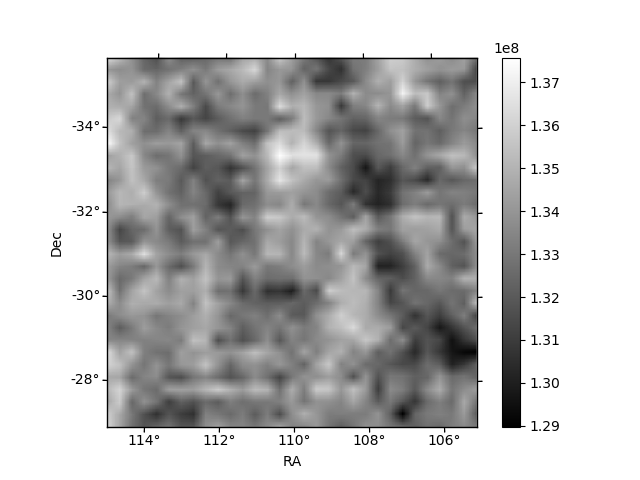
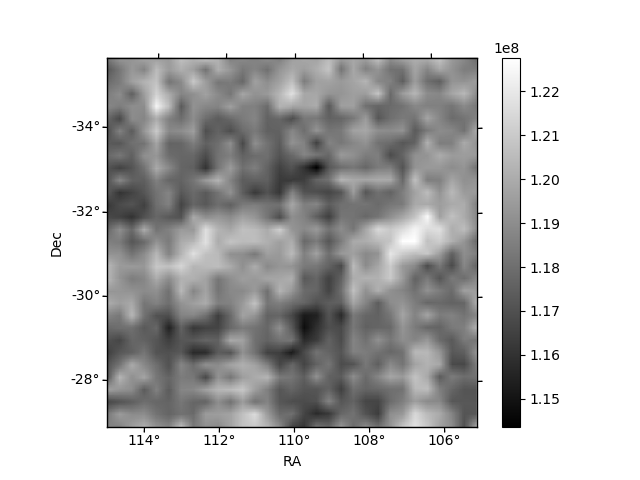
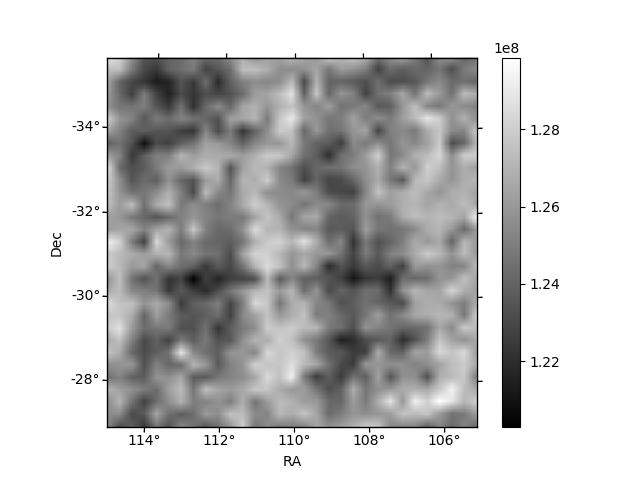
Histogram calculated using DETX and DETY for each event in the final _common_clean file
| Quadrant A | 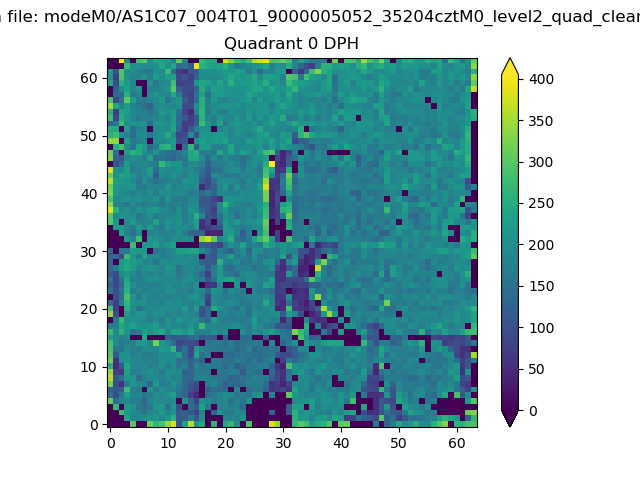 |
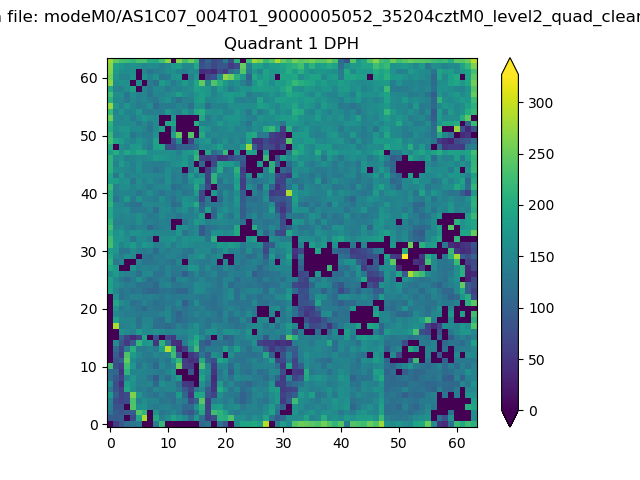 |
Quadrant B |
|---|---|---|---|
| Quadrant D | 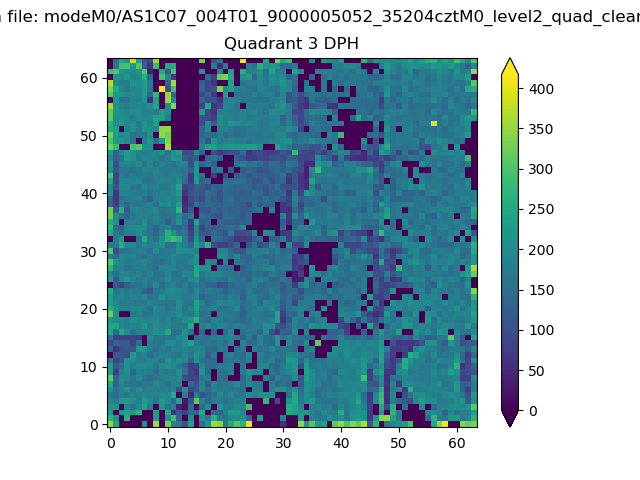 |
 |
Quadrant C |
| Plot type | Count rate plots | Images |
|---|---|---|
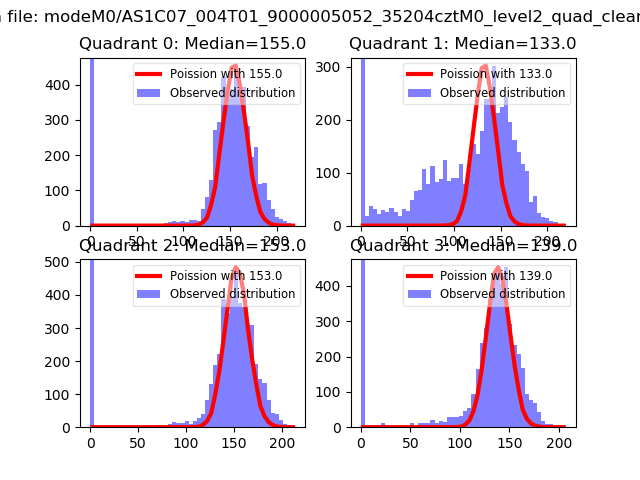
| Comparison with Poisson distribution Blue bars denote a histogram of data divided into 1 sec bins. Red curve is a Poisson curve with rate = median count rate of data. |
 |
 |
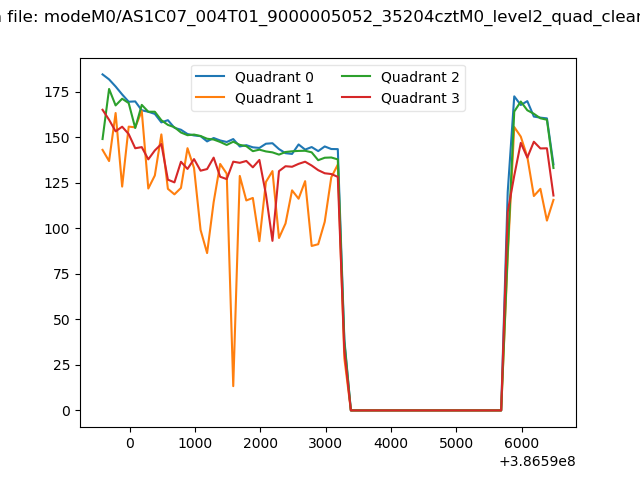
| Quadrant-wise count rates Data is divided into 100 sec bins |
 |
|
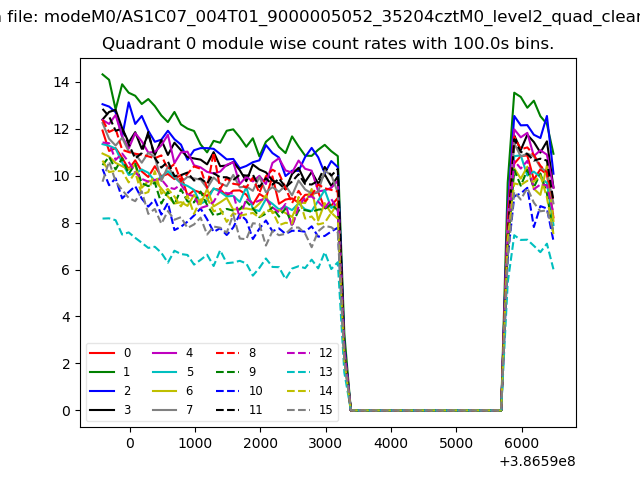
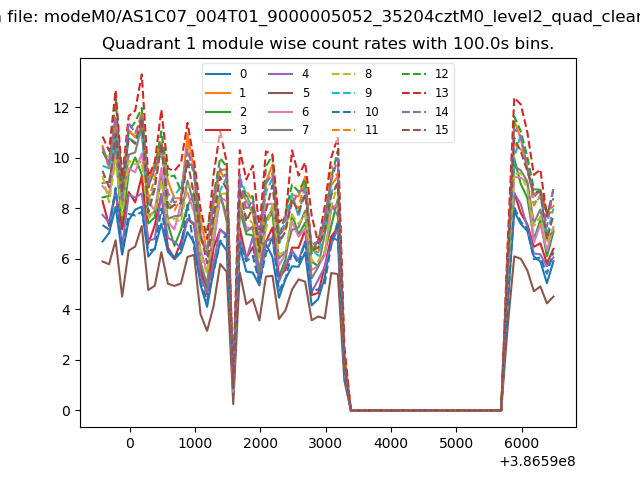
| Module-wise count rates for Quadrant A Data is divided into 100 sec bins |
 |
 |
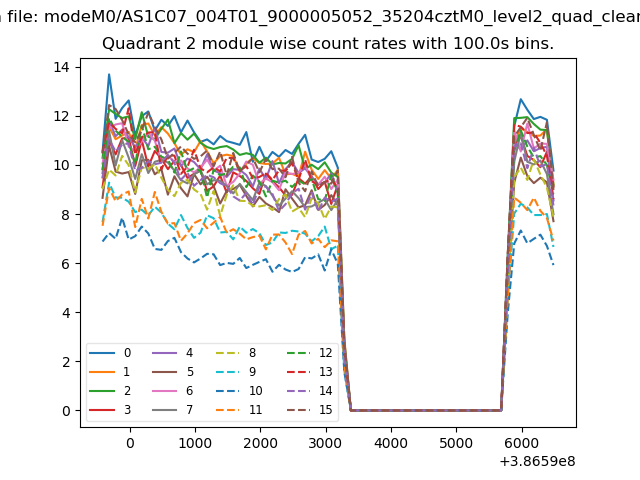
| Module-wise count rates for Quadrant B Data is divided into 100 sec bins |
 |
 |
| Module-wise count rates for Quadrant C Data is divided into 100 sec bins |
 |
 |
| Module-wise count rates for Quadrant D Data is divided into 100 sec bins |
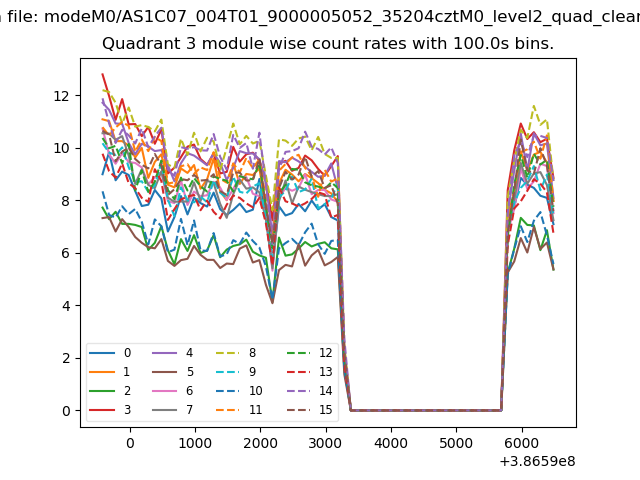 |
 |
| Parameter | Plot |
|---|---|
| CZT HV Monitor | 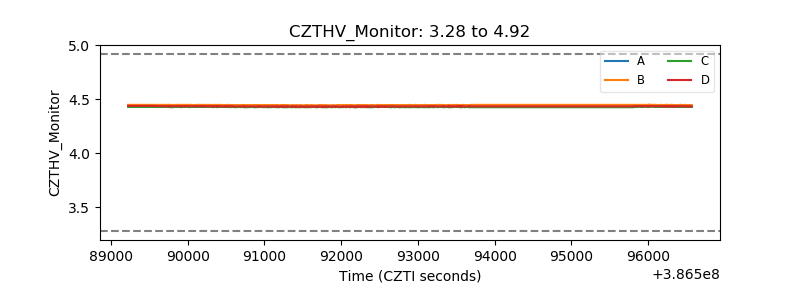 |
| D_VDD | 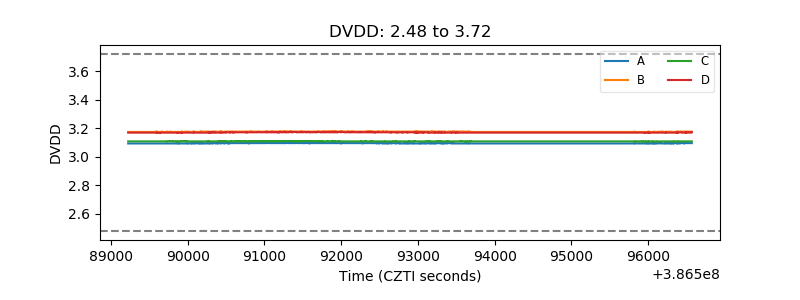 |
| Temperature 1 | 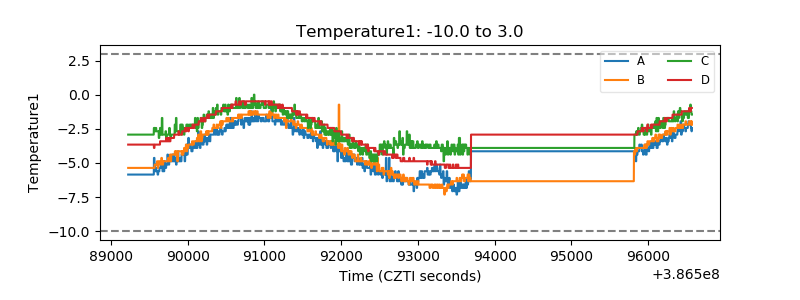 |
| Veto HV Monitor | 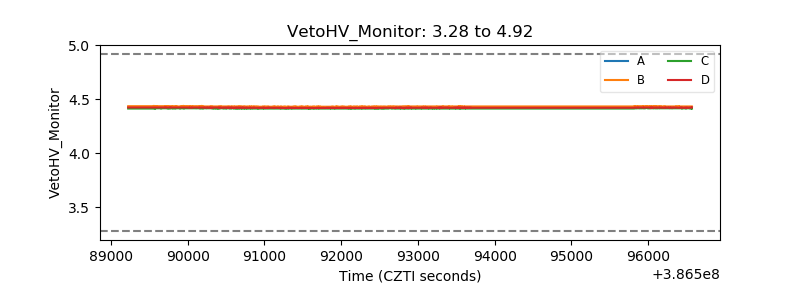 |
| Veto LLD | 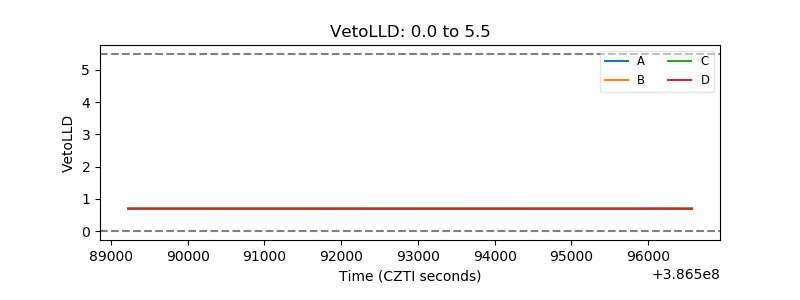 |
| Alpha Counter | 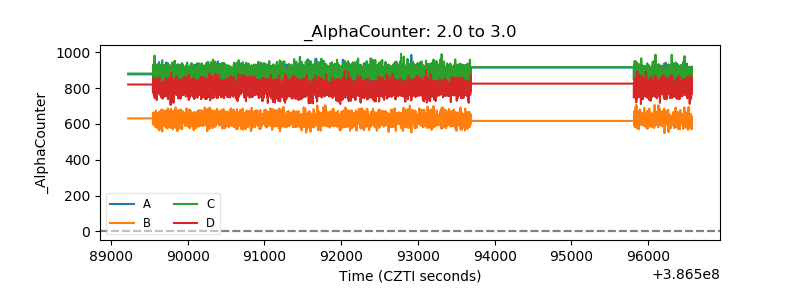 |
| _CPM_Rate | 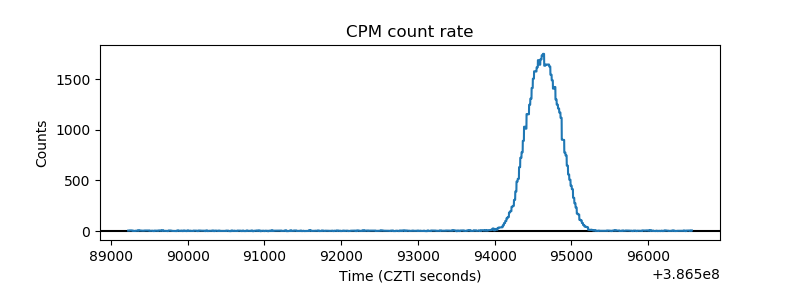 |
| CZT Counter | 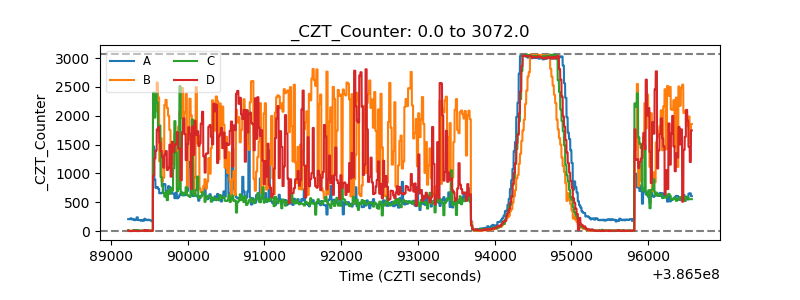 |
| +2.5 Volts monitor |  |
| +5 Volts monitor | 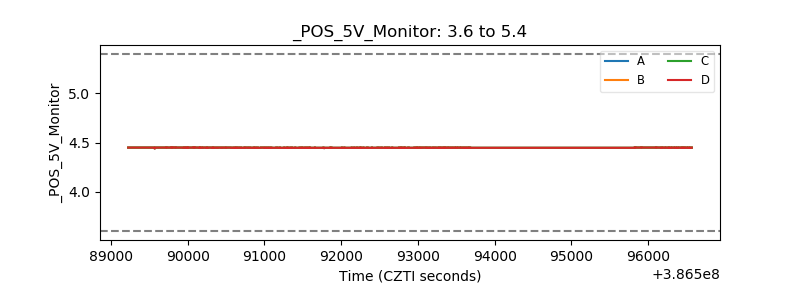 |
| _ROLL_ROT | 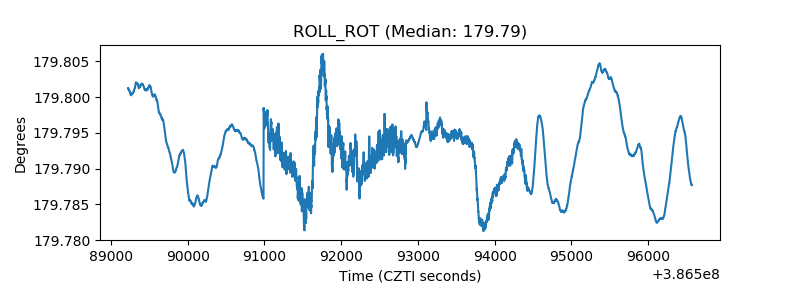 |
| _Roll_DEC | 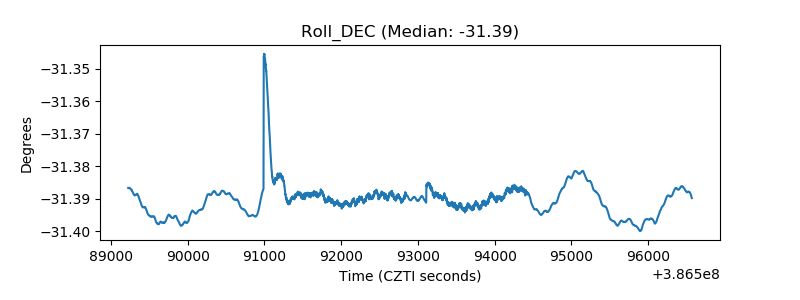 |
| _Roll_RA | 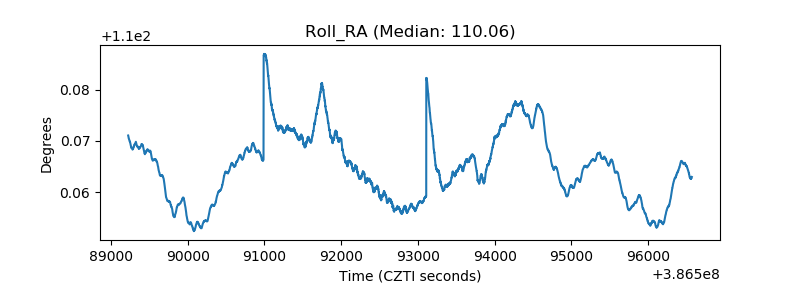 |
| Veto Counter | 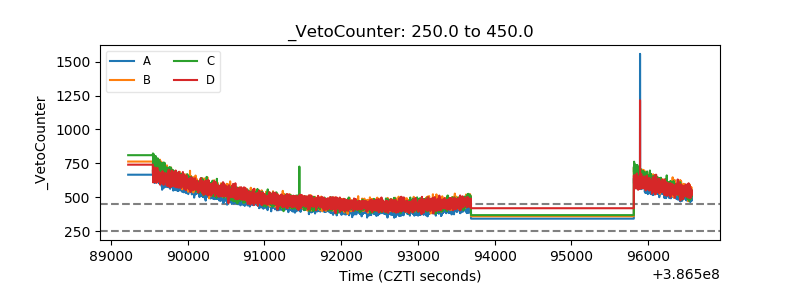 |