| Param | Original file | Final file |
|---|---|---|
| Filename | modeM0/AS1T05_020T01_9000005050_35193cztM0_level2.evt | modeM0/AS1T05_020T01_9000005050_35193cztM0_level2_quad_clean.evt |
| Size (bytes) | 708,949,440 | 78,520,320 |
| Size | 676.1 MB | 74.9 MB |
| Events in quadrant A | 2,750,287 | 534,056 |
| Events in quadrant B | 7,996,679 | 451,441 |
| Events in quadrant C | 3,204,948 | 526,686 |
| Events in quadrant D | 7,149,024 | 481,129 |
| Mode SS | |||
|---|---|---|---|
| Quadrant | BADHDUFLAG | Total packets | Discarded packets |
| A | 0 | 112 | 0 |
| B | 0 | 112 | 0 |
| C | 0 | 112 | 0 |
| D | 0 | 112 | 0 |
| Mode M0 | |||
|---|---|---|---|
| Quadrant | BADHDUFLAG | Total packets | Discarded packets |
| A | 0 | 11668 | 3 |
| B | 0 | 27606 | 2 |
| C | 0 | 12721 | 2 |
| D | 0 | 25132 | 2 |
| Mode M9 | |||
|---|---|---|---|
| Quadrant | BADHDUFLAG | Total packets | Discarded packets |
| A | 0 | 21 | 0 |
| B | 0 | 21 | 0 |
| C | 0 | 21 | 0 |
| D | 0 | 22 | 0 |
| Quadrant | Total seconds | Saturated seconds | Saturation percentage |
|---|---|---|---|
| A | 5483 | 15 | 0.273573% |
| B | 5483 | 1935 | 35.290899% |
| C | 5483 | 180 | 3.282874% |
| D | 5483 | 638 | 11.635966% |
Noise dominated data is calculated using 1-second bins in cleaned event files. If a bin has >2000 counts, and if more than 50% of those come from <1% of pixels, then it is considered to be noise-dominated and hence unusable.
| Quadrant | # 1 sec bins | Bins with >0 counts | Bins with >2000 counts | High rate bins dominated by noise | Noise dominated (total time) | Noise dominated (detector-on time) | Marked lightcurve |
|---|---|---|---|---|---|---|---|
| A | 7127 | 5484 | 6 | 6 | 0.08% | 0.11% | 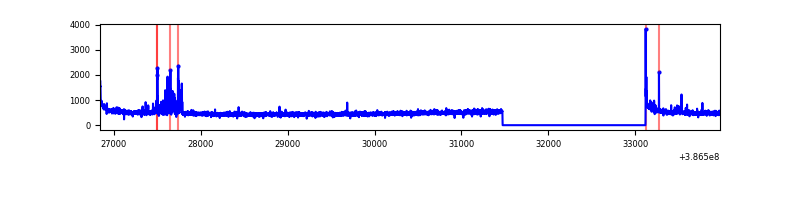 |
| B | 7127 | 5484 | 1302 | 1302 | 18.27% | 23.74% | 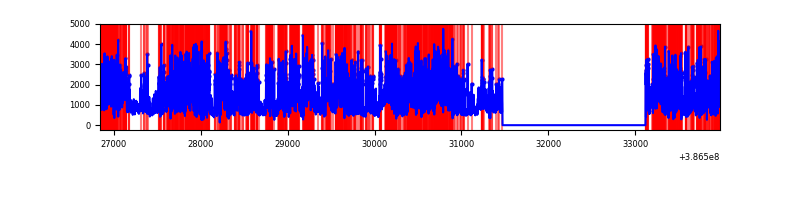 |
| C | 7127 | 5484 | 136 | 136 | 1.91% | 2.48% | 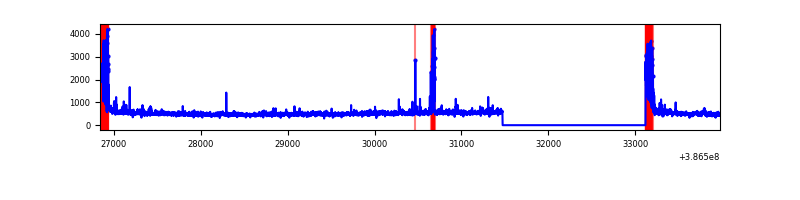 |
| D | 7127 | 5484 | 650 | 650 | 9.12% | 11.85% | 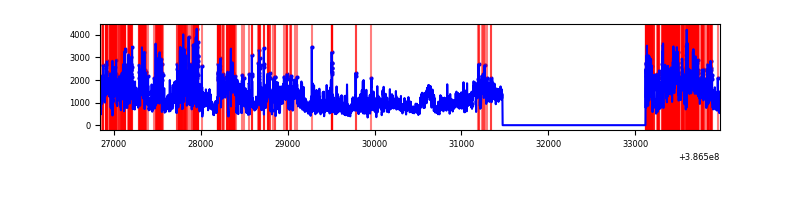 |
Top three noisy pixels from each quadrant. If the there are fewer than three noisy pixels in the level2.evt file, extra rows are filled as -1
| Pixel properties | Quadrant properties | ||||||
|---|---|---|---|---|---|---|---|
| Quadrant | DetID | PixID | Counts | Sigma | Mean | Median | Sigma |
| A | 10 | 255 | 110222 | 837.99 | 646 | 634 | 130.8 |
| A | 10 | 83 | 102173 | 776.44 | 646 | 634 | 130.8 |
| A | 13 | 6 | 15804 | 116.0 | 646 | 634 | 130.8 |
| B | 5 | 236 | 5656589 | 52464.73 | 559 | 545 | 107.8 |
| B | 15 | 85 | 27415 | 249.24 | 559 | 545 | 107.8 |
| B | 0 | 189 | 21003 | 189.77 | 559 | 545 | 107.8 |
| C | 0 | 10 | 399674 | 2768.24 | 619 | 624 | 144.2 |
| C | 15 | 214 | 226404 | 1566.25 | 619 | 624 | 144.2 |
| C | 9 | 69 | 69649 | 478.83 | 619 | 624 | 144.2 |
| D | 8 | 195 | 3521782 | 23205.23 | 607 | 589 | 151.7 |
| D | 10 | 118 | 350768 | 2307.74 | 607 | 589 | 151.7 |
| D | 12 | 233 | 273465 | 1798.3 | 607 | 589 | 151.7 |
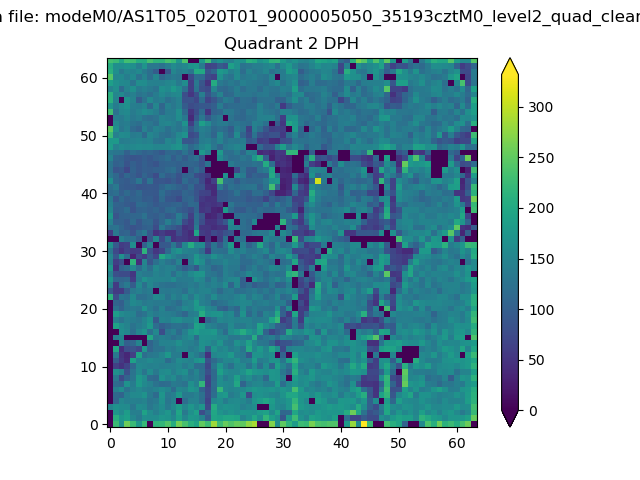
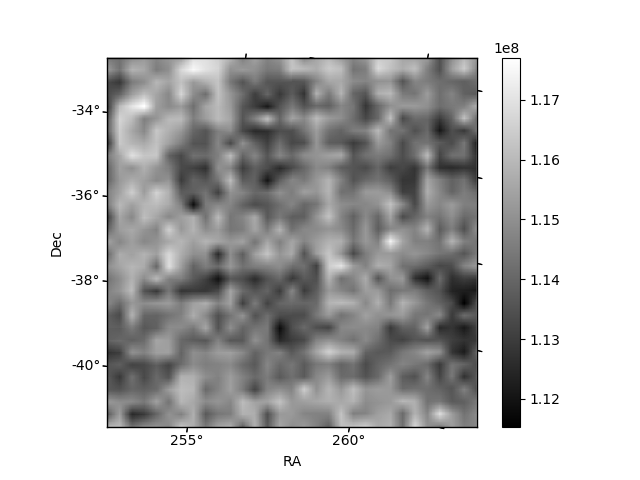
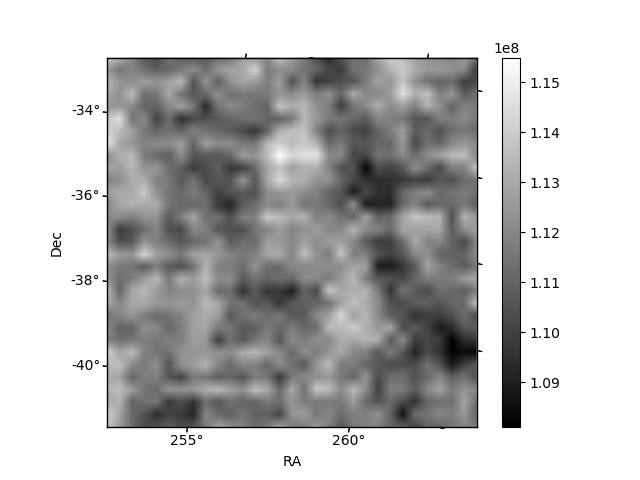
Histogram calculated using DETX and DETY for each event in the final _common_clean file
| Quadrant A | 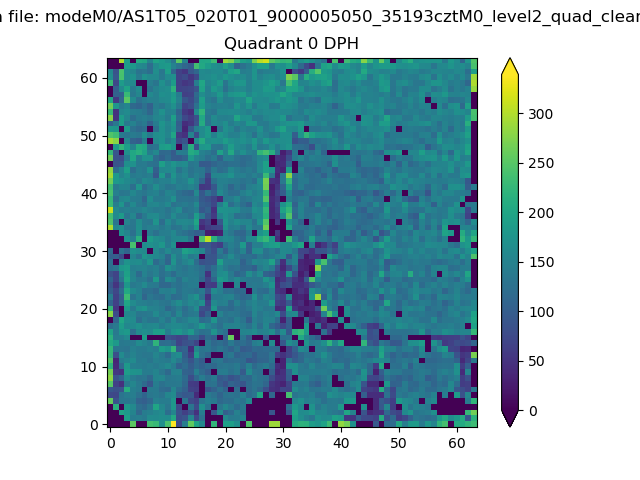 |
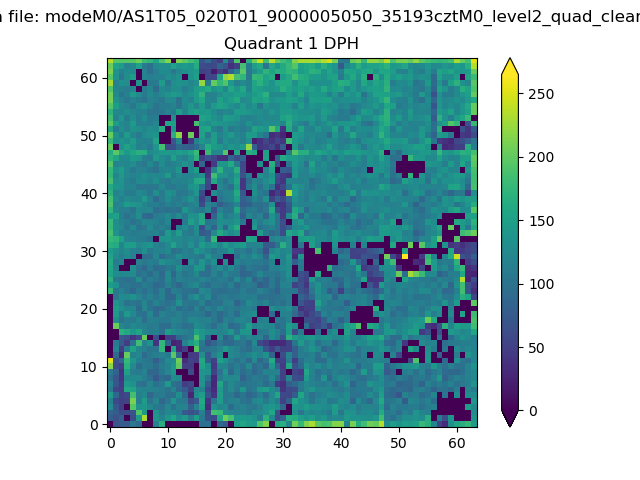 |
Quadrant B |
|---|---|---|---|
| Quadrant D | 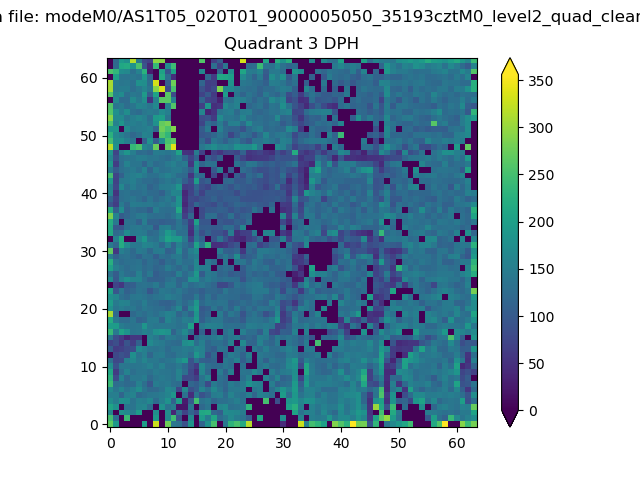 |
 |
Quadrant C |
| Plot type | Count rate plots | Images |
|---|---|---|
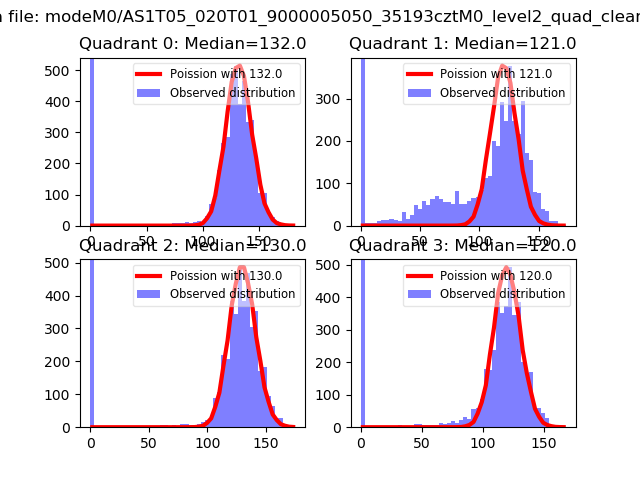
| Comparison with Poisson distribution Blue bars denote a histogram of data divided into 1 sec bins. Red curve is a Poisson curve with rate = median count rate of data. |
 |
 |
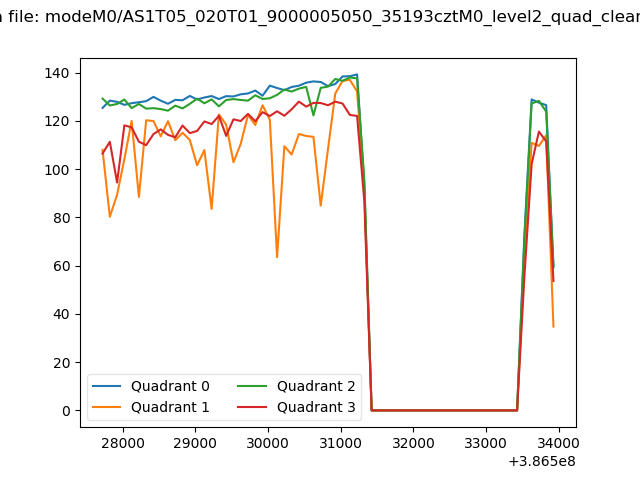
| Quadrant-wise count rates Data is divided into 100 sec bins |
 |
|
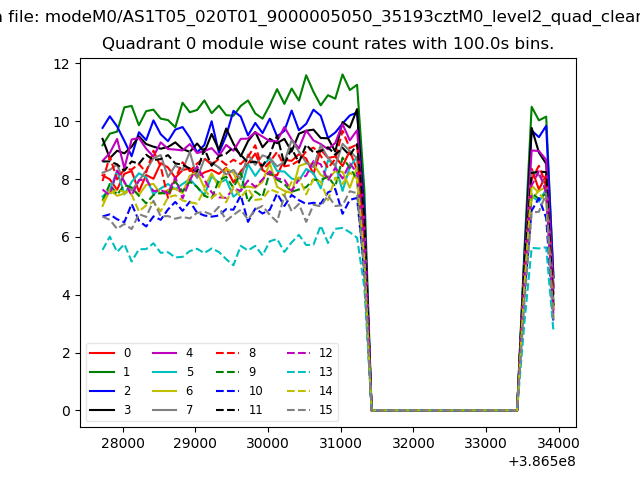
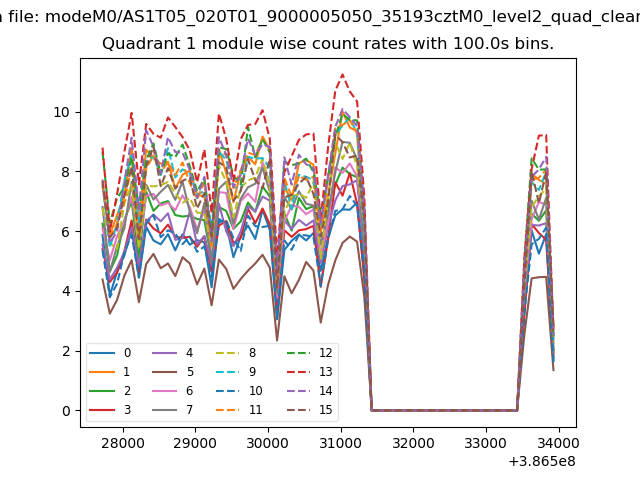
| Module-wise count rates for Quadrant A Data is divided into 100 sec bins |
 |
 |
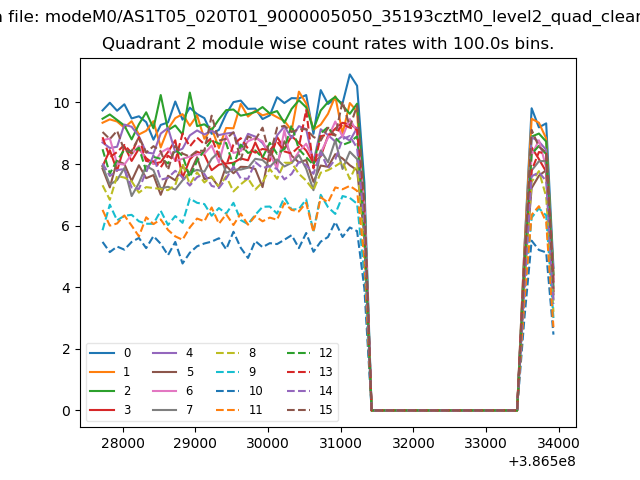
| Module-wise count rates for Quadrant B Data is divided into 100 sec bins |
 |
 |
| Module-wise count rates for Quadrant C Data is divided into 100 sec bins |
 |
 |
| Module-wise count rates for Quadrant D Data is divided into 100 sec bins |
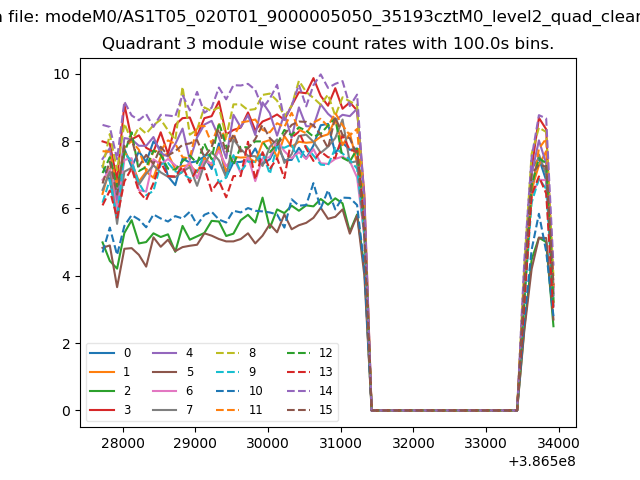 |
 |
| Parameter | Plot |
|---|---|
| CZT HV Monitor | 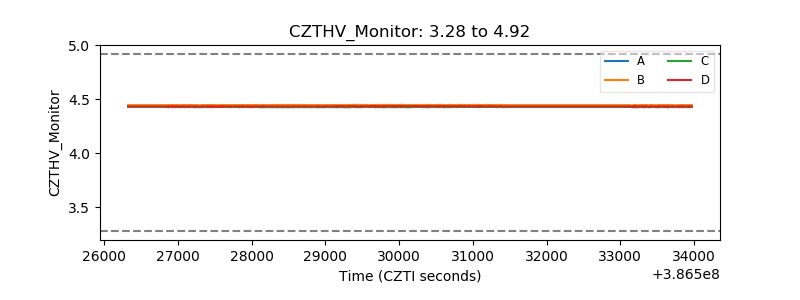 |
| D_VDD | 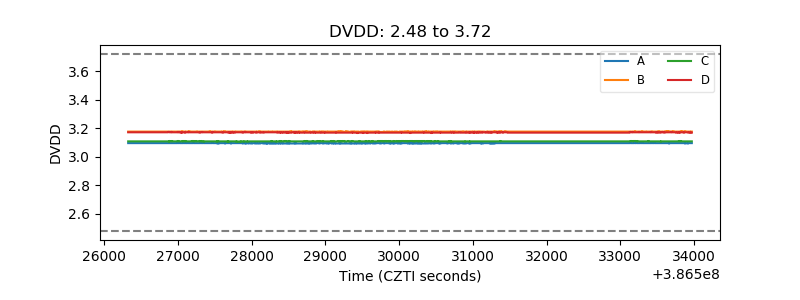 |
| Temperature 1 | 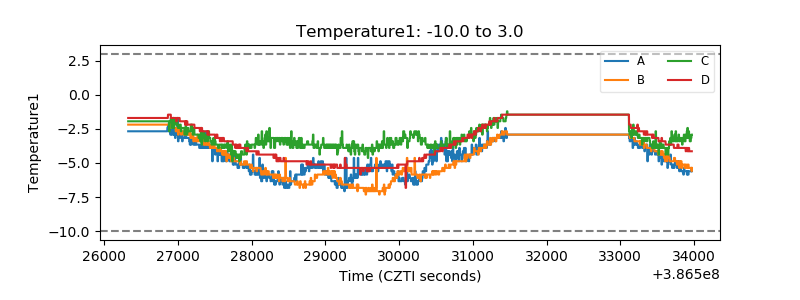 |
| Veto HV Monitor | 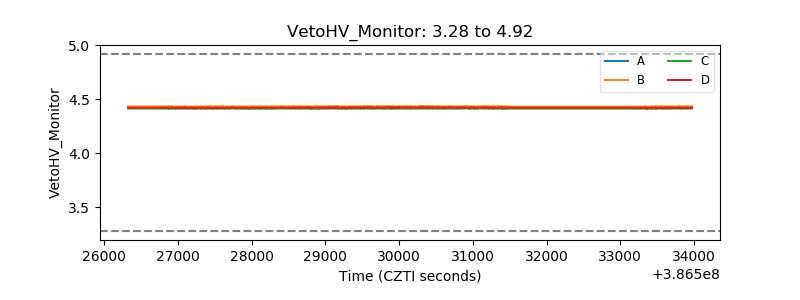 |
| Veto LLD | 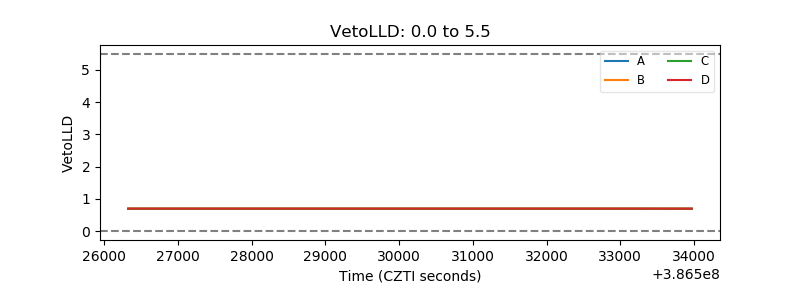 |
| Alpha Counter | 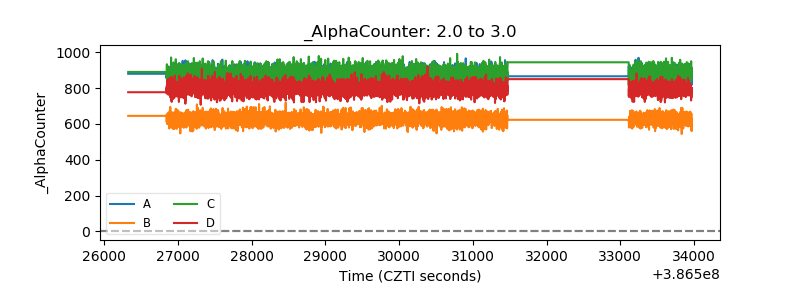 |
| _CPM_Rate | 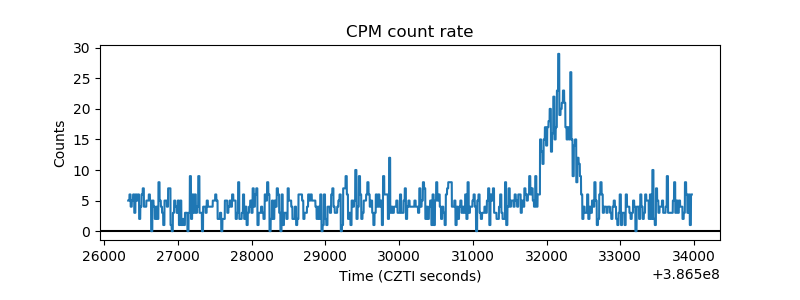 |
| CZT Counter | 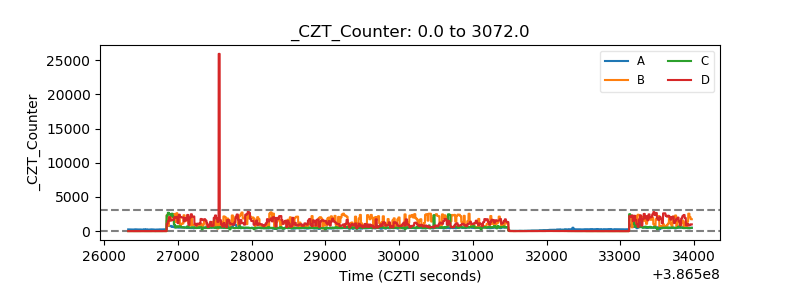 |
| +2.5 Volts monitor | 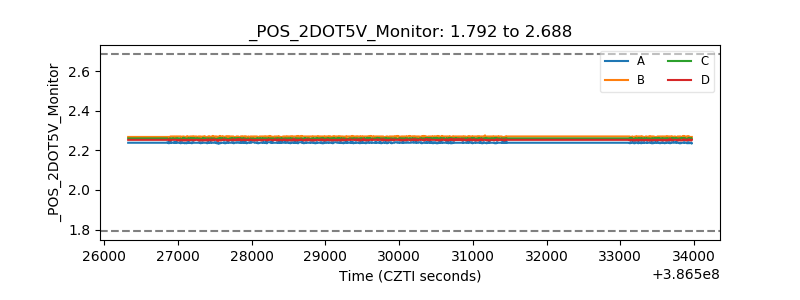 |
| +5 Volts monitor | 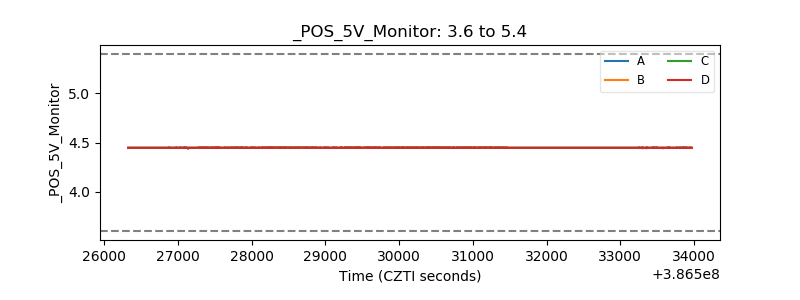 |
| _ROLL_ROT | 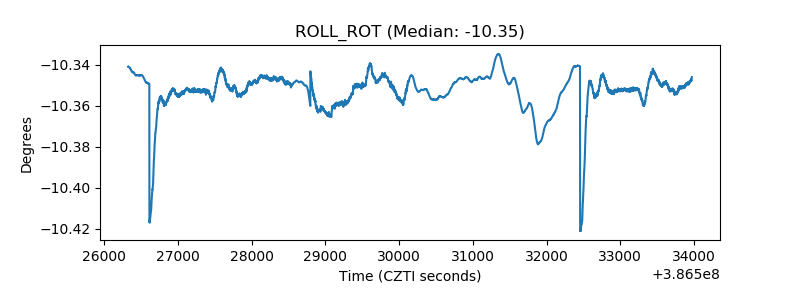 |
| _Roll_DEC | 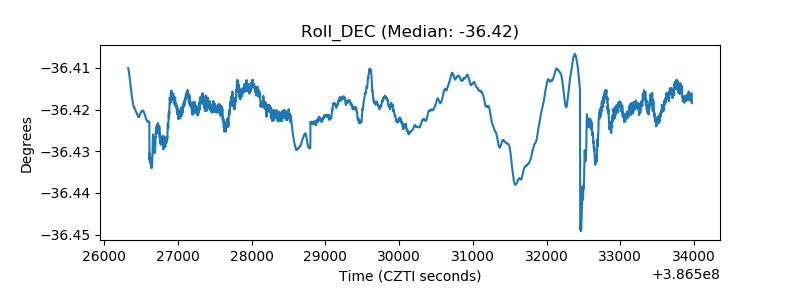 |
| _Roll_RA | 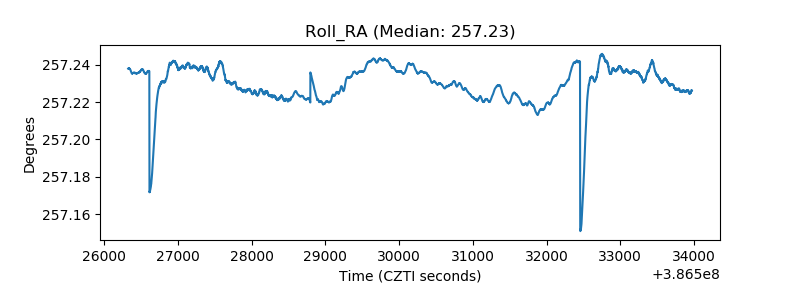 |
| Veto Counter | 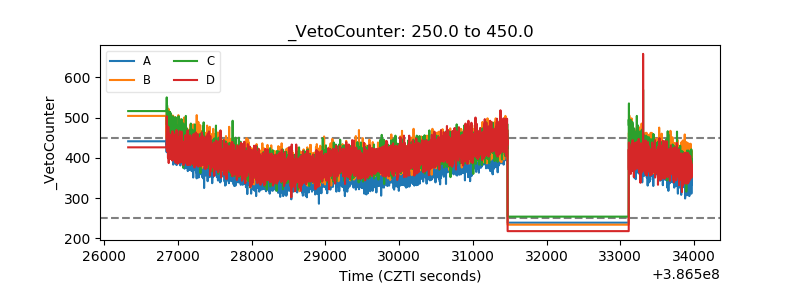 |