| Param | Original file | Final file |
|---|---|---|
| Filename | modeM0/AS1T05_020T01_9000005050_35188cztM0_level2.evt | modeM0/AS1T05_020T01_9000005050_35188cztM0_level2_quad_clean.evt |
| Size (bytes) | 920,701,440 | 53,974,080 |
| Size | 878.0 MB | 51.5 MB |
| Events in quadrant A | 2,803,093 | 374,405 |
| Events in quadrant B | 8,536,110 | 317,485 |
| Events in quadrant C | 3,281,596 | 360,750 |
| Events in quadrant D | 12,906,885 | 209,525 |
| Mode SS | |||
|---|---|---|---|
| Quadrant | BADHDUFLAG | Total packets | Discarded packets |
| A | 0 | 108 | 0 |
| B | 0 | 108 | 0 |
| C | 0 | 108 | 0 |
| D | 0 | 108 | 0 |
| Mode M0 | |||
|---|---|---|---|
| Quadrant | BADHDUFLAG | Total packets | Discarded packets |
| A | 0 | 11340 | 2 |
| B | 0 | 29098 | 1 |
| C | 0 | 12912 | 1 |
| D | 0 | 41953 | 1 |
| Mode M9 | |||
|---|---|---|---|
| Quadrant | BADHDUFLAG | Total packets | Discarded packets |
| A | 0 | 20 | 0 |
| B | 0 | 20 | 0 |
| C | 0 | 20 | 0 |
| D | 0 | 20 | 0 |
| Quadrant | Total seconds | Saturated seconds | Saturation percentage |
|---|---|---|---|
| A | 5289 | 7 | 0.132350% |
| B | 5289 | 2443 | 46.190206% |
| C | 5289 | 97 | 1.833995% |
| D | 5289 | 4693 | 88.731329% |
Noise dominated data is calculated using 1-second bins in cleaned event files. If a bin has >2000 counts, and if more than 50% of those come from <1% of pixels, then it is considered to be noise-dominated and hence unusable.
| Quadrant | # 1 sec bins | Bins with >0 counts | Bins with >2000 counts | High rate bins dominated by noise | Noise dominated (total time) | Noise dominated (detector-on time) | Marked lightcurve |
|---|---|---|---|---|---|---|---|
| A | 7262 | 5290 | 1 | 1 | 0.01% | 0.02% | 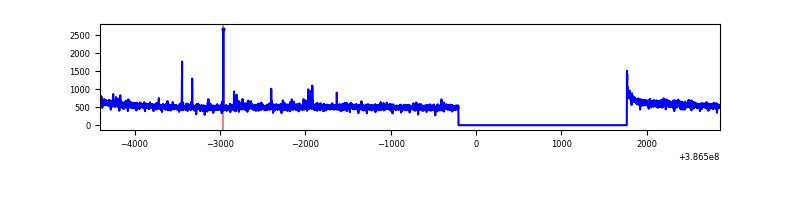 |
| B | 7262 | 5290 | 1685 | 1685 | 23.20% | 31.85% | 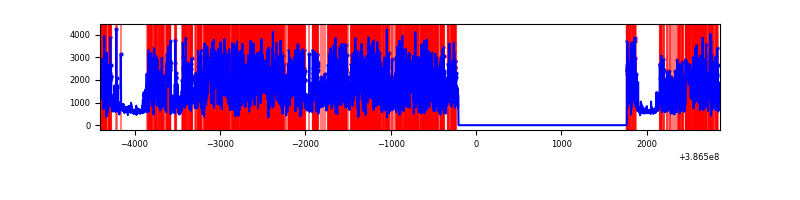 |
| C | 7262 | 5290 | 71 | 71 | 0.98% | 1.34% | 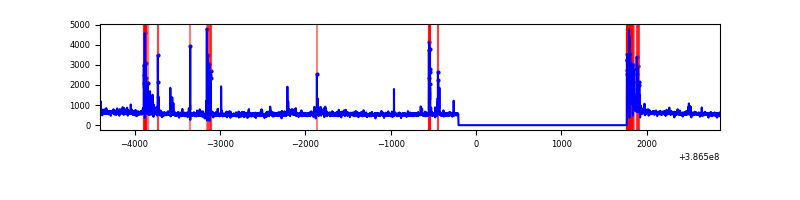 |
| D | 7262 | 5290 | 4562 | 4562 | 62.82% | 86.24% | 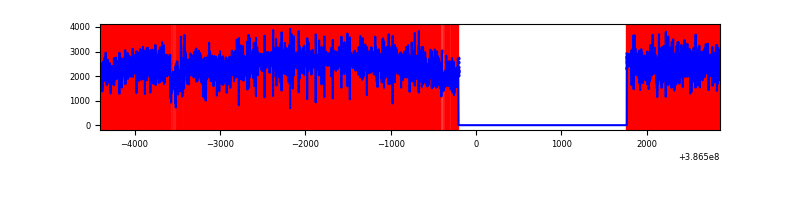 |
Top three noisy pixels from each quadrant. If the there are fewer than three noisy pixels in the level2.evt file, extra rows are filled as -1
| Pixel properties | Quadrant properties | ||||||
|---|---|---|---|---|---|---|---|
| Quadrant | DetID | PixID | Counts | Sigma | Mean | Median | Sigma |
| A | 10 | 83 | 79837 | 573.02 | 693 | 681 | 138.1 |
| A | 13 | 6 | 26308 | 185.52 | 693 | 681 | 138.1 |
| A | 9 | 143 | 17383 | 120.91 | 693 | 681 | 138.1 |
| B | 5 | 236 | 6091872 | 57804.12 | 557 | 543 | 105.4 |
| B | 5 | 172 | 166077 | 1570.85 | 557 | 543 | 105.4 |
| B | 5 | 200 | 29845 | 278.06 | 557 | 543 | 105.4 |
| C | 15 | 214 | 220819 | 1461.37 | 660 | 667 | 150.6 |
| C | 0 | 10 | 216542 | 1432.98 | 660 | 667 | 150.6 |
| C | 1 | 23 | 164767 | 1089.3 | 660 | 667 | 150.6 |
| D | 7 | 80 | 7558465 | 71464.02 | 431 | 419 | 105.8 |
| D | 8 | 195 | 3324790 | 31433.11 | 431 | 419 | 105.8 |
| D | 1 | 52 | 91738 | 863.45 | 431 | 419 | 105.8 |
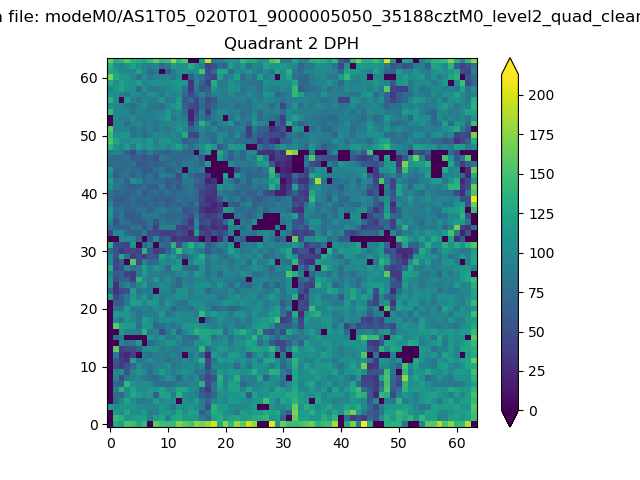
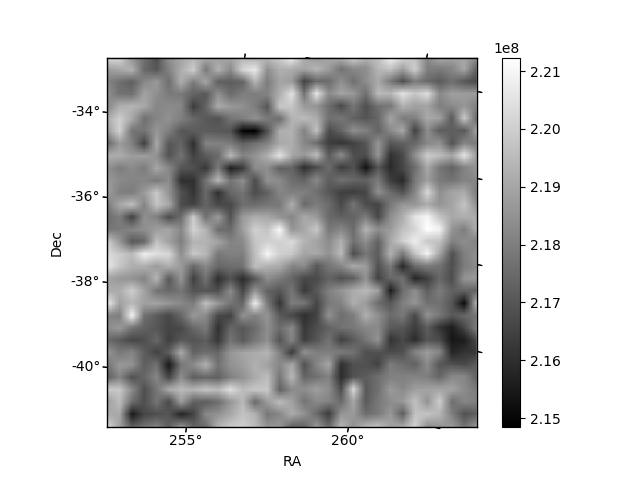
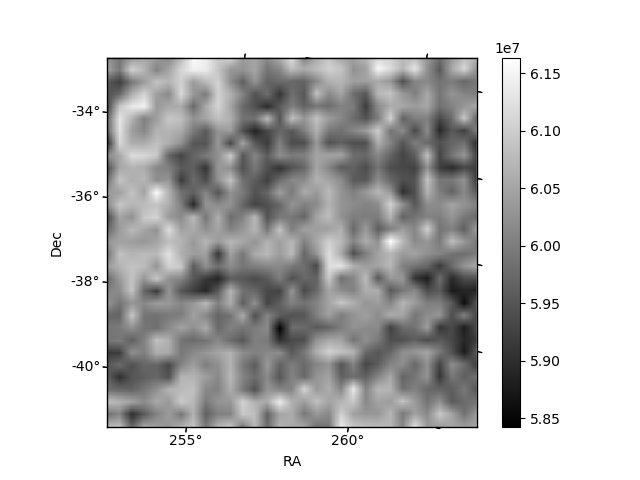
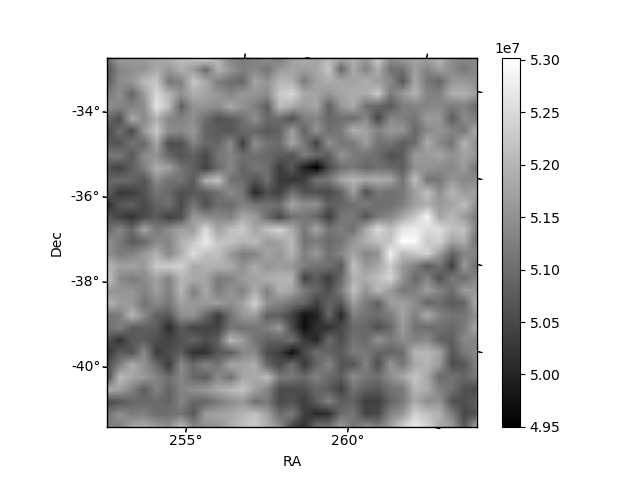
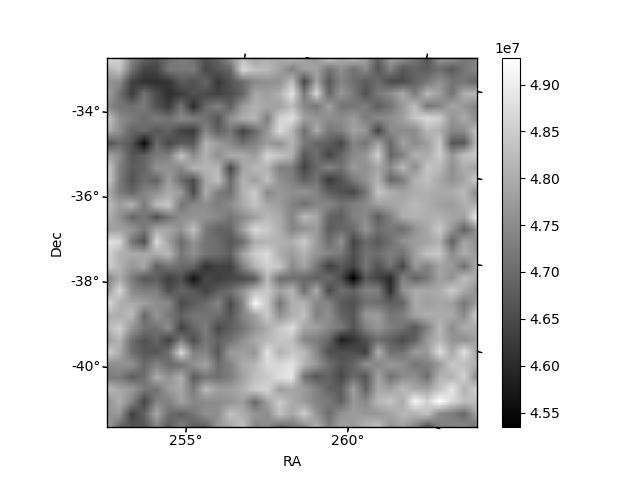
Histogram calculated using DETX and DETY for each event in the final _common_clean file
| Quadrant A | 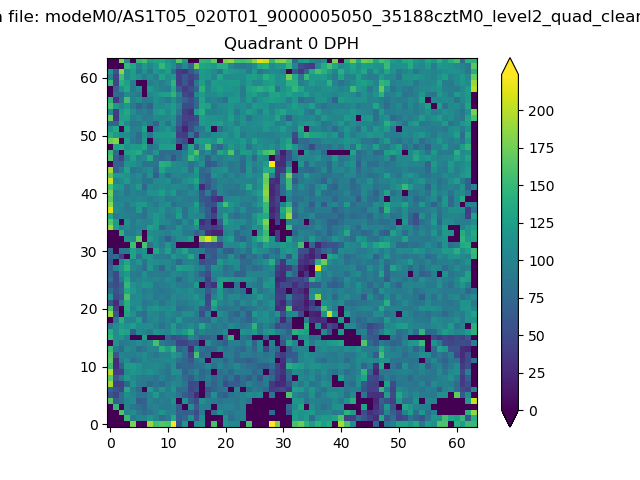 |
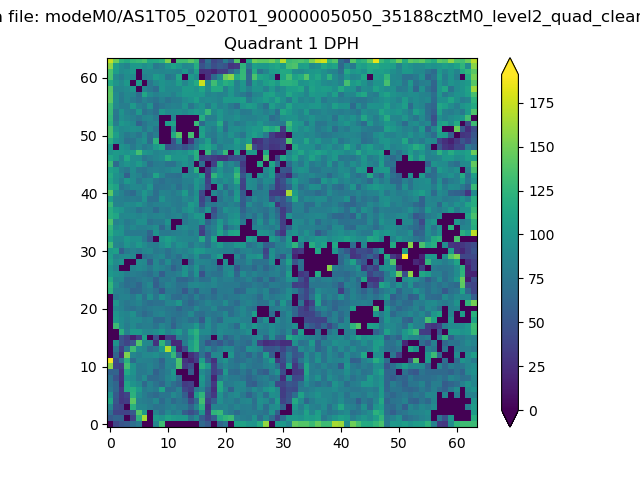 |
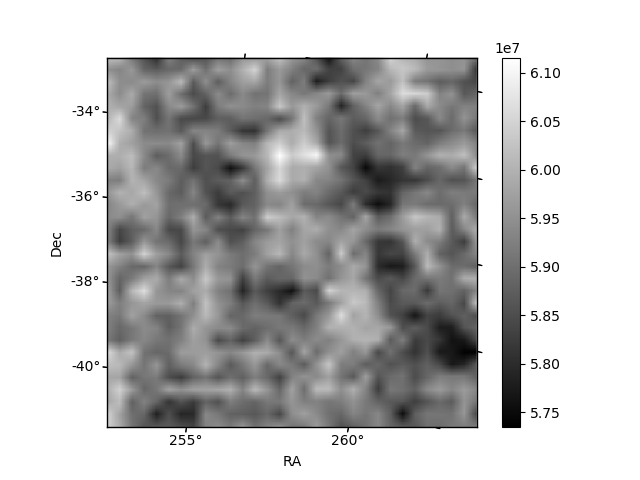
Quadrant B |
|---|---|---|---|
| Quadrant D | 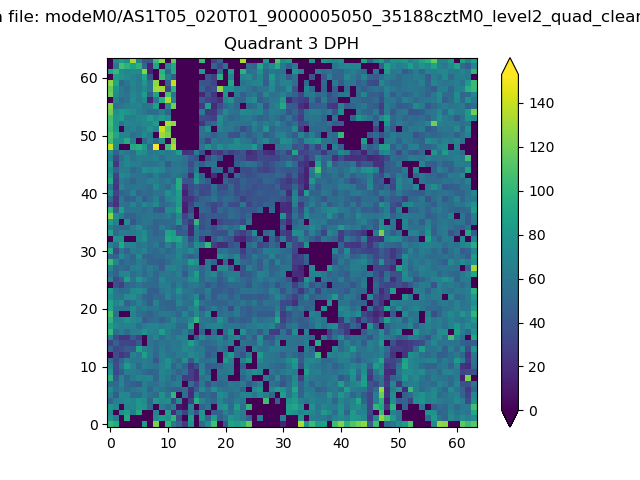 |
 |
Quadrant C |
| Plot type | Count rate plots | Images |
|---|---|---|
| Comparison with Poisson distribution Blue bars denote a histogram of data divided into 1 sec bins. Red curve is a Poisson curve with rate = median count rate of data. |
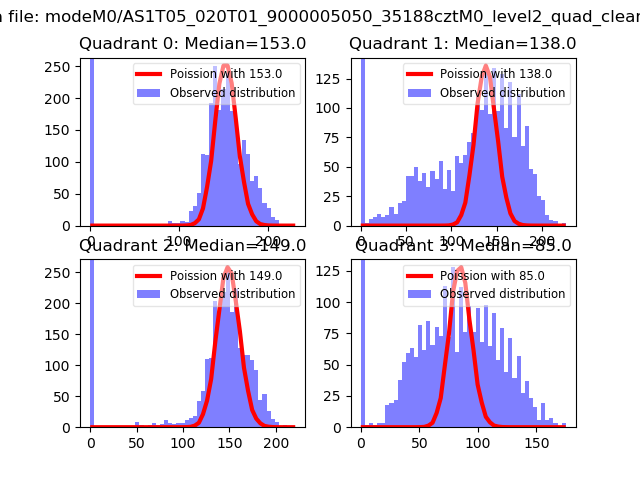 |
 |
| Quadrant-wise count rates Data is divided into 100 sec bins |
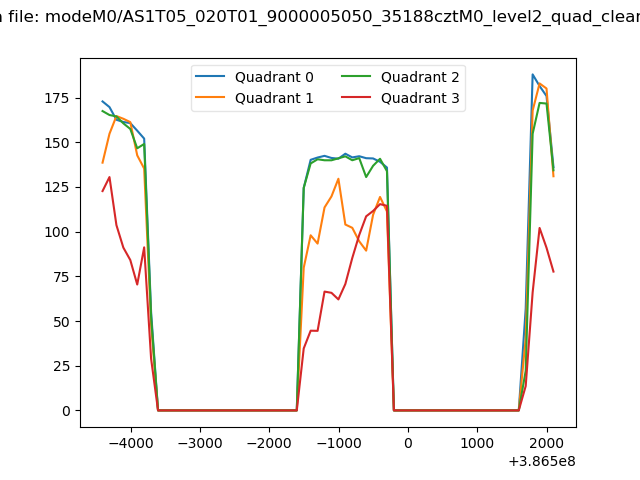 |
|
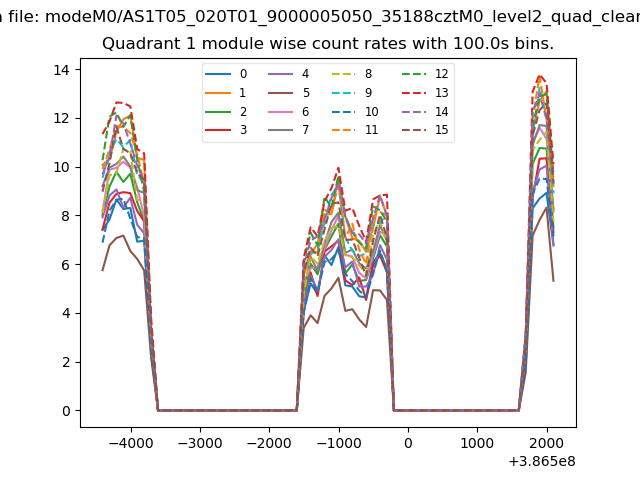
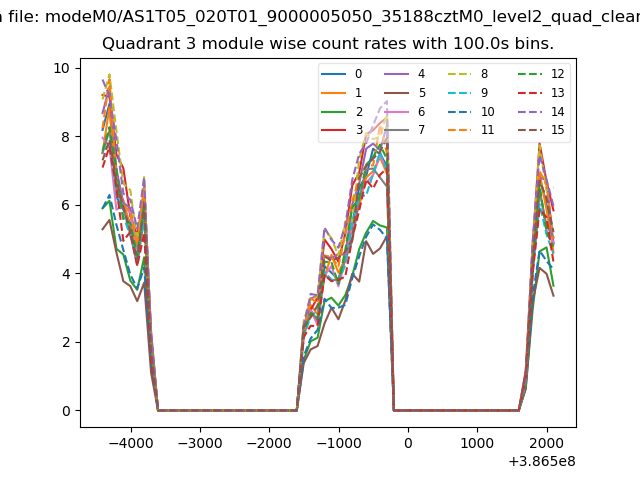
| Module-wise count rates for Quadrant A Data is divided into 100 sec bins |
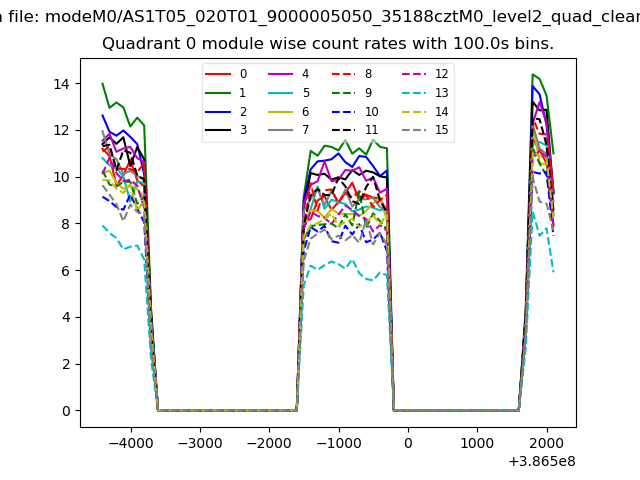 |
 |
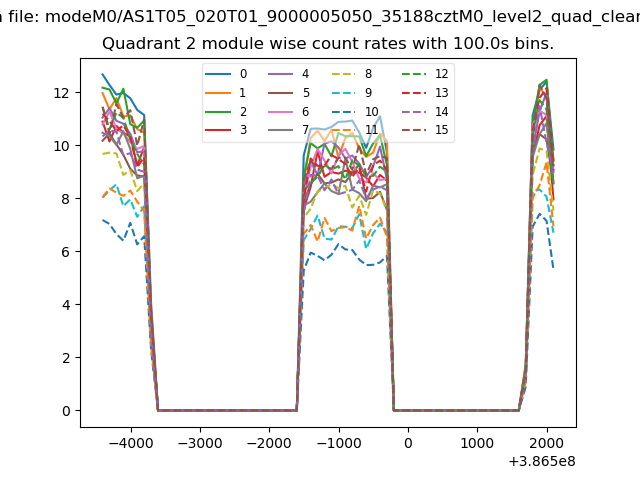
| Module-wise count rates for Quadrant B Data is divided into 100 sec bins |
 |
 |
| Module-wise count rates for Quadrant C Data is divided into 100 sec bins |
 |
 |
| Module-wise count rates for Quadrant D Data is divided into 100 sec bins |
 |
 |
| Parameter | Plot |
|---|---|
| CZT HV Monitor | 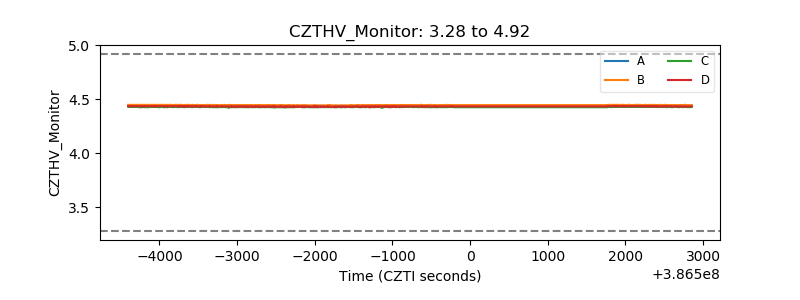 |
| D_VDD | 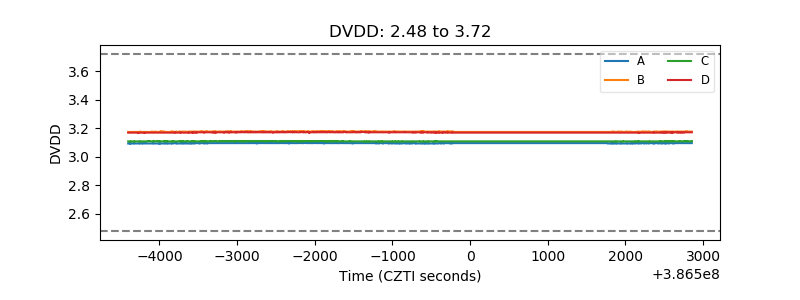 |
| Temperature 1 | 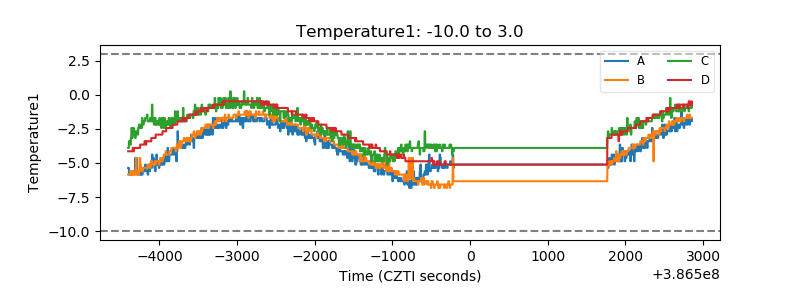 |
| Veto HV Monitor | 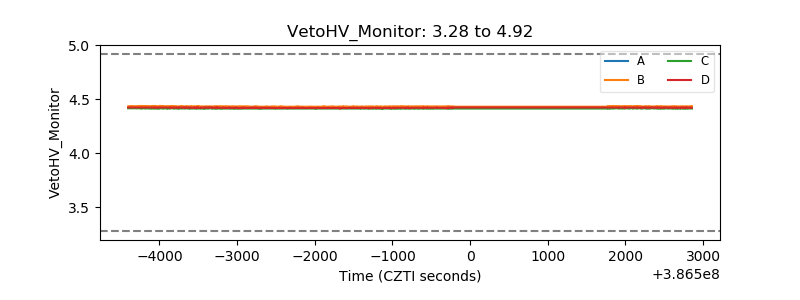 |
| Veto LLD | 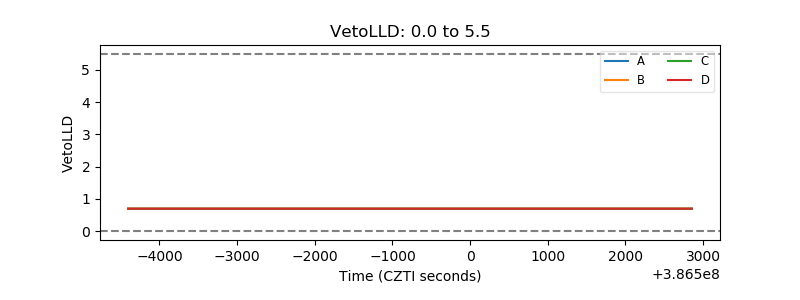 |
| Alpha Counter | 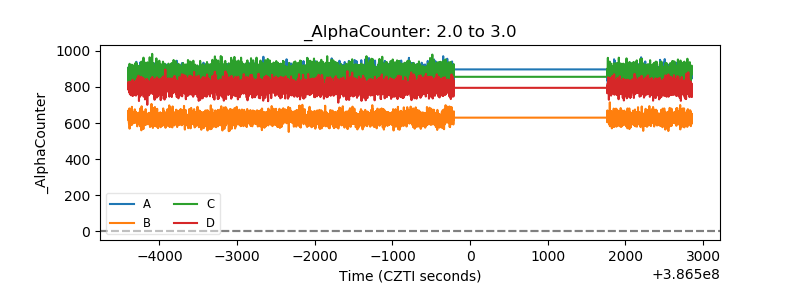 |
| _CPM_Rate | 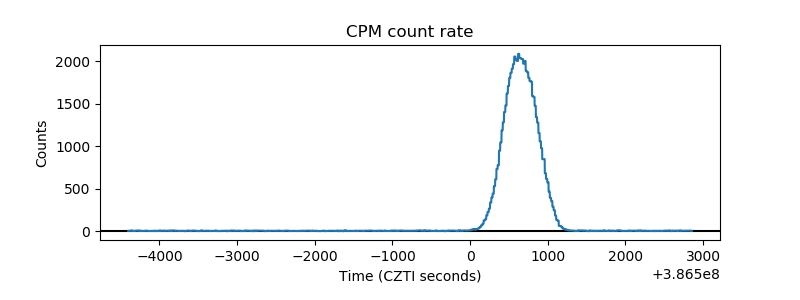 |
| CZT Counter | 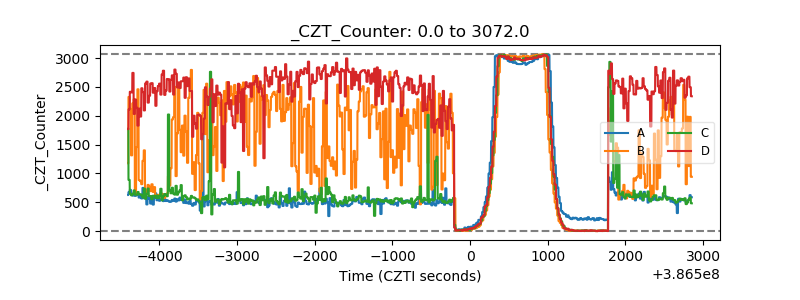 |
| +2.5 Volts monitor | 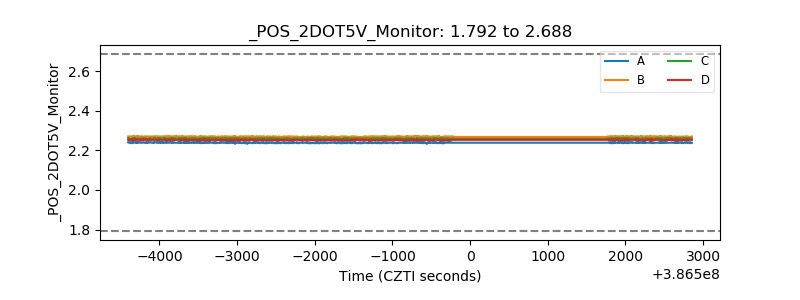 |
| +5 Volts monitor | 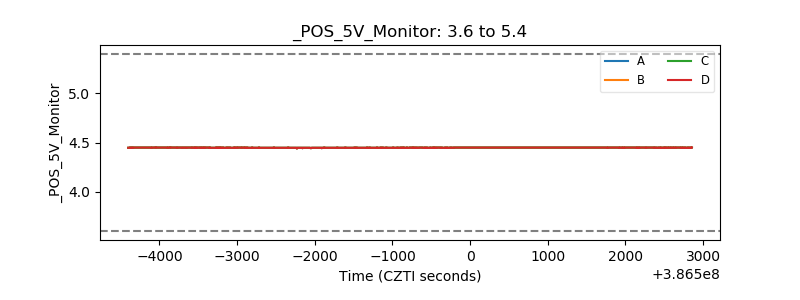 |
| _ROLL_ROT | 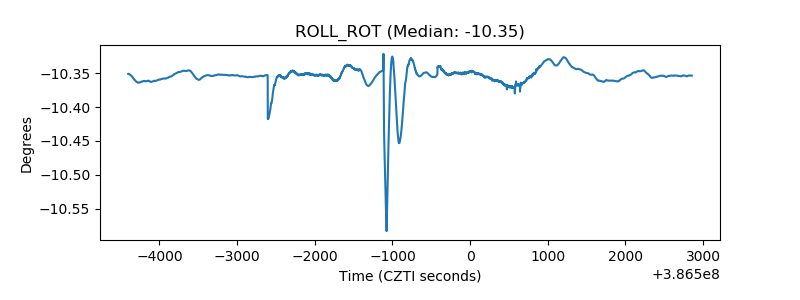 |
| _Roll_DEC | 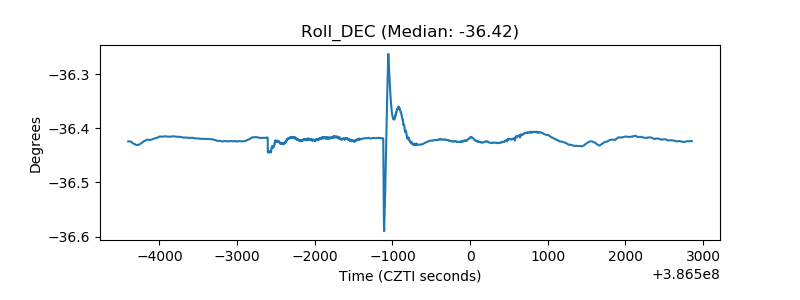 |
| _Roll_RA | 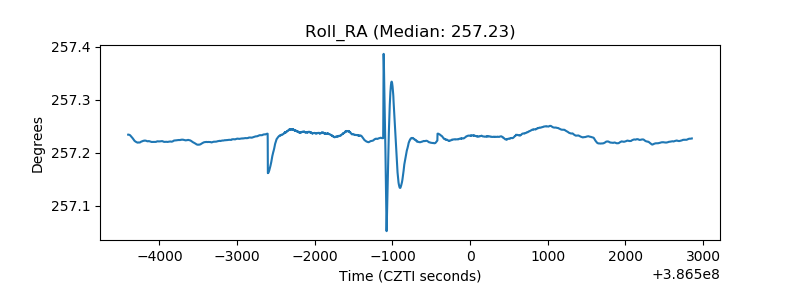 |
| Veto Counter | 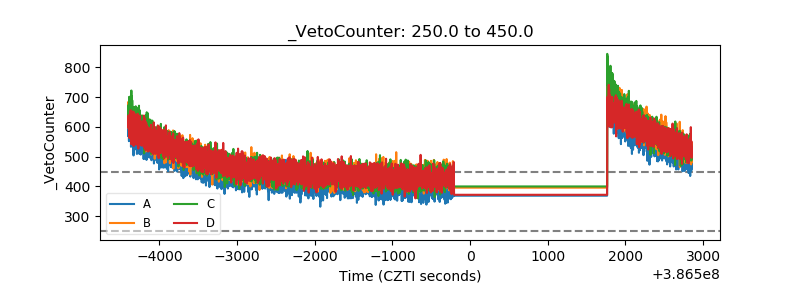 |