| Param | Original file | Final file |
|---|---|---|
| Filename | modeM0/AS1T05_016T01_9000005048_35183cztM0_level2.evt | modeM0/AS1T05_016T01_9000005048_35183cztM0_level2_quad_clean.evt |
| Size (bytes) | 794,076,480 | 92,073,600 |
| Size | 757.3 MB | 87.8 MB |
| Events in quadrant A | 2,516,698 | 676,391 |
| Events in quadrant B | 9,045,775 | 519,826 |
| Events in quadrant C | 2,844,123 | 659,424 |
| Events in quadrant D | 9,274,434 | 548,870 |
| Mode SS | |||
|---|---|---|---|
| Quadrant | BADHDUFLAG | Total packets | Discarded packets |
| A | 0 | 110 | 0 |
| B | 0 | 110 | 0 |
| C | 0 | 110 | 0 |
| D | 0 | 110 | 0 |
| Mode M9 | |||
|---|---|---|---|
| Quadrant | BADHDUFLAG | Total packets | Discarded packets |
| A | 0 | 14 | 0 |
| B | 0 | 14 | 0 |
| C | 0 | 14 | 0 |
| D | 0 | 14 | 0 |
| Mode M0 | |||
|---|---|---|---|
| Quadrant | BADHDUFLAG | Total packets | Discarded packets |
| A | 0 | 11052 | 2 |
| B | 0 | 30649 | 1 |
| C | 0 | 11620 | 1 |
| D | 0 | 31313 | 1 |
| Quadrant | Total seconds | Saturated seconds | Saturation percentage |
|---|---|---|---|
| A | 5452 | 10 | 0.183419% |
| B | 5452 | 2801 | 51.375642% |
| C | 5452 | 43 | 0.788701% |
| D | 5452 | 1657 | 30.392517% |
Noise dominated data is calculated using 1-second bins in cleaned event files. If a bin has >2000 counts, and if more than 50% of those come from <1% of pixels, then it is considered to be noise-dominated and hence unusable.
| Quadrant | # 1 sec bins | Bins with >0 counts | Bins with >2000 counts | High rate bins dominated by noise | Noise dominated (total time) | Noise dominated (detector-on time) | Marked lightcurve |
|---|---|---|---|---|---|---|---|
| A | 6915 | 5453 | 1 | 1 | 0.01% | 0.02% | 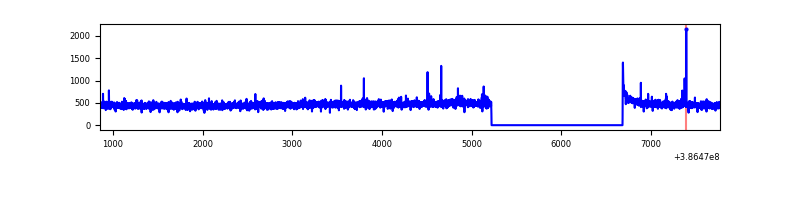 |
| B | 6915 | 5453 | 1865 | 1865 | 26.97% | 34.20% | 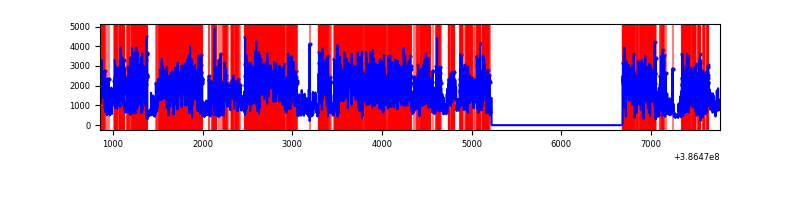 |
| C | 6915 | 5453 | 29 | 29 | 0.42% | 0.53% |  |
| D | 6915 | 5453 | 1683 | 1683 | 24.34% | 30.86% | 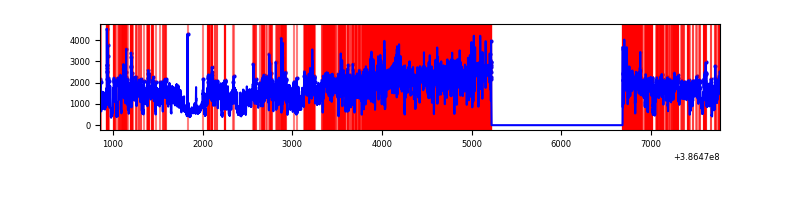 |
Top three noisy pixels from each quadrant. If the there are fewer than three noisy pixels in the level2.evt file, extra rows are filled as -1
| Pixel properties | Quadrant properties | ||||||
|---|---|---|---|---|---|---|---|
| Quadrant | DetID | PixID | Counts | Sigma | Mean | Median | Sigma |
| A | 10 | 83 | 69646 | 545.91 | 625 | 612 | 126.5 |
| A | 13 | 6 | 12357 | 92.88 | 625 | 612 | 126.5 |
| A | 13 | 254 | 9688 | 71.77 | 625 | 612 | 126.5 |
| B | 5 | 236 | 6852757 | 71488.87 | 497 | 484 | 95.9 |
| B | 5 | 172 | 180396 | 1877.0 | 497 | 484 | 95.9 |
| B | 4 | 232 | 31322 | 321.73 | 497 | 484 | 95.9 |
| C | 15 | 214 | 225144 | 1600.79 | 607 | 610 | 140.3 |
| C | 0 | 10 | 135398 | 960.95 | 607 | 610 | 140.3 |
| C | 1 | 23 | 48962 | 344.72 | 607 | 610 | 140.3 |
| D | 8 | 195 | 6016941 | 43750.11 | 556 | 539 | 137.5 |
| D | 7 | 80 | 460044 | 3341.43 | 556 | 539 | 137.5 |
| D | 2 | 250 | 122649 | 887.96 | 556 | 539 | 137.5 |
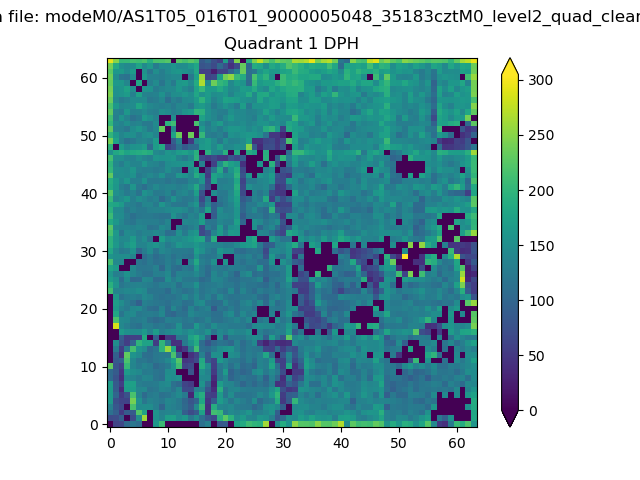
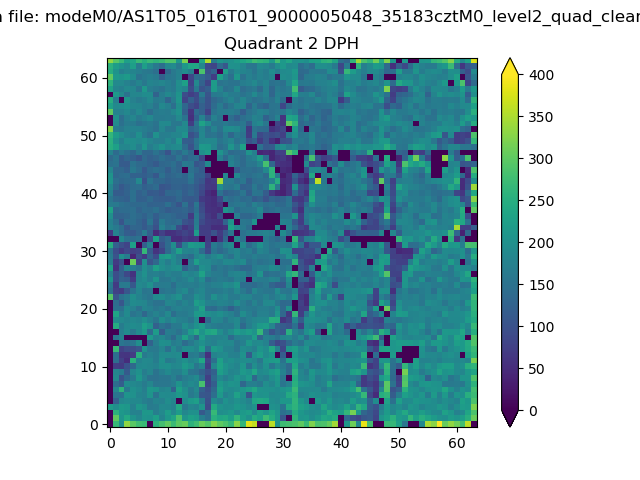
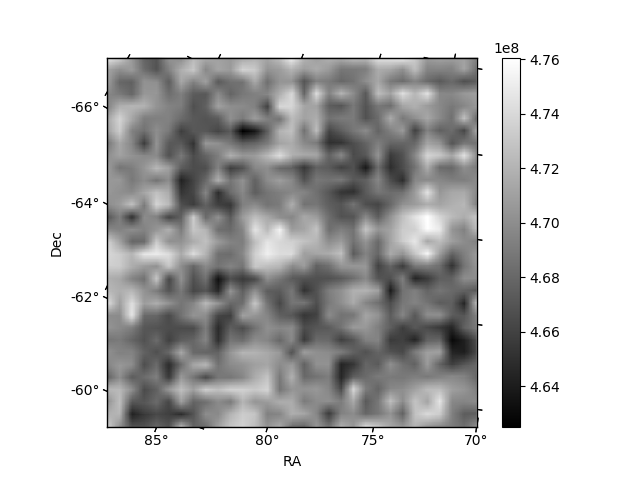
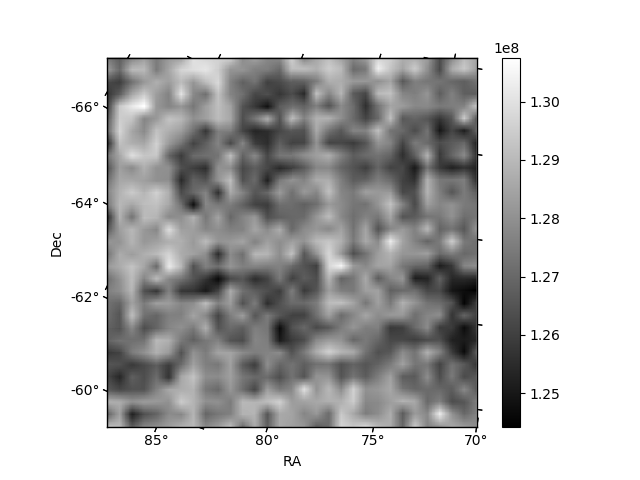
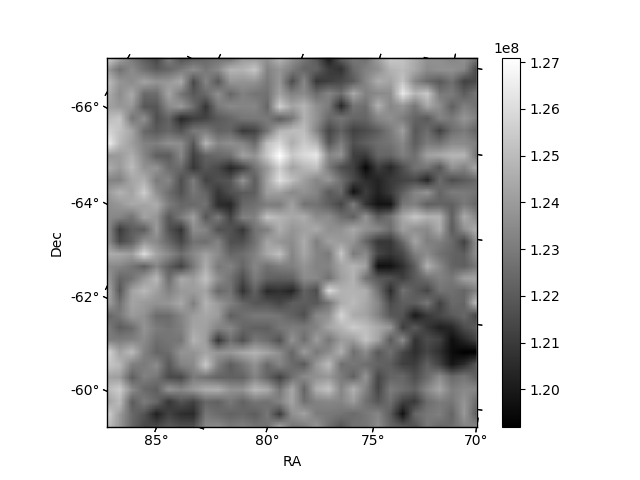
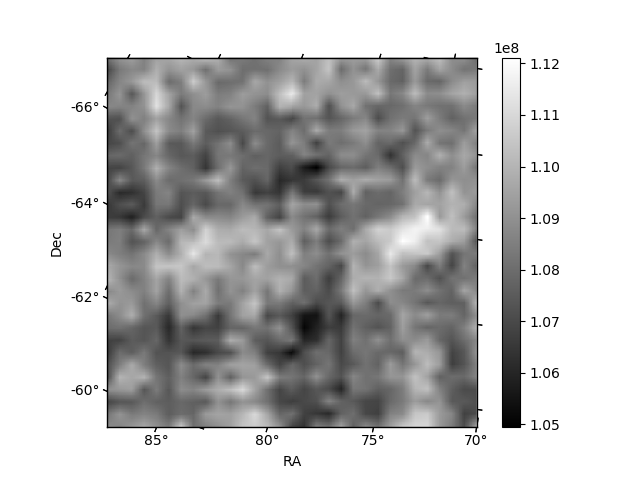
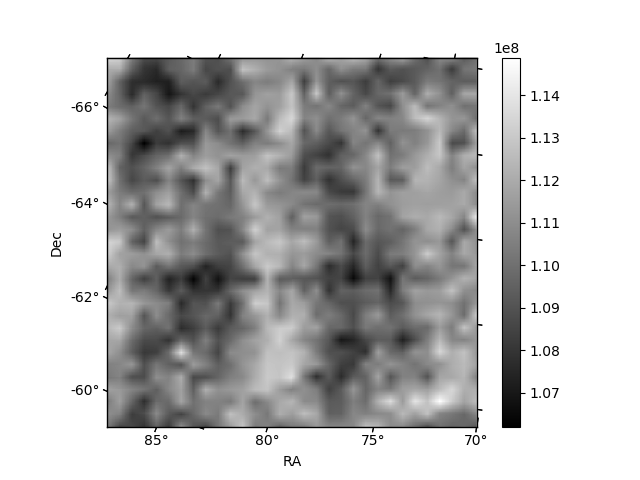
Histogram calculated using DETX and DETY for each event in the final _common_clean file
| Quadrant A | 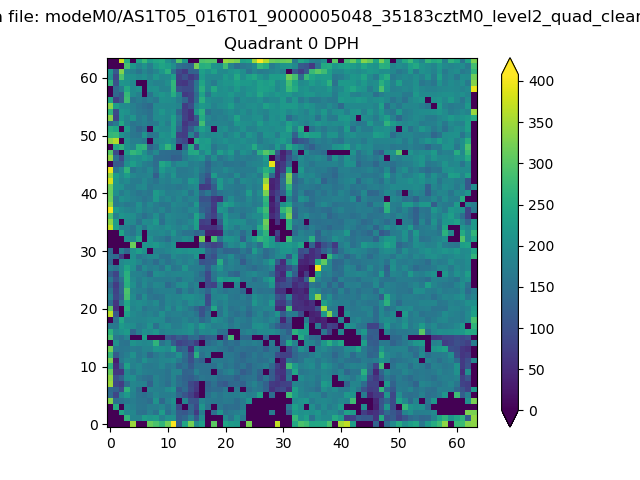 |
 |
Quadrant B |
|---|---|---|---|
| Quadrant D | 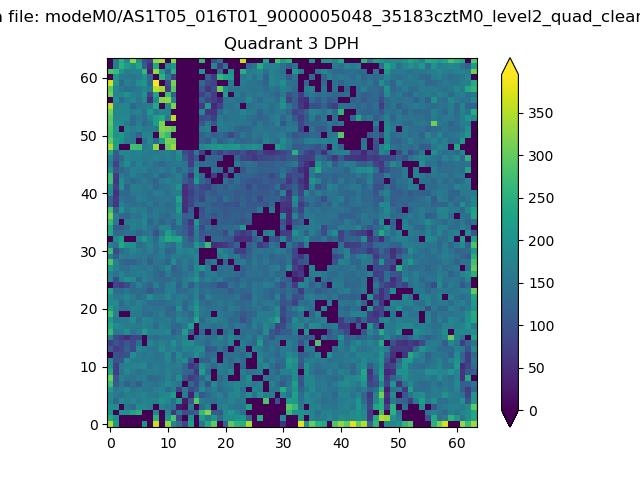 |
 |
Quadrant C |
| Plot type | Count rate plots | Images |
|---|---|---|
| Comparison with Poisson distribution Blue bars denote a histogram of data divided into 1 sec bins. Red curve is a Poisson curve with rate = median count rate of data. |
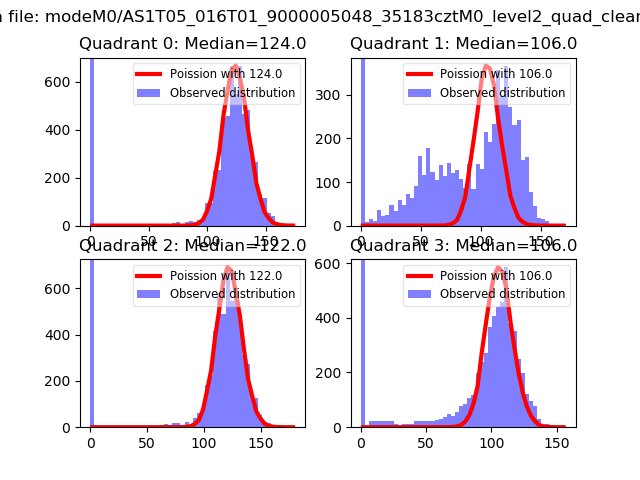 |
 |
| Quadrant-wise count rates Data is divided into 100 sec bins |
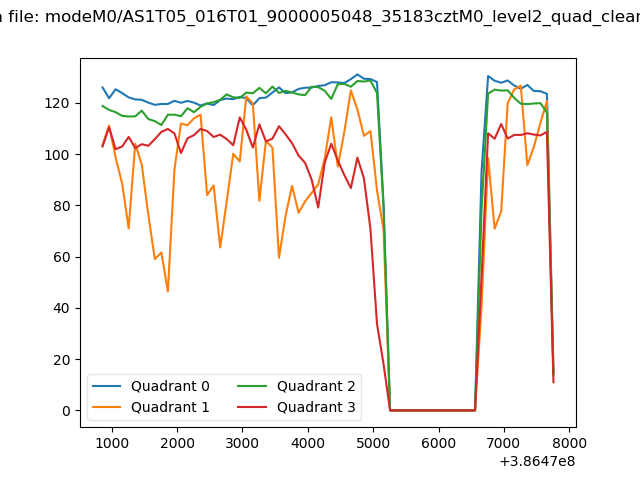 |
|
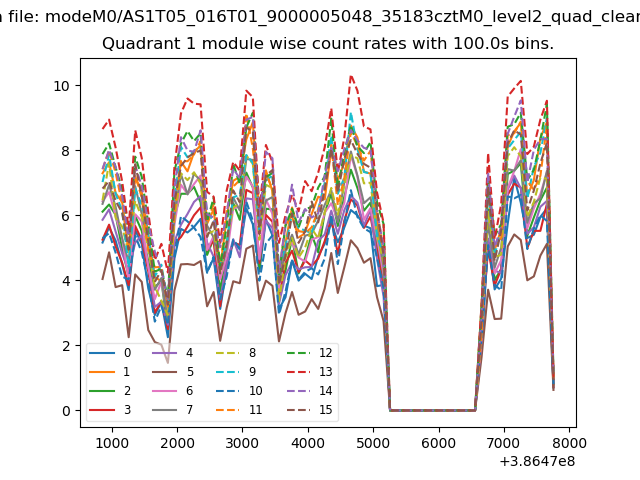
| Module-wise count rates for Quadrant A Data is divided into 100 sec bins |
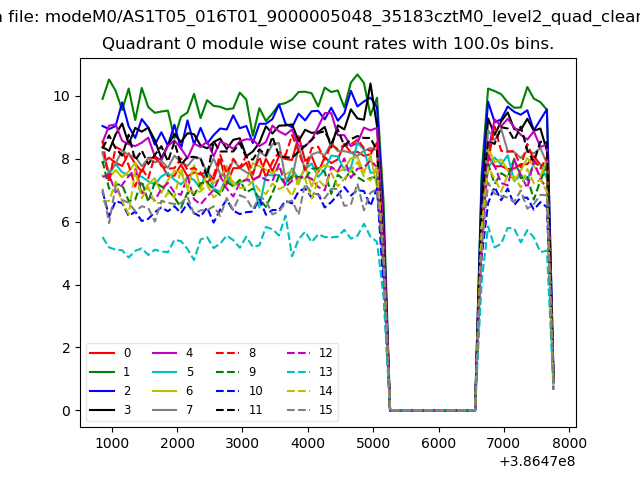 |
 |
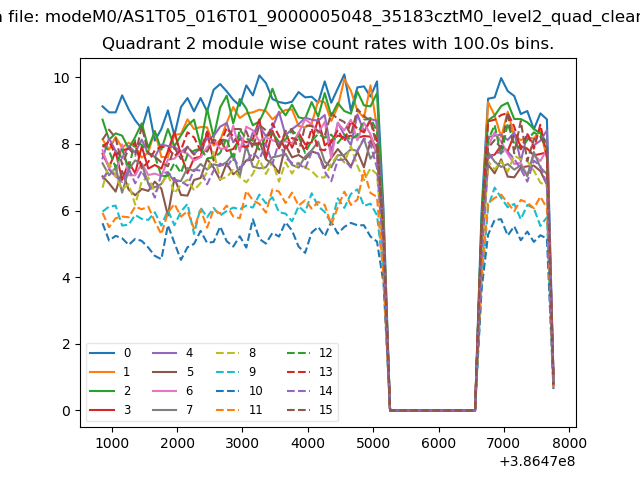
| Module-wise count rates for Quadrant B Data is divided into 100 sec bins |
 |
 |
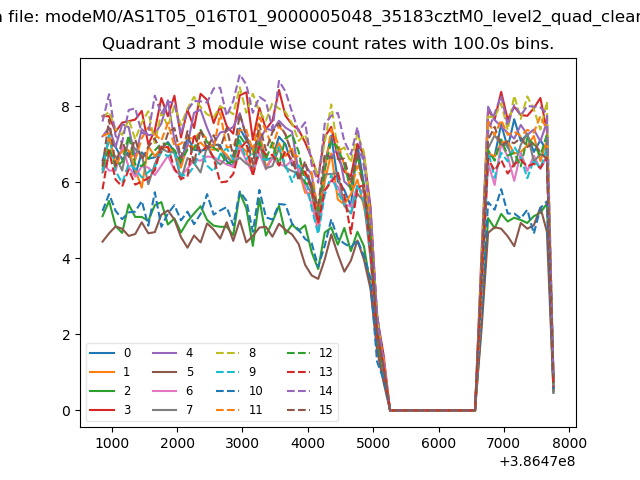
| Module-wise count rates for Quadrant C Data is divided into 100 sec bins |
 |
 |
| Module-wise count rates for Quadrant D Data is divided into 100 sec bins |
 |
 |
| Parameter | Plot |
|---|---|
| CZT HV Monitor |  |
| D_VDD | 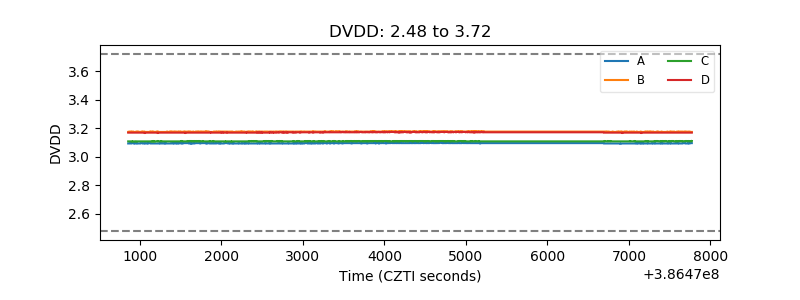 |
| Temperature 1 | 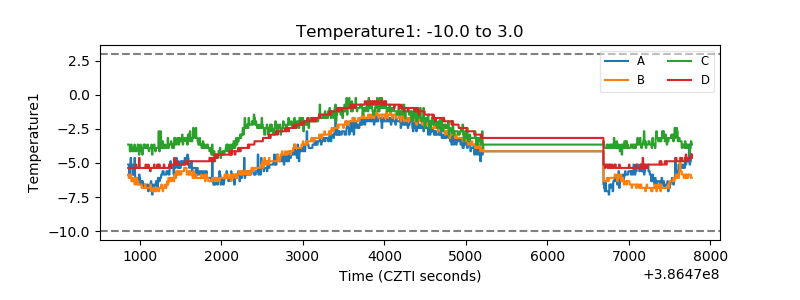 |
| Veto HV Monitor | 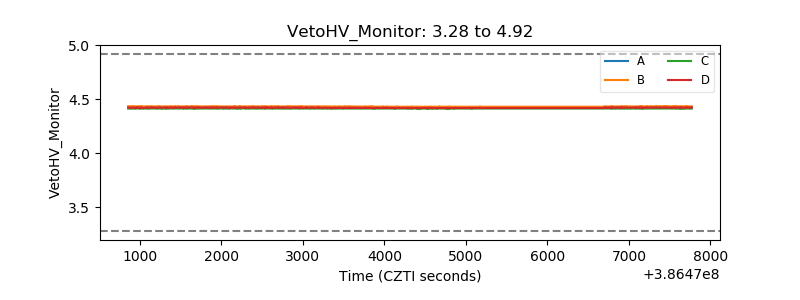 |
| Veto LLD | 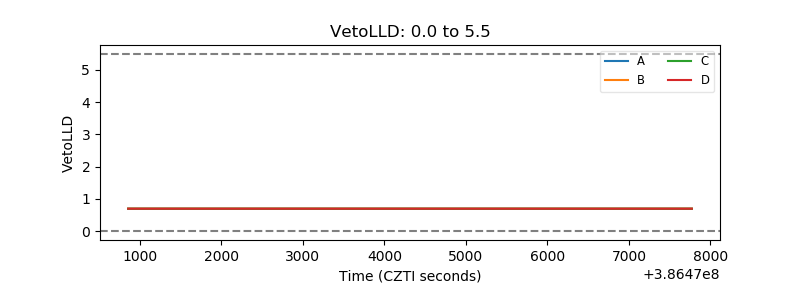 |
| Alpha Counter | 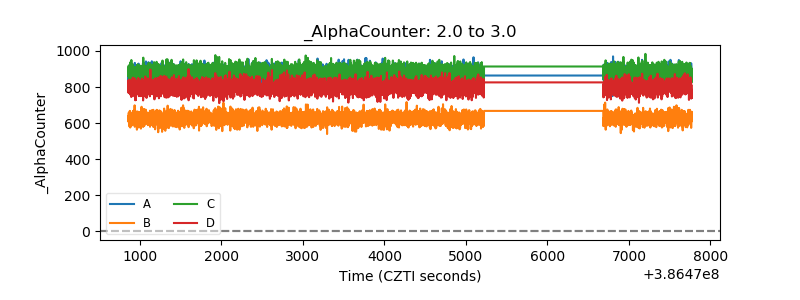 |
| _CPM_Rate | 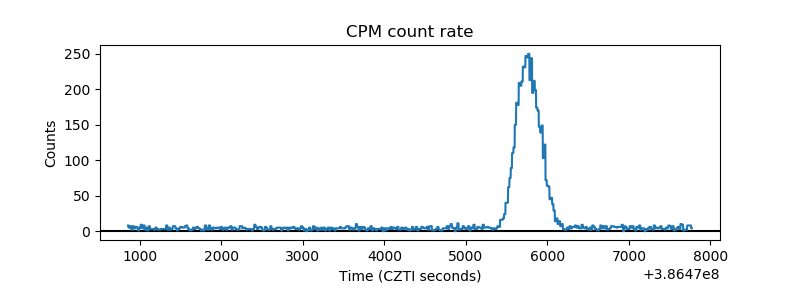 |
| CZT Counter | 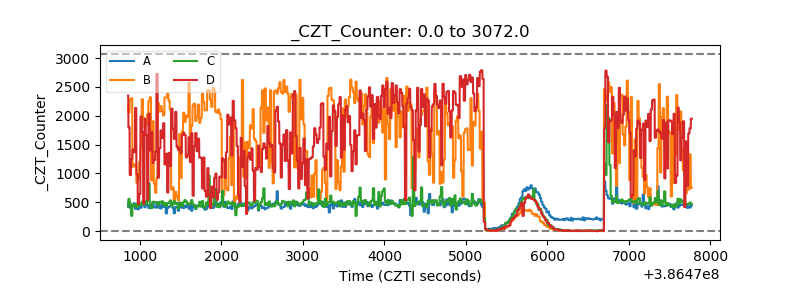 |
| +2.5 Volts monitor | 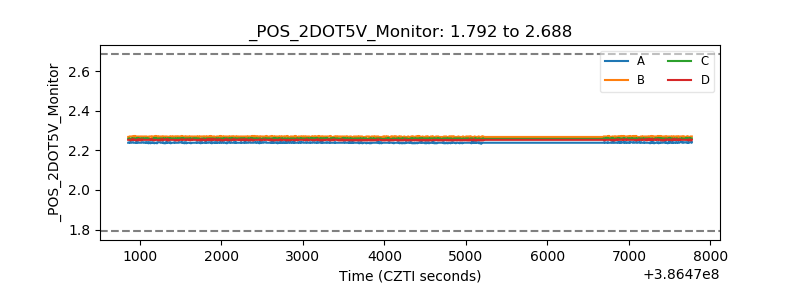 |
| +5 Volts monitor | 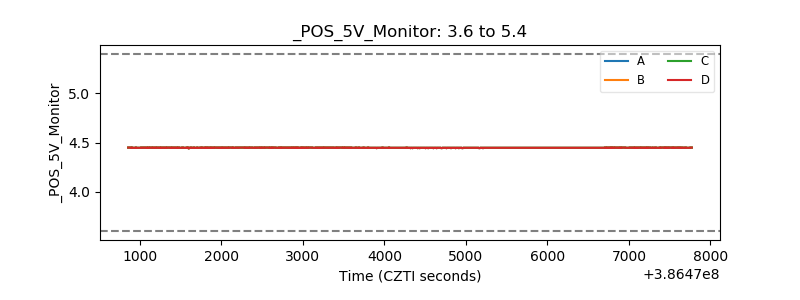 |
| _ROLL_ROT |  |
| _Roll_DEC | 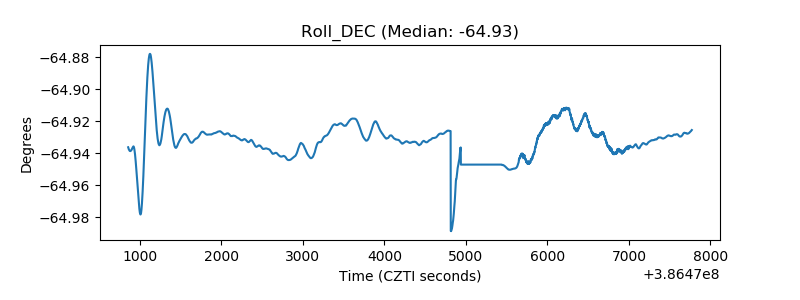 |
| _Roll_RA | 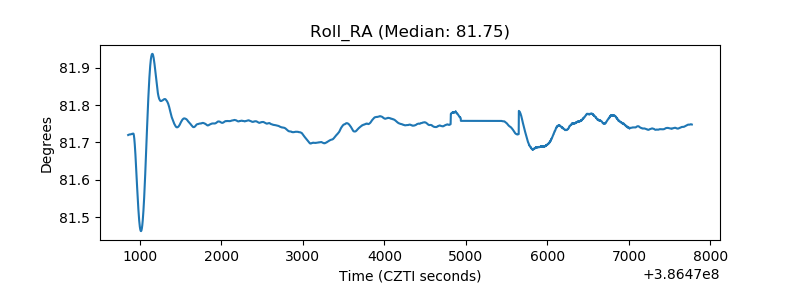 |
| Veto Counter | 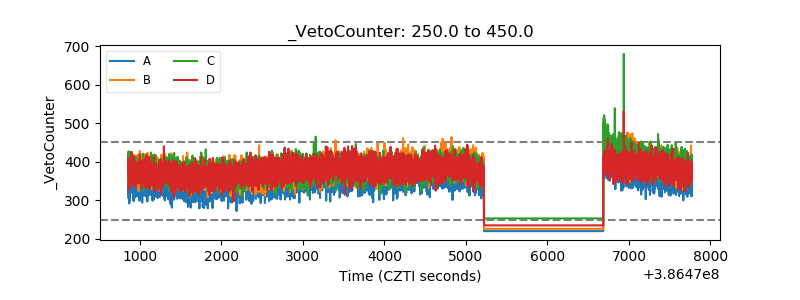 |