| Param | Original file | Final file |
|---|---|---|
| Filename | modeM0/AS1C07_001T06_9000005046_35183cztM0_level2.evt | modeM0/AS1C07_001T06_9000005046_35183cztM0_level2_quad_clean.evt |
| Size (bytes) | 750,479,040 | 88,280,640 |
| Size | 715.7 MB | 84.2 MB |
| Events in quadrant A | 2,406,062 | 631,042 |
| Events in quadrant B | 8,970,408 | 486,187 |
| Events in quadrant C | 2,653,944 | 649,493 |
| Events in quadrant D | 8,350,730 | 543,939 |
| Mode SS | |||
|---|---|---|---|
| Quadrant | BADHDUFLAG | Total packets | Discarded packets |
| A | 0 | 106 | 0 |
| B | 0 | 106 | 0 |
| C | 0 | 106 | 0 |
| D | 0 | 106 | 0 |
| Mode M0 | |||
|---|---|---|---|
| Quadrant | BADHDUFLAG | Total packets | Discarded packets |
| A | 0 | 10715 | 1 |
| B | 0 | 30169 | 1 |
| C | 0 | 11130 | 1 |
| D | 0 | 28398 | 1 |
| Mode M9 | |||
|---|---|---|---|
| Quadrant | BADHDUFLAG | Total packets | Discarded packets |
| A | 0 | 15 | 0 |
| B | 0 | 15 | 0 |
| C | 0 | 15 | 0 |
| D | 0 | 15 | 0 |
| Quadrant | Total seconds | Saturated seconds | Saturation percentage |
|---|---|---|---|
| A | 5154 | 16 | 0.310438% |
| B | 5154 | 2663 | 51.668607% |
| C | 5154 | 26 | 0.504463% |
| D | 5154 | 1595 | 30.946837% |
Noise dominated data is calculated using 1-second bins in cleaned event files. If a bin has >2000 counts, and if more than 50% of those come from <1% of pixels, then it is considered to be noise-dominated and hence unusable.
| Quadrant | # 1 sec bins | Bins with >0 counts | Bins with >2000 counts | High rate bins dominated by noise | Noise dominated (total time) | Noise dominated (detector-on time) | Marked lightcurve |
|---|---|---|---|---|---|---|---|
| A | 6437 | 5155 | 4 | 4 | 0.06% | 0.08% | 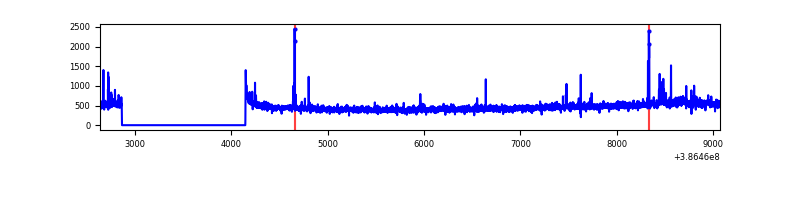 |
| B | 6437 | 5154 | 1874 | 1874 | 29.11% | 36.36% | 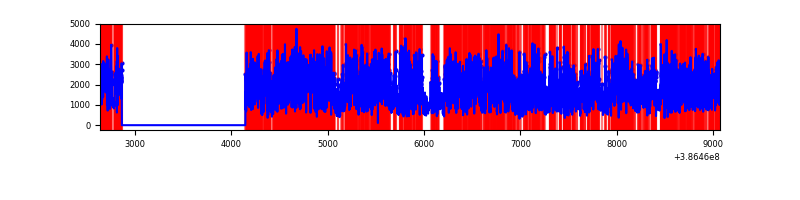 |
| C | 6437 | 5155 | 17 | 17 | 0.26% | 0.33% | 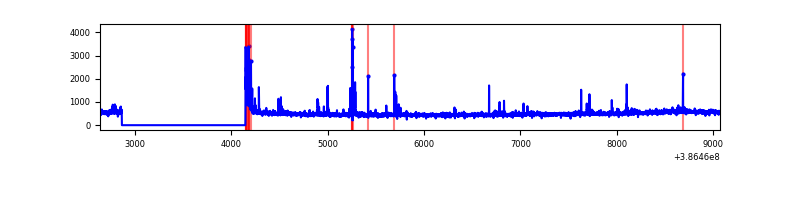 |
| D | 6437 | 5155 | 1453 | 1453 | 22.57% | 28.19% | 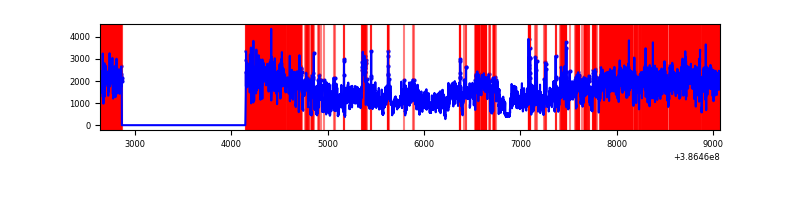 |
Top three noisy pixels from each quadrant. If the there are fewer than three noisy pixels in the level2.evt file, extra rows are filled as -1
| Pixel properties | Quadrant properties | ||||||
|---|---|---|---|---|---|---|---|
| Quadrant | DetID | PixID | Counts | Sigma | Mean | Median | Sigma |
| A | 10 | 83 | 66810 | 556.04 | 583 | 570 | 119.1 |
| A | 9 | 143 | 52996 | 440.08 | 583 | 570 | 119.1 |
| A | 12 | 16 | 14174 | 114.2 | 583 | 570 | 119.1 |
| B | 5 | 236 | 6903687 | 78324.09 | 463 | 450 | 88.1 |
| B | 5 | 172 | 176430 | 1996.67 | 463 | 450 | 88.1 |
| B | 4 | 232 | 48823 | 548.84 | 463 | 450 | 88.1 |
| C | 15 | 214 | 211996 | 1590.87 | 573 | 579 | 132.9 |
| C | 0 | 10 | 76231 | 569.27 | 573 | 579 | 132.9 |
| C | 1 | 23 | 39194 | 290.57 | 573 | 579 | 132.9 |
| D | 8 | 195 | 5554542 | 43110.41 | 529 | 514 | 128.8 |
| D | 7 | 223 | 184748 | 1430.03 | 529 | 514 | 128.8 |
| D | 13 | 249 | 132411 | 1023.79 | 529 | 514 | 128.8 |
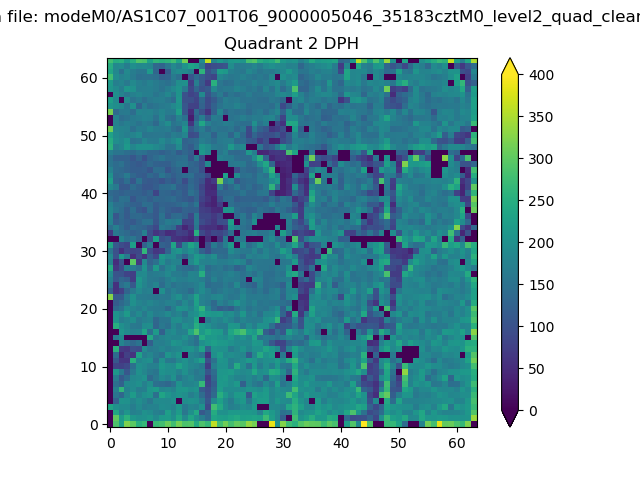
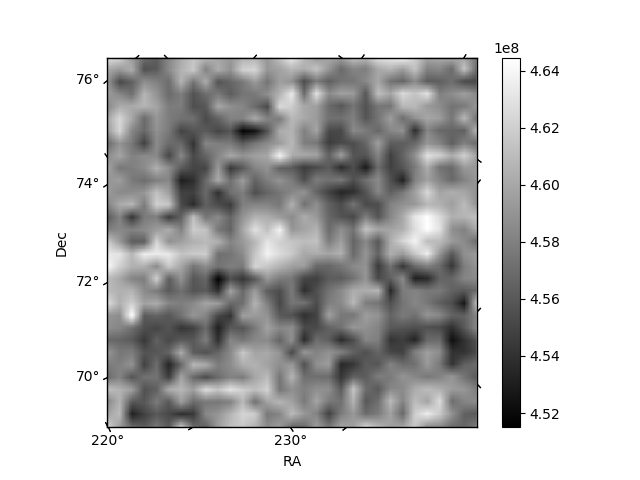
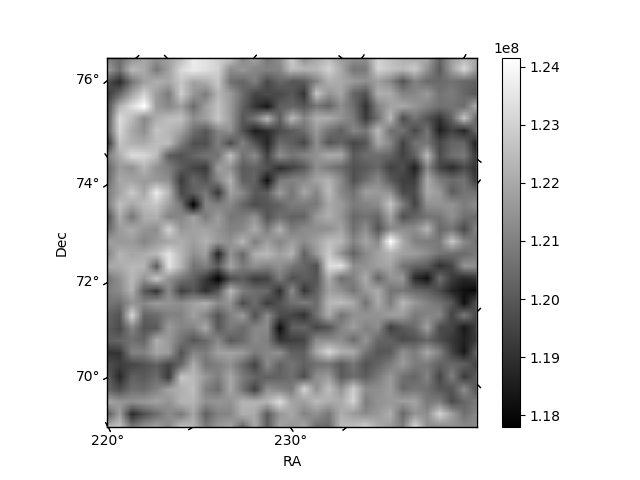
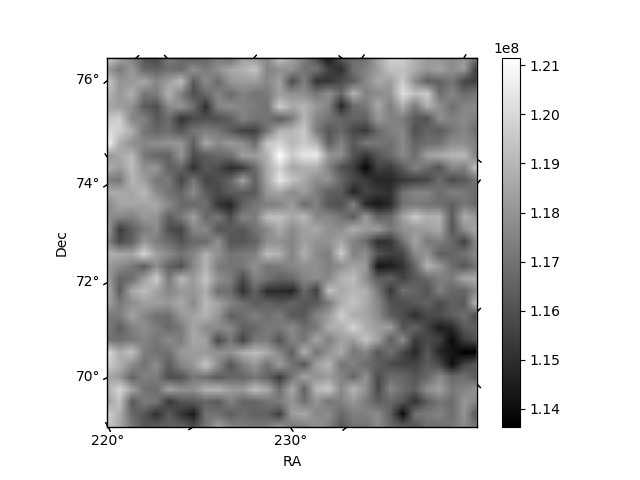
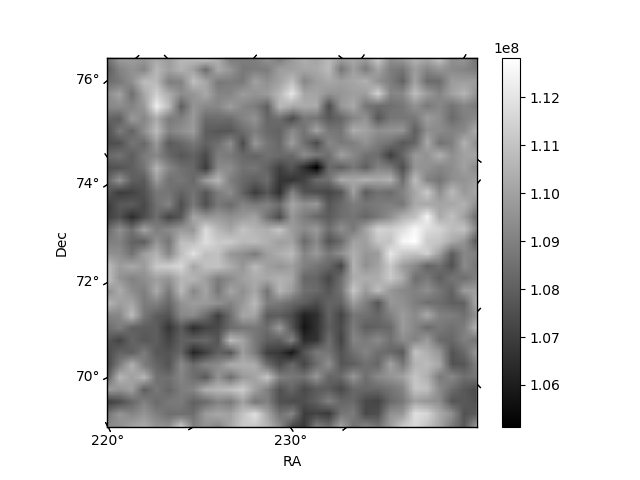
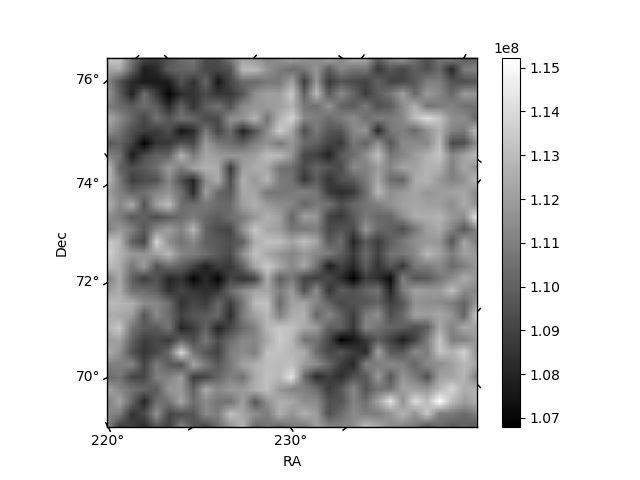
Histogram calculated using DETX and DETY for each event in the final _common_clean file
| Quadrant A | 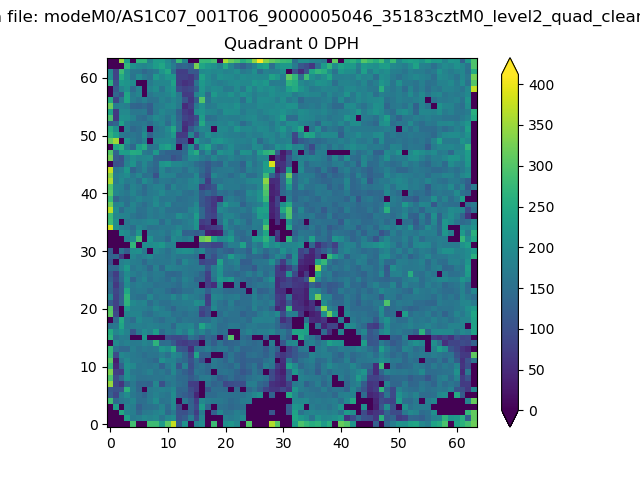 |
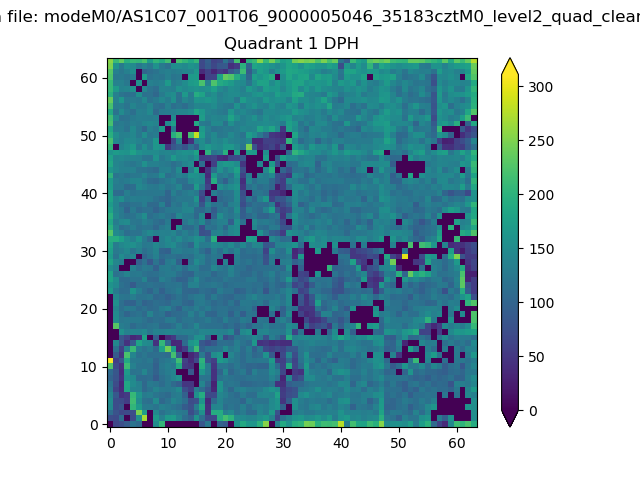 |
Quadrant B |
|---|---|---|---|
| Quadrant D | 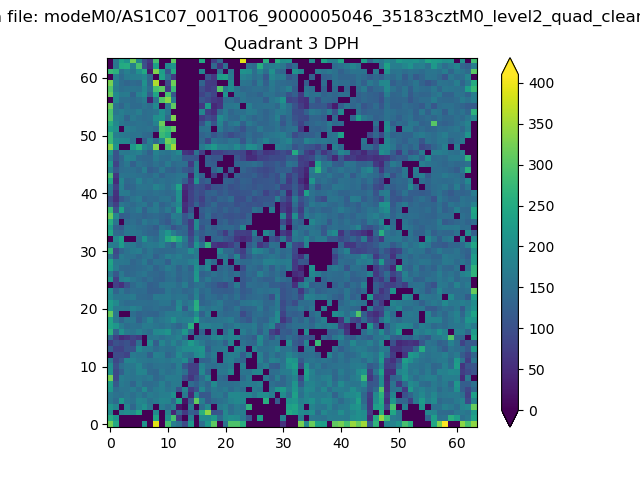 |
 |
Quadrant C |
| Plot type | Count rate plots | Images |
|---|---|---|
| Comparison with Poisson distribution Blue bars denote a histogram of data divided into 1 sec bins. Red curve is a Poisson curve with rate = median count rate of data. |
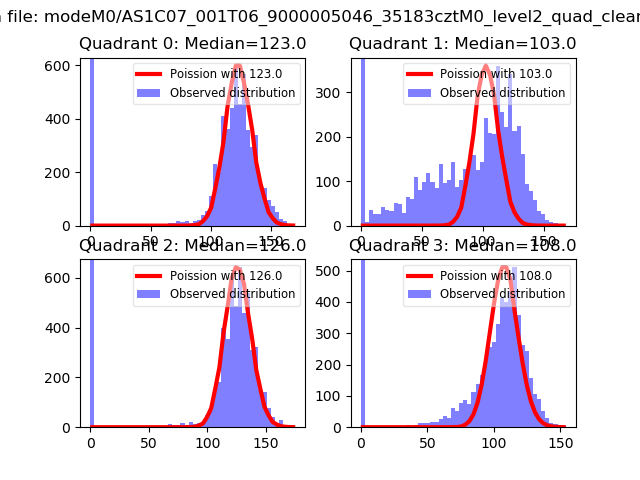 |
 |
| Quadrant-wise count rates Data is divided into 100 sec bins |
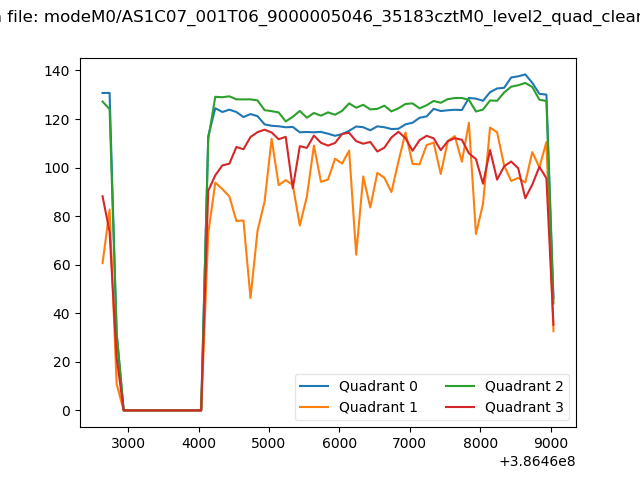 |
|
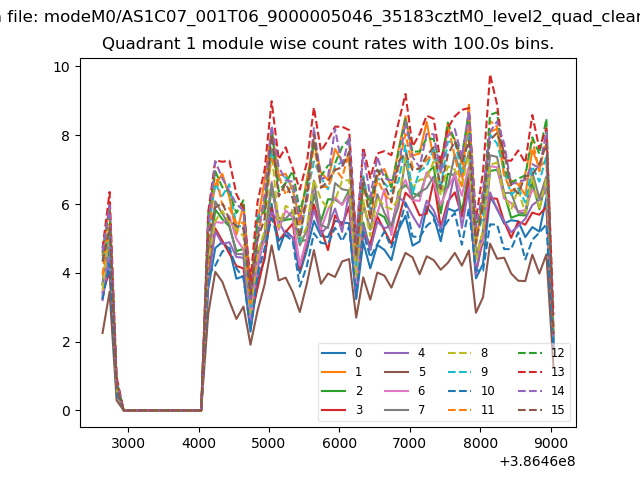
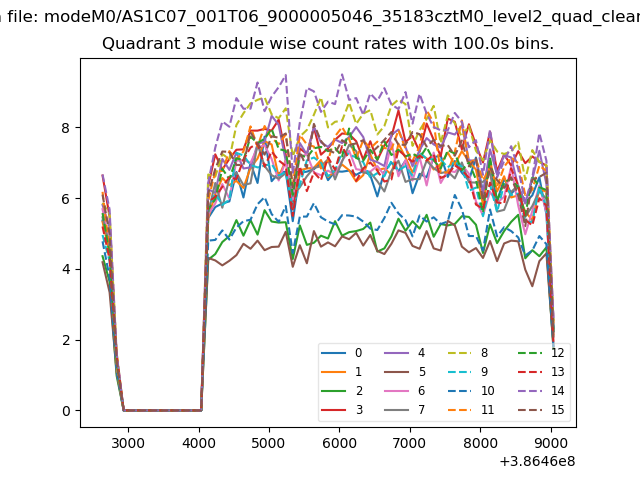
| Module-wise count rates for Quadrant A Data is divided into 100 sec bins |
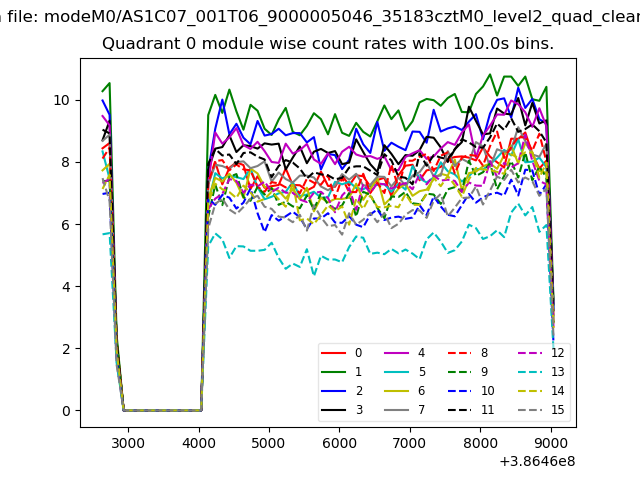 |
 |
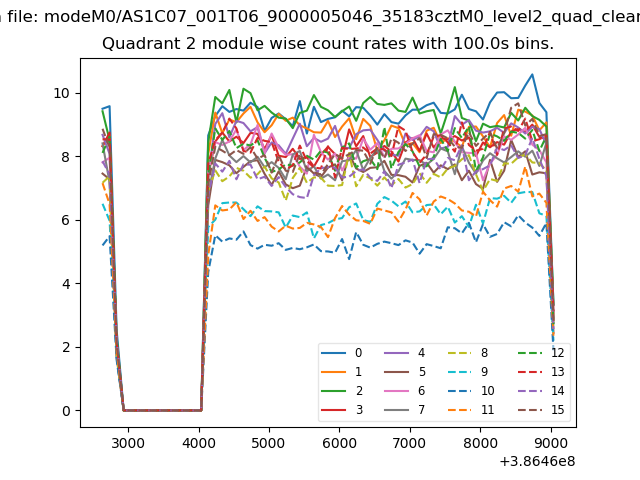
| Module-wise count rates for Quadrant B Data is divided into 100 sec bins |
 |
 |
| Module-wise count rates for Quadrant C Data is divided into 100 sec bins |
 |
 |
| Module-wise count rates for Quadrant D Data is divided into 100 sec bins |
 |
 |
| Parameter | Plot |
|---|---|
| CZT HV Monitor | 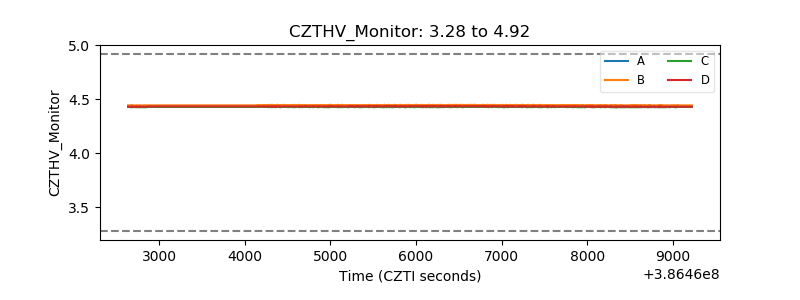 |
| D_VDD | 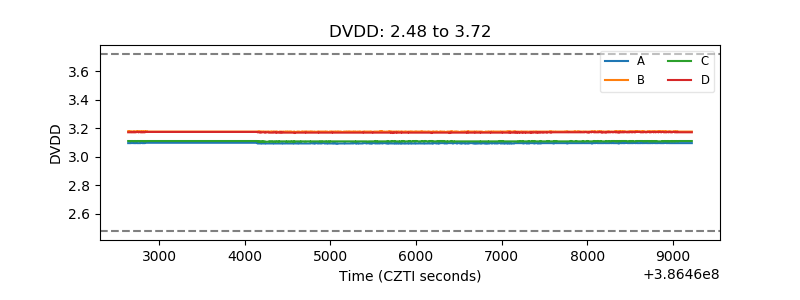 |
| Temperature 1 | 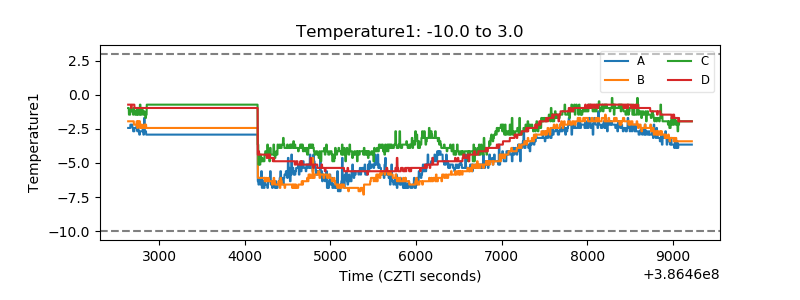 |
| Veto HV Monitor | 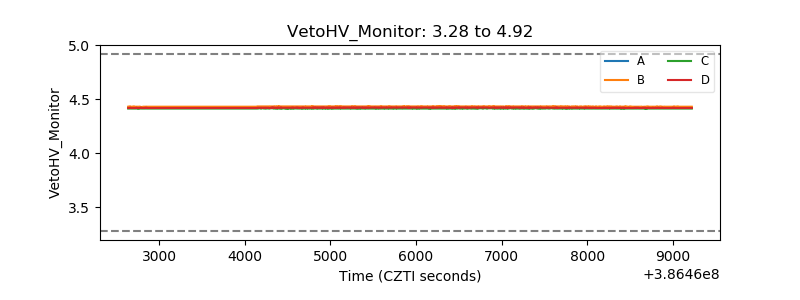 |
| Veto LLD | 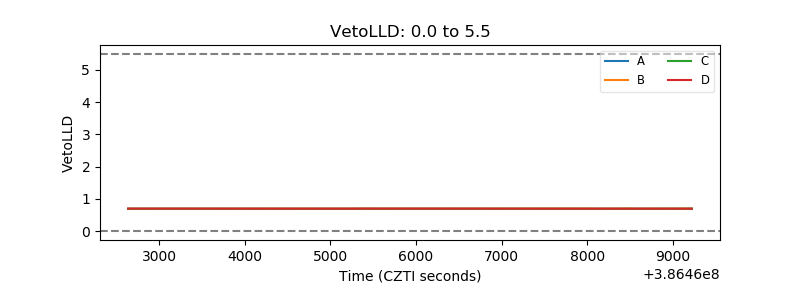 |
| Alpha Counter | 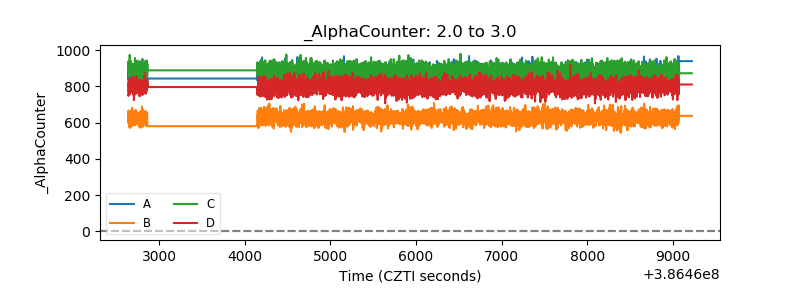 |
| _CPM_Rate | 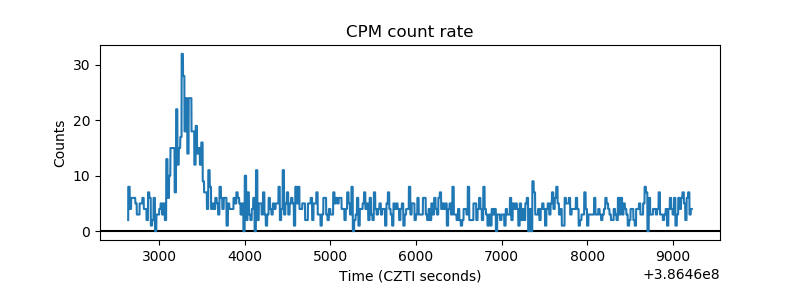 |
| CZT Counter | 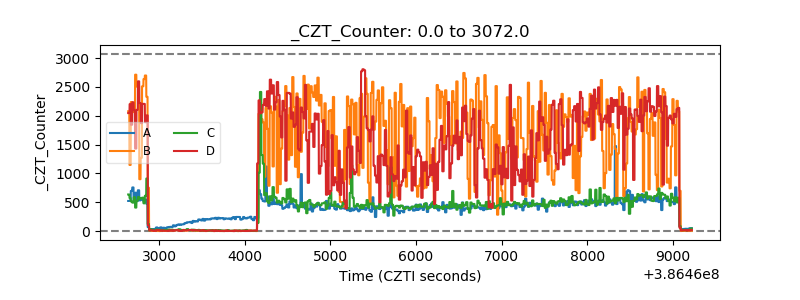 |
| +2.5 Volts monitor | 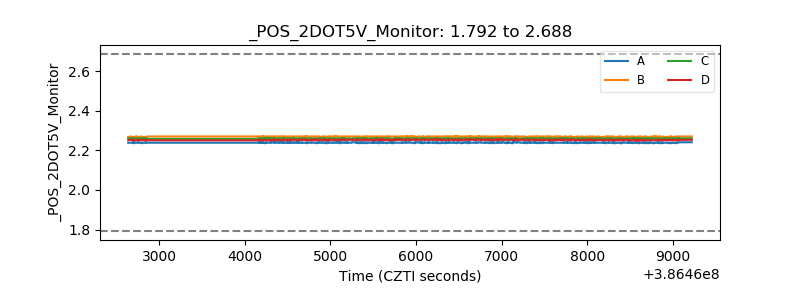 |
| +5 Volts monitor | 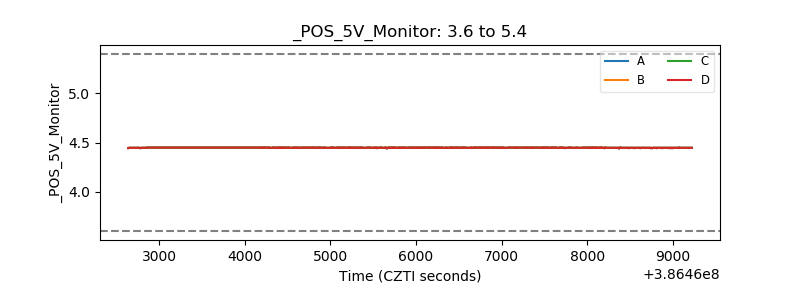 |
| _ROLL_ROT | 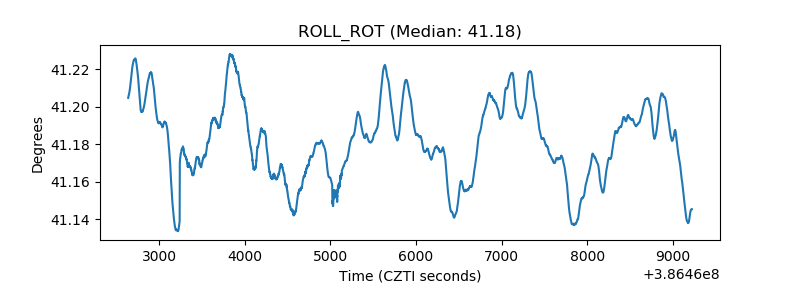 |
| _Roll_DEC |  |
| _Roll_RA | 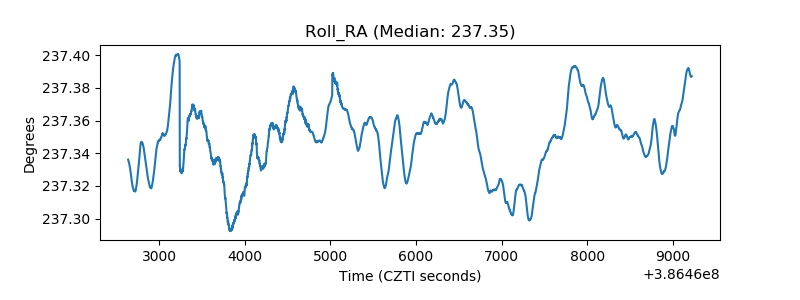 |
| Veto Counter | 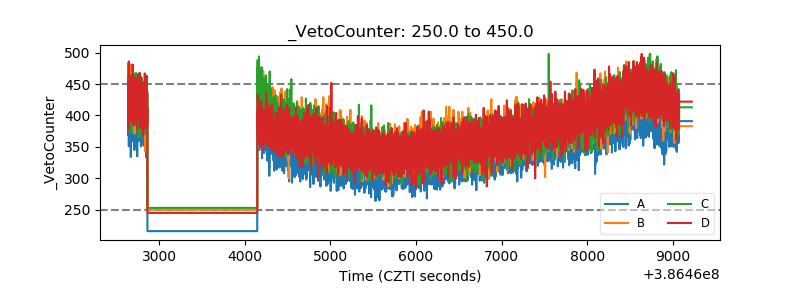 |