| Param | Original file | Final file |
|---|---|---|
| Filename | modeM0/AS1C07_001T06_9000005046_35173cztM0_level2.evt | modeM0/AS1C07_001T06_9000005046_35173cztM0_level2_quad_clean.evt |
| Size (bytes) | 754,966,080 | 99,069,120 |
| Size | 720.0 MB | 94.5 MB |
| Events in quadrant A | 2,627,718 | 730,266 |
| Events in quadrant B | 9,225,059 | 556,756 |
| Events in quadrant C | 3,081,129 | 712,364 |
| Events in quadrant D | 7,579,824 | 634,826 |
| Mode SS | |||
|---|---|---|---|
| Quadrant | BADHDUFLAG | Total packets | Discarded packets |
| A | 0 | 106 | 0 |
| B | 0 | 106 | 0 |
| C | 0 | 106 | 0 |
| D | 0 | 106 | 0 |
| Mode M0 | |||
|---|---|---|---|
| Quadrant | BADHDUFLAG | Total packets | Discarded packets |
| A | 0 | 10974 | 3 |
| B | 0 | 30956 | 2 |
| C | 0 | 12142 | 2 |
| D | 0 | 26142 | 2 |
| Mode M9 | |||
|---|---|---|---|
| Quadrant | BADHDUFLAG | Total packets | Discarded packets |
| A | 0 | 19 | 0 |
| B | 0 | 19 | 0 |
| C | 0 | 19 | 0 |
| D | 0 | 19 | 0 |
| Quadrant | Total seconds | Saturated seconds | Saturation percentage |
|---|---|---|---|
| A | 5202 | 16 | 0.307574% |
| B | 5202 | 2785 | 53.537101% |
| C | 5202 | 94 | 1.806997% |
| D | 5202 | 1025 | 19.703960% |
Noise dominated data is calculated using 1-second bins in cleaned event files. If a bin has >2000 counts, and if more than 50% of those come from <1% of pixels, then it is considered to be noise-dominated and hence unusable.
| Quadrant | # 1 sec bins | Bins with >0 counts | Bins with >2000 counts | High rate bins dominated by noise | Noise dominated (total time) | Noise dominated (detector-on time) | Marked lightcurve |
|---|---|---|---|---|---|---|---|
| A | 7115 | 5203 | 3 | 3 | 0.04% | 0.06% | 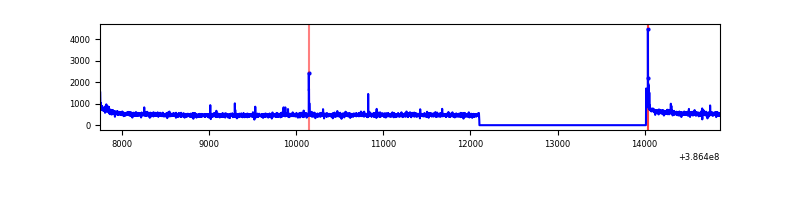 |
| B | 7115 | 5203 | 2010 | 2010 | 28.25% | 38.63% | 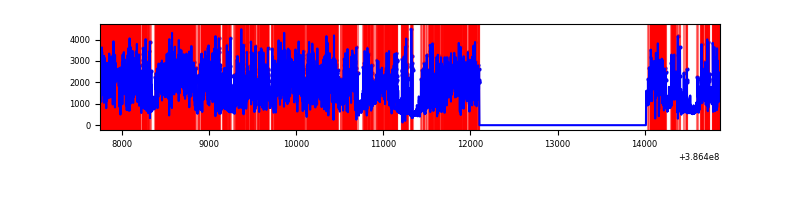 |
| C | 7115 | 5203 | 77 | 77 | 1.08% | 1.48% | 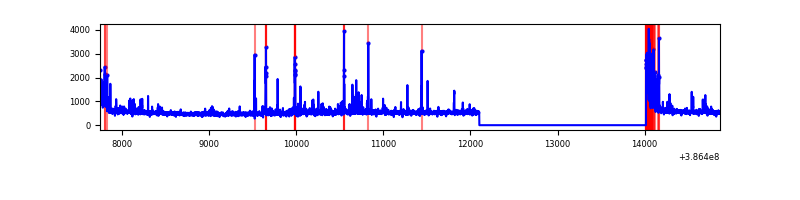 |
| D | 7115 | 5203 | 995 | 995 | 13.98% | 19.12% | 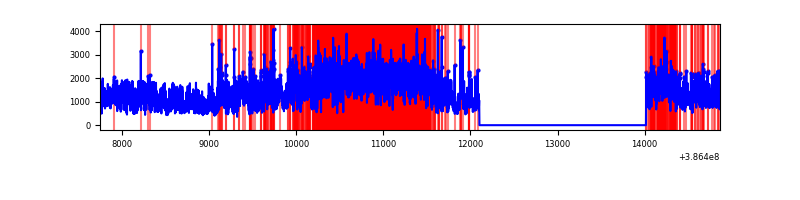 |
Top three noisy pixels from each quadrant. If the there are fewer than three noisy pixels in the level2.evt file, extra rows are filled as -1
| Pixel properties | Quadrant properties | ||||||
|---|---|---|---|---|---|---|---|
| Quadrant | DetID | PixID | Counts | Sigma | Mean | Median | Sigma |
| A | 10 | 83 | 95620 | 754.02 | 639 | 628 | 126.0 |
| A | 9 | 143 | 22556 | 174.06 | 639 | 628 | 126.0 |
| A | 13 | 6 | 13885 | 105.23 | 639 | 628 | 126.0 |
| B | 5 | 236 | 6761913 | 70581.26 | 502 | 489 | 95.8 |
| B | 5 | 172 | 329976 | 3439.45 | 502 | 489 | 95.8 |
| B | 15 | 85 | 48365 | 499.77 | 502 | 489 | 95.8 |
| C | 0 | 10 | 267795 | 1933.41 | 604 | 608 | 138.2 |
| C | 15 | 214 | 219731 | 1585.61 | 604 | 608 | 138.2 |
| C | 0 | 207 | 98039 | 705.03 | 604 | 608 | 138.2 |
| D | 8 | 195 | 4502702 | 31652.38 | 595 | 580 | 142.2 |
| D | 2 | 250 | 154685 | 1083.44 | 595 | 580 | 142.2 |
| D | 13 | 249 | 129864 | 908.94 | 595 | 580 | 142.2 |
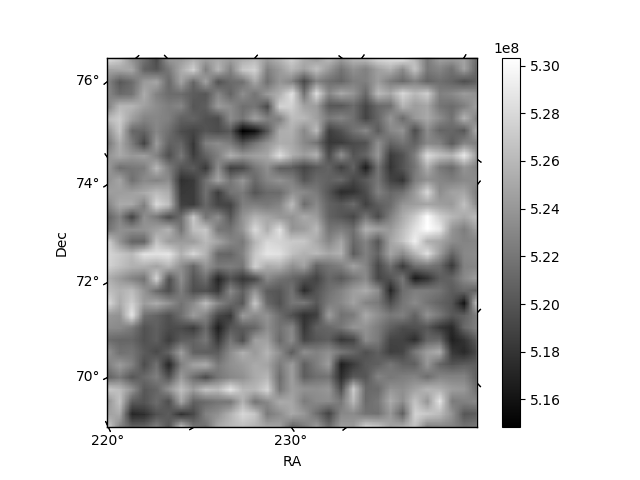
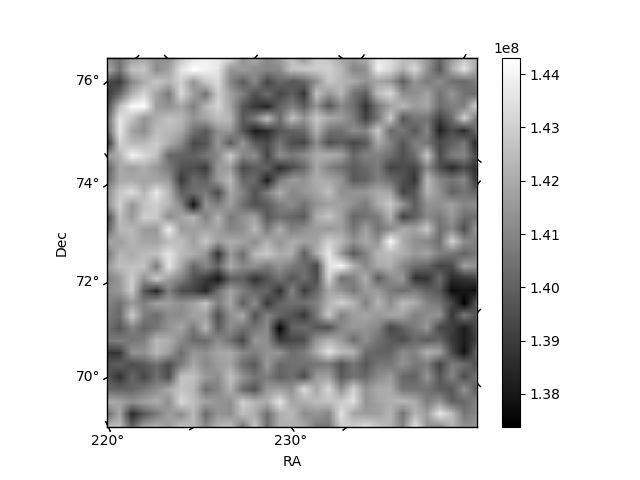
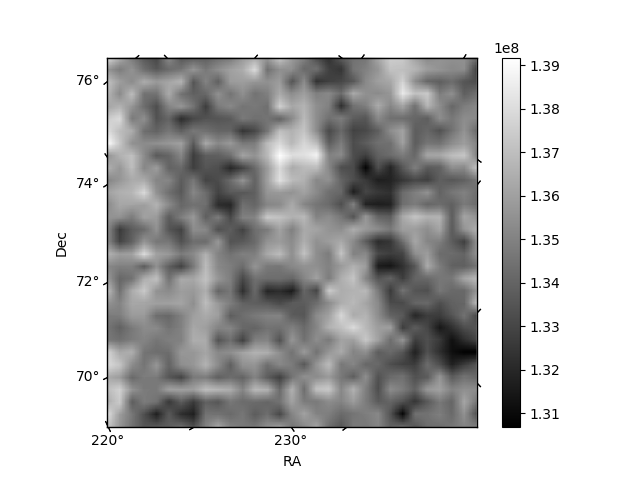
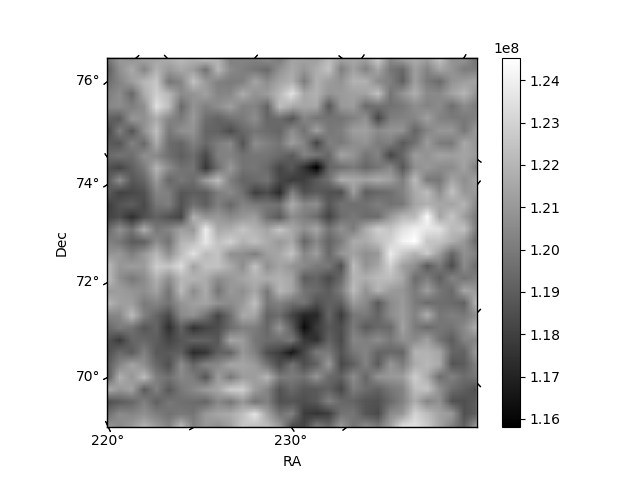
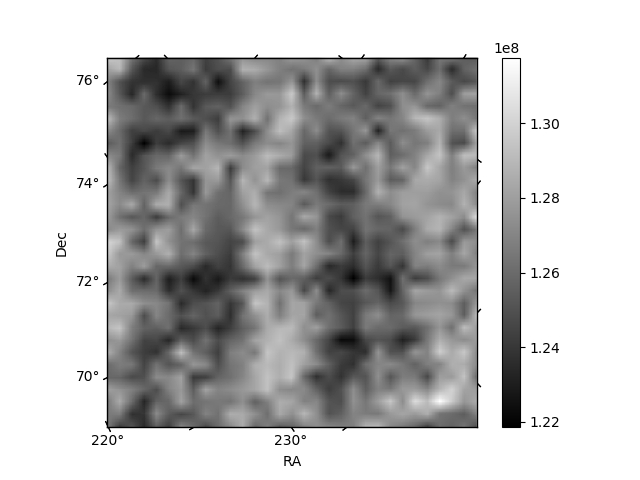
Histogram calculated using DETX and DETY for each event in the final _common_clean file
| Quadrant A | 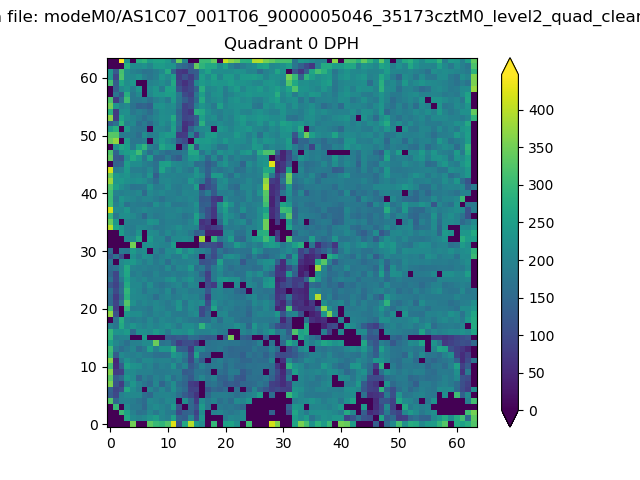 |
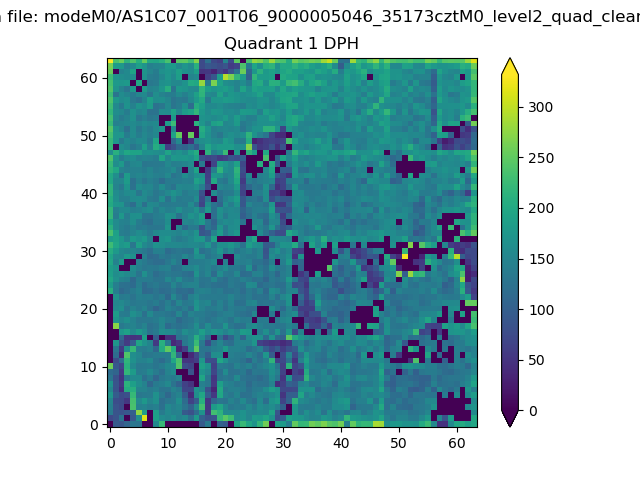 |
Quadrant B |
|---|---|---|---|
| Quadrant D | 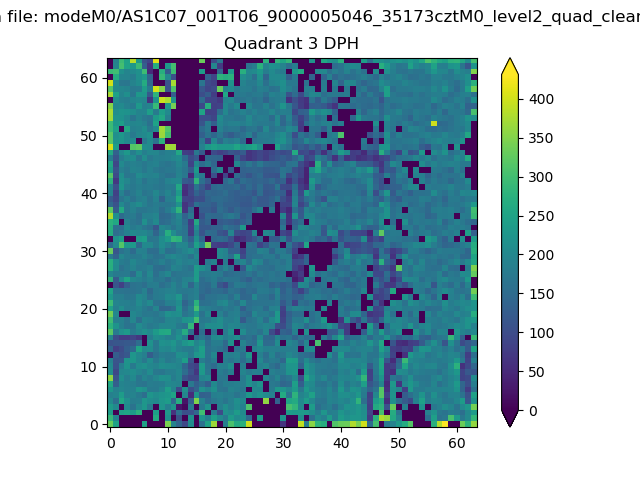 |
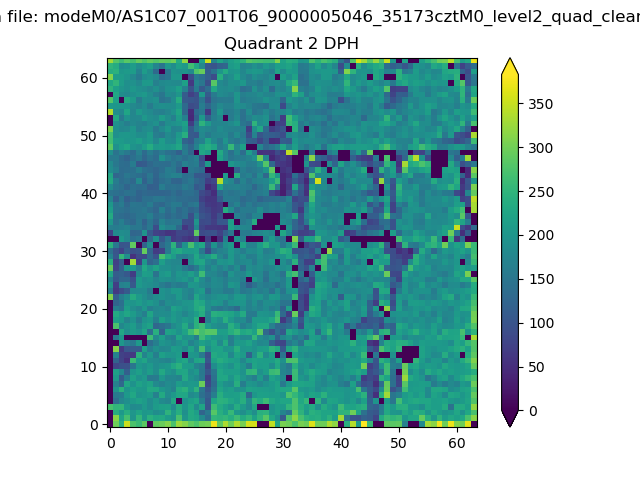 |
Quadrant C |
| Plot type | Count rate plots | Images |
|---|---|---|
| Comparison with Poisson distribution Blue bars denote a histogram of data divided into 1 sec bins. Red curve is a Poisson curve with rate = median count rate of data. |
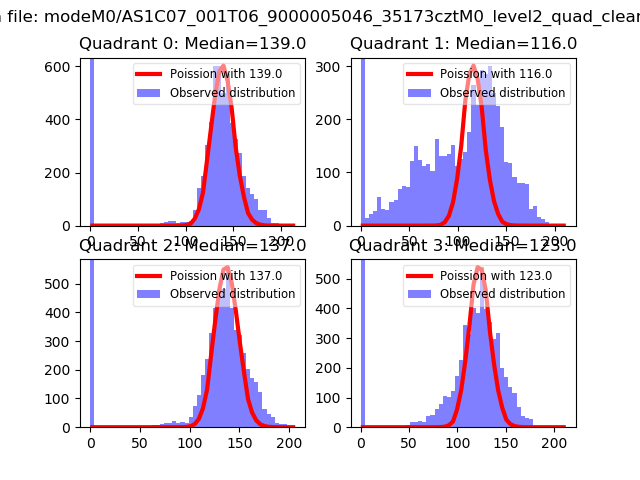 |
 |
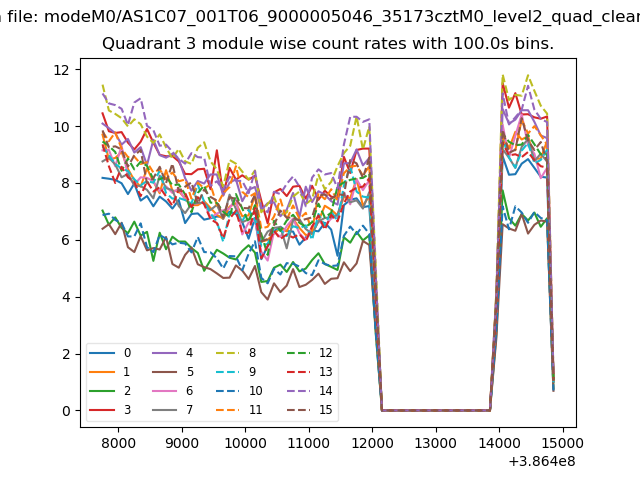
| Quadrant-wise count rates Data is divided into 100 sec bins |
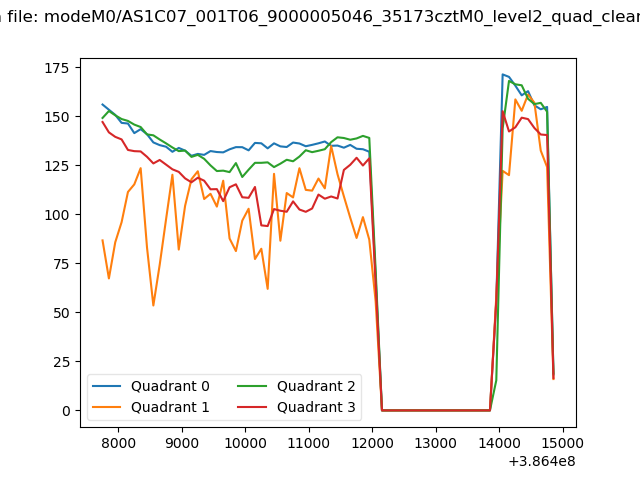 |
|
| Module-wise count rates for Quadrant A Data is divided into 100 sec bins |
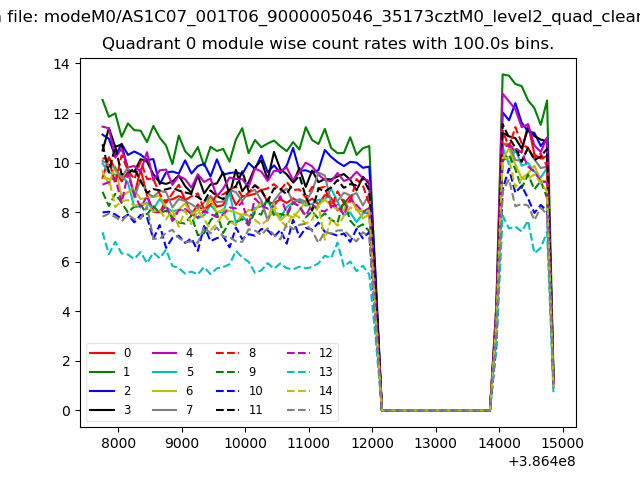 |
 |
| Module-wise count rates for Quadrant B Data is divided into 100 sec bins |
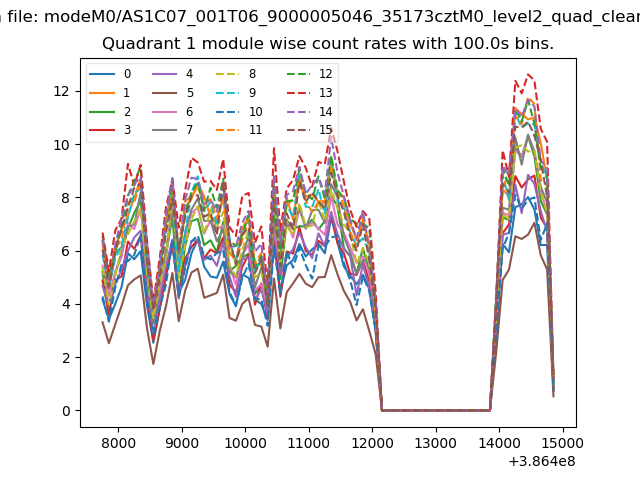 |
 |
| Module-wise count rates for Quadrant C Data is divided into 100 sec bins |
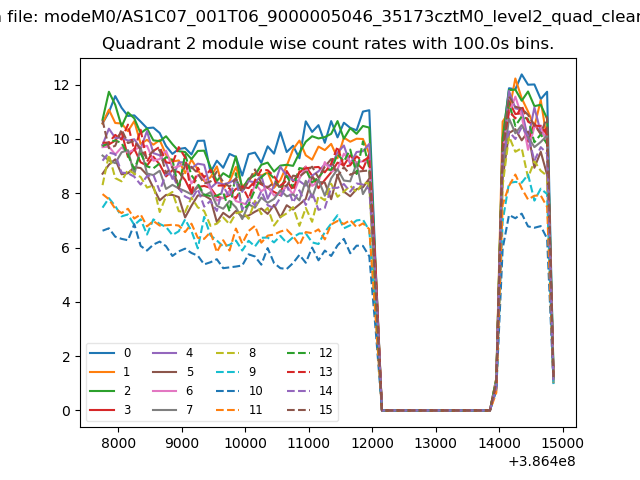 |
 |
| Module-wise count rates for Quadrant D Data is divided into 100 sec bins |
 |
 |
| Parameter | Plot |
|---|---|
| CZT HV Monitor | 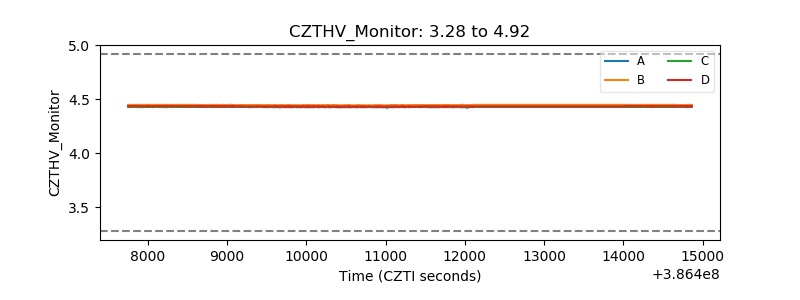 |
| D_VDD | 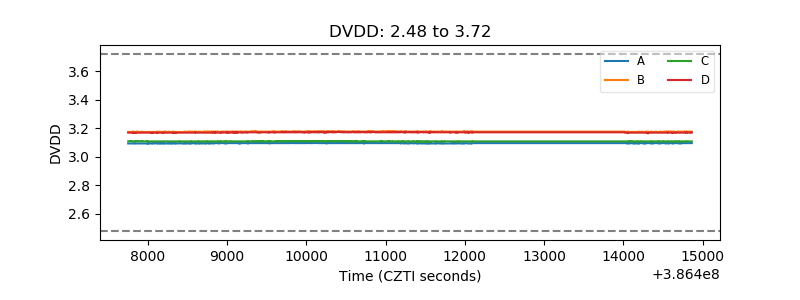 |
| Temperature 1 | 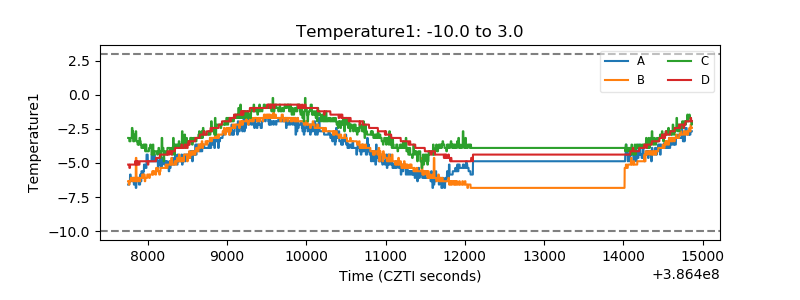 |
| Veto HV Monitor | 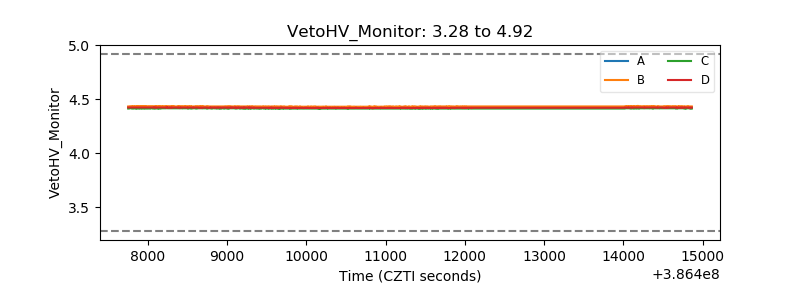 |
| Veto LLD | 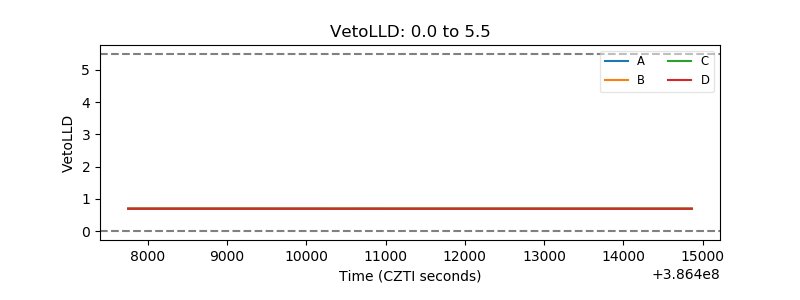 |
| Alpha Counter | 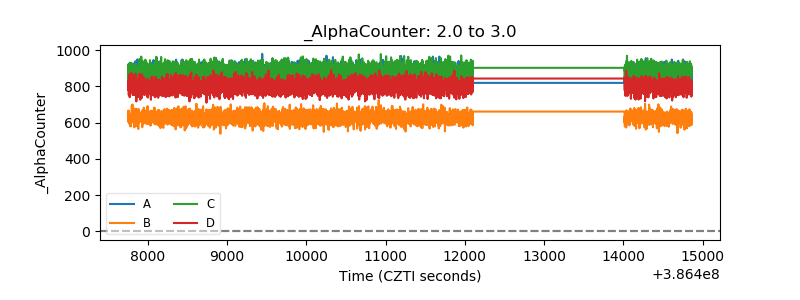 |
| _CPM_Rate | 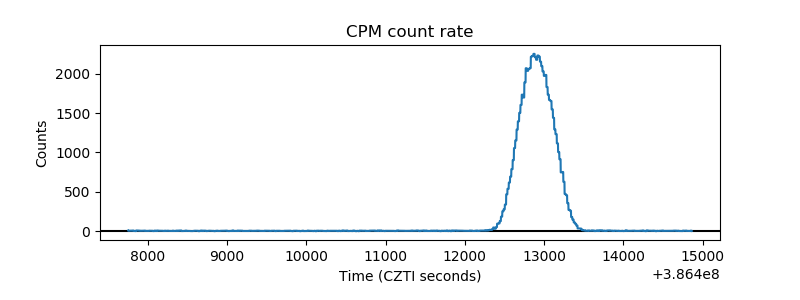 |
| CZT Counter | 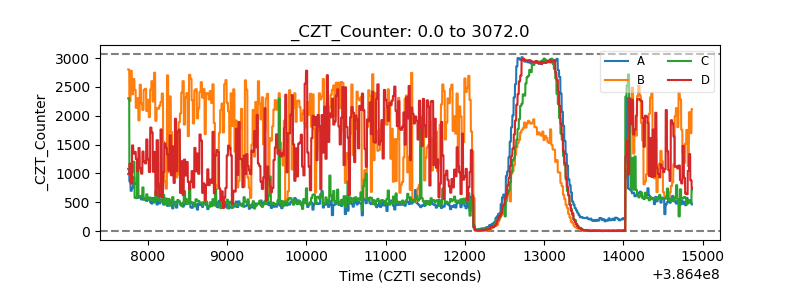 |
| +2.5 Volts monitor | 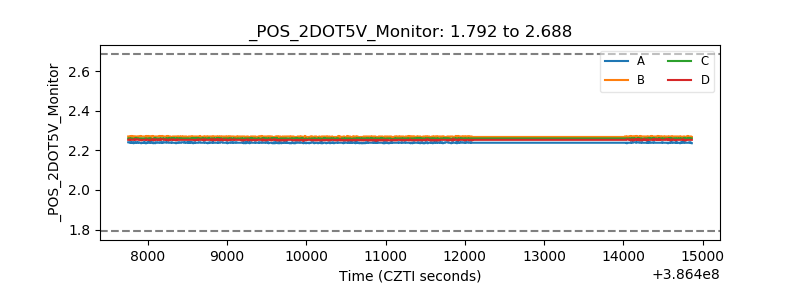 |
| +5 Volts monitor | 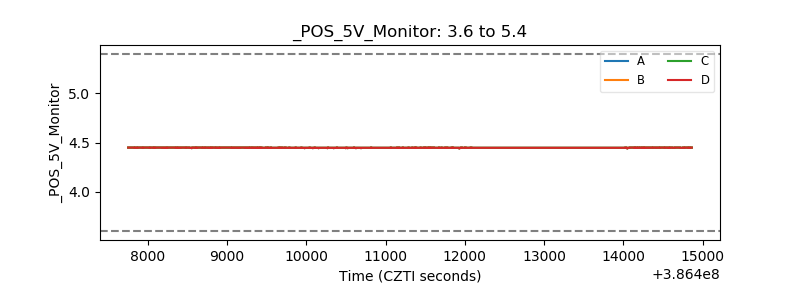 |
| _ROLL_ROT | 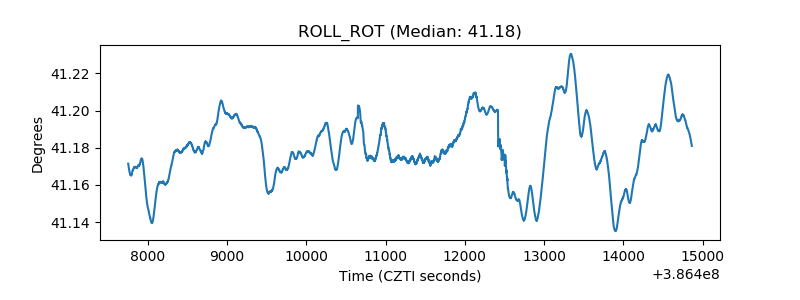 |
| _Roll_DEC | 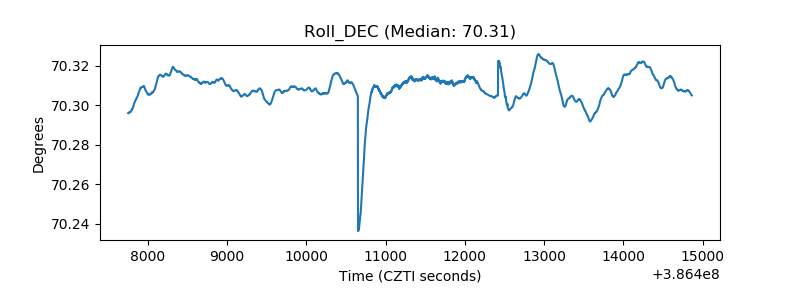 |
| _Roll_RA | 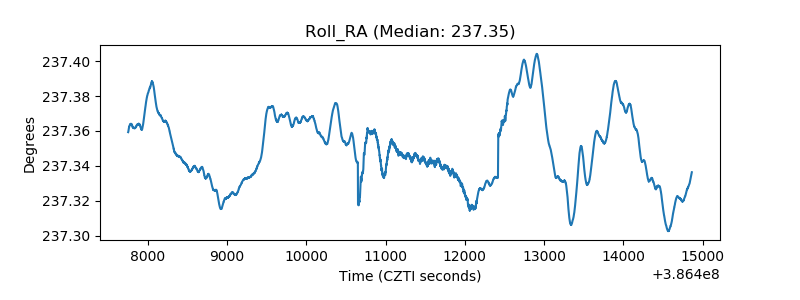 |
| Veto Counter | 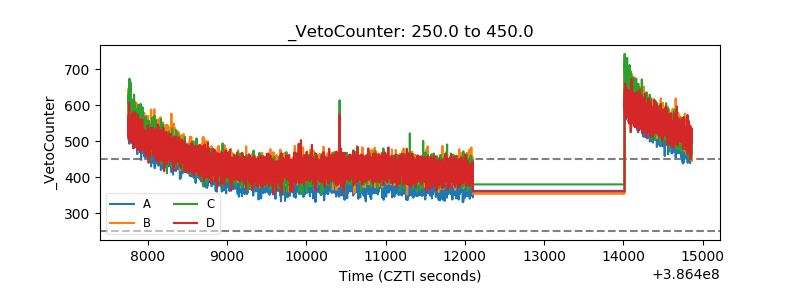 |