| Param | Original file | Final file |
|---|---|---|
| Filename | modeM0/AS1C07_004T01_9000005042_35162cztM0_level2.evt | modeM0/AS1C07_004T01_9000005042_35162cztM0_level2_quad_clean.evt |
| Size (bytes) | 135,558,720 | 18,411,840 |
| Size | 129.3 MB | 17.6 MB |
| Events in quadrant A | 600,219 | 134,277 |
| Events in quadrant B | 907,954 | 126,441 |
| Events in quadrant C | 637,549 | 133,023 |
| Events in quadrant D | 1,893,228 | 90,181 |
| Mode M9 | |||
|---|---|---|---|
| Quadrant | BADHDUFLAG | Total packets | Discarded packets |
| A | 0 | 2 | 0 |
| B | 0 | 2 | 0 |
| C | 0 | 2 | 0 |
| D | 0 | 2 | 0 |
| Mode M0 | |||
|---|---|---|---|
| Quadrant | BADHDUFLAG | Total packets | Discarded packets |
| A | 0 | 2366 | 2 |
| B | 0 | 3312 | 1 |
| C | 0 | 2421 | 1 |
| D | 0 | 6288 | 1 |
| Mode SS | |||
|---|---|---|---|
| Quadrant | BADHDUFLAG | Total packets | Discarded packets |
| A | 0 | 20 | 0 |
| B | 0 | 20 | 0 |
| C | 0 | 20 | 0 |
| D | 0 | 20 | 0 |
| Quadrant | Total seconds | Saturated seconds | Saturation percentage |
|---|---|---|---|
| A | 935 | 25 | 2.673797% |
| B | 935 | 141 | 15.080214% |
| C | 935 | 54 | 5.775401% |
| D | 935 | 618 | 66.096257% |
Noise dominated data is calculated using 1-second bins in cleaned event files. If a bin has >2000 counts, and if more than 50% of those come from <1% of pixels, then it is considered to be noise-dominated and hence unusable.
| Quadrant | # 1 sec bins | Bins with >0 counts | Bins with >2000 counts | High rate bins dominated by noise | Noise dominated (total time) | Noise dominated (detector-on time) | Marked lightcurve |
|---|---|---|---|---|---|---|---|
| A | 935 | 935 | 21 | 21 | 2.25% | 2.25% | 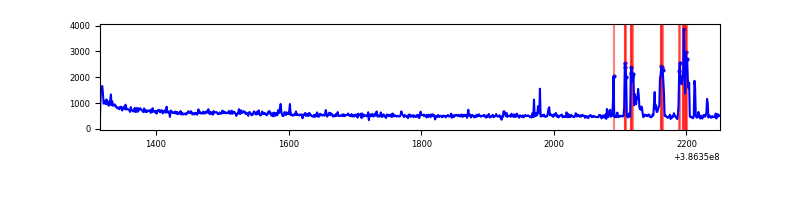 |
| B | 935 | 935 | 87 | 87 | 9.30% | 9.30% | 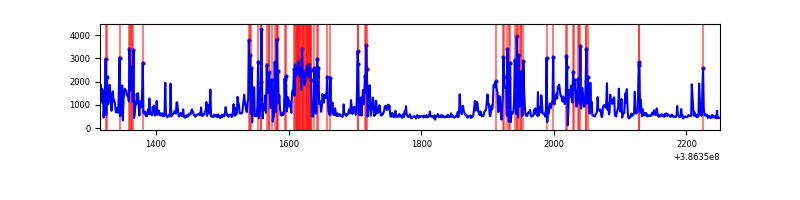 |
| C | 935 | 935 | 39 | 39 | 4.17% | 4.17% | 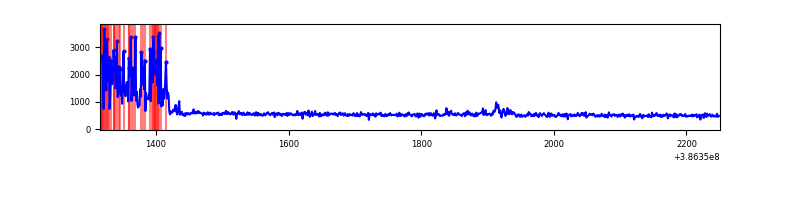 |
| D | 935 | 935 | 528 | 528 | 56.47% | 56.47% | 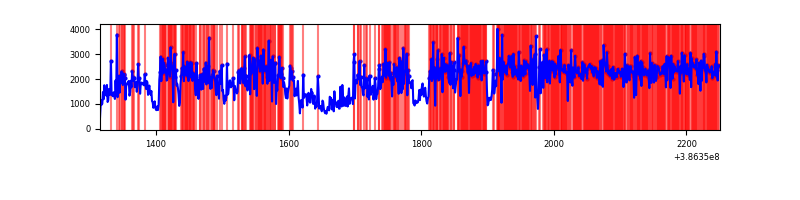 |
Top three noisy pixels from each quadrant. If the there are fewer than three noisy pixels in the level2.evt file, extra rows are filled as -1
| Pixel properties | Quadrant properties | ||||||
|---|---|---|---|---|---|---|---|
| Quadrant | DetID | PixID | Counts | Sigma | Mean | Median | Sigma |
| A | 15 | 169 | 87758 | 3357.77 | 119 | 117 | 26.1 |
| A | 10 | 83 | 36592 | 1397.46 | 119 | 117 | 26.1 |
| A | 9 | 143 | 11408 | 432.59 | 119 | 117 | 26.1 |
| B | 5 | 236 | 430200 | 18964.28 | 108 | 106 | 22.7 |
| B | 5 | 172 | 49486 | 2177.33 | 108 | 106 | 22.7 |
| B | 12 | 111 | 2347 | 98.81 | 108 | 106 | 22.7 |
| C | 0 | 10 | 155348 | 5724.2 | 110 | 111 | 27.1 |
| C | 15 | 214 | 41884 | 1540.33 | 110 | 111 | 27.1 |
| C | 0 | 207 | 8744 | 318.33 | 110 | 111 | 27.1 |
| D | 5 | 223 | 1160438 | 49773.08 | 86 | 84 | 23.3 |
| D | 8 | 195 | 198320 | 8503.28 | 86 | 84 | 23.3 |
| D | 13 | 249 | 112664 | 4829.09 | 86 | 84 | 23.3 |
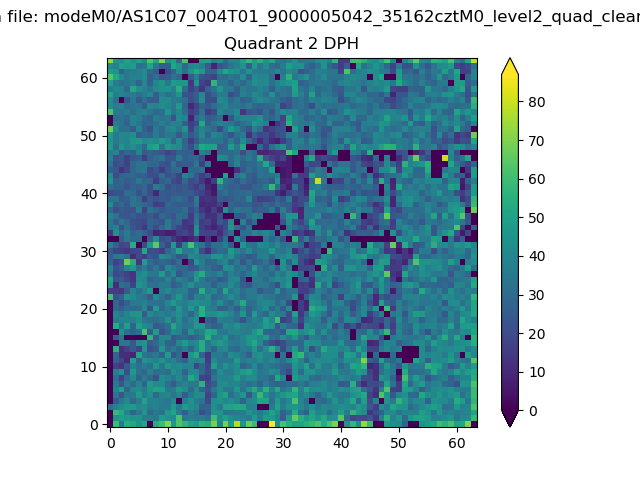
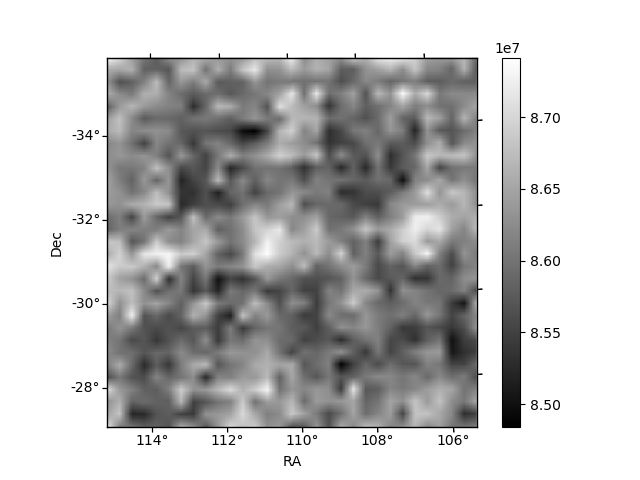
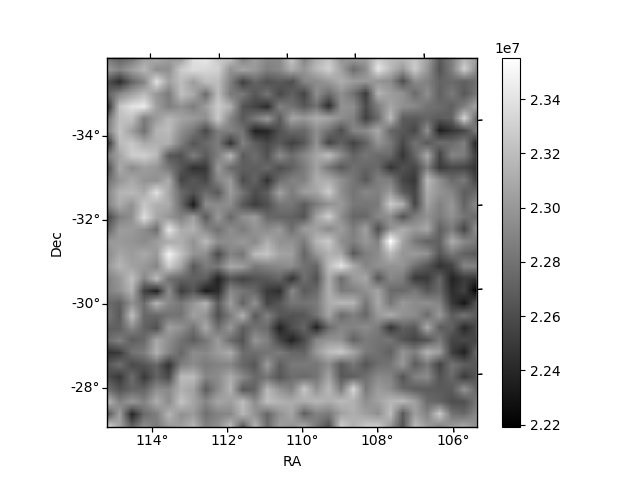
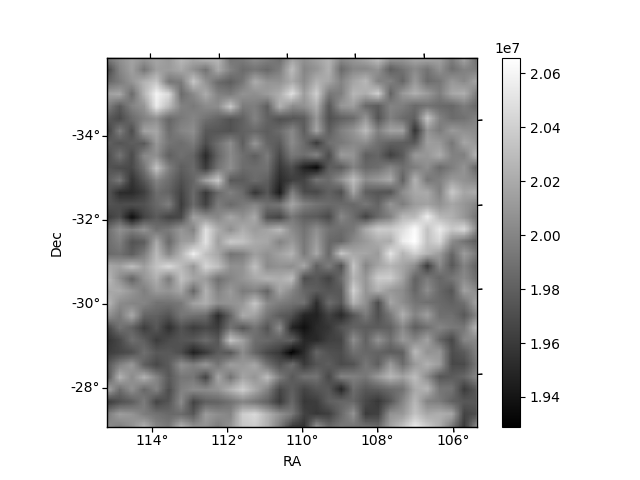
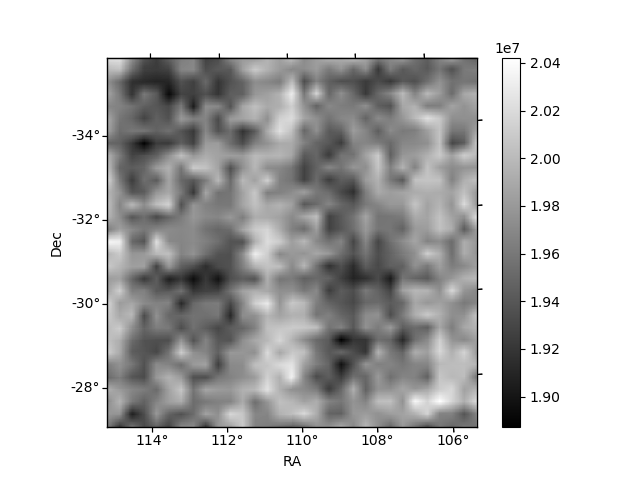
Histogram calculated using DETX and DETY for each event in the final _common_clean file
| Quadrant A | 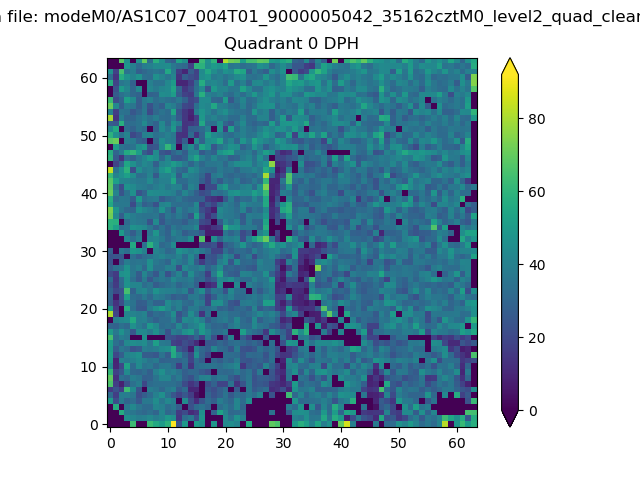 |
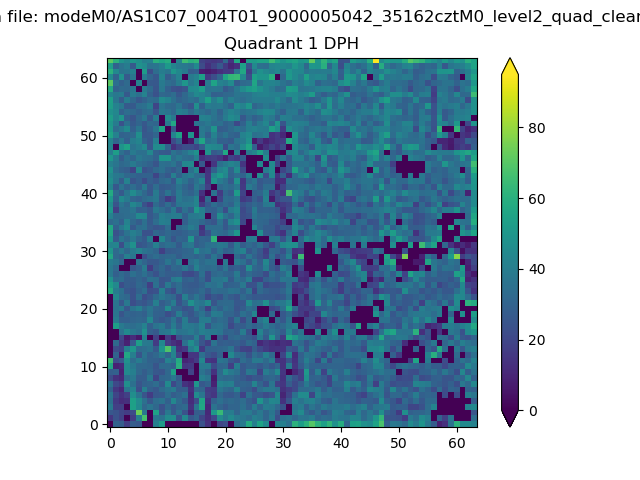 |
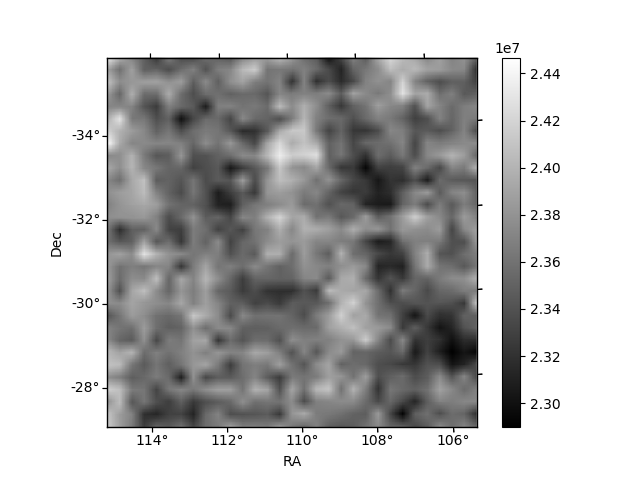
Quadrant B |
|---|---|---|---|
| Quadrant D | 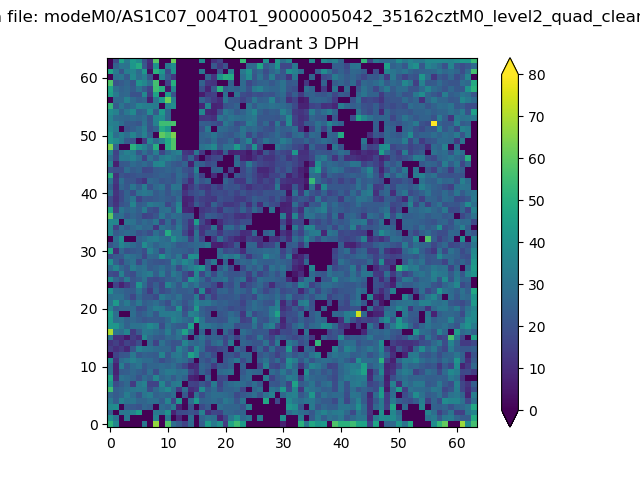 |
 |
Quadrant C |
| Plot type | Count rate plots | Images |
|---|---|---|
| Comparison with Poisson distribution Blue bars denote a histogram of data divided into 1 sec bins. Red curve is a Poisson curve with rate = median count rate of data. |
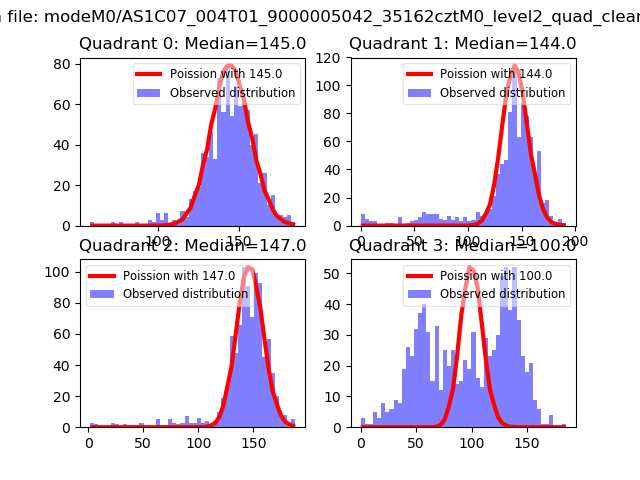 |
 |
| Quadrant-wise count rates Data is divided into 100 sec bins |
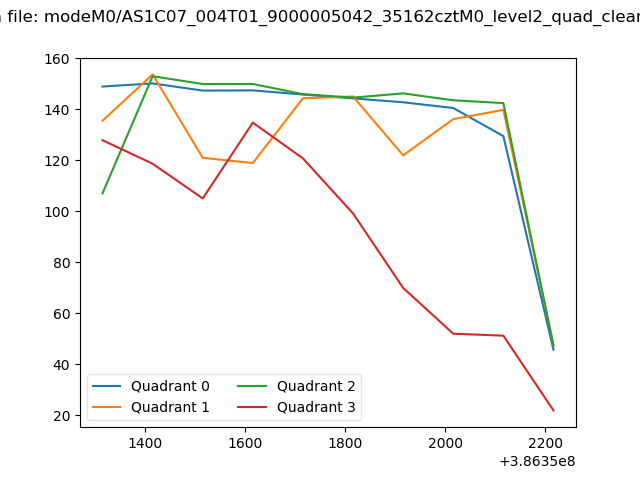 |
|
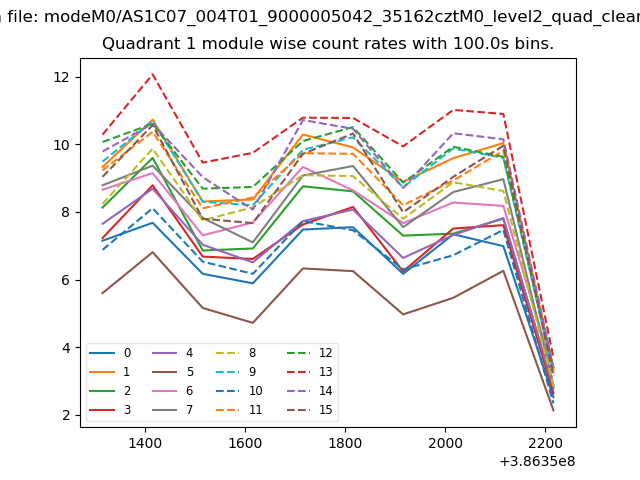
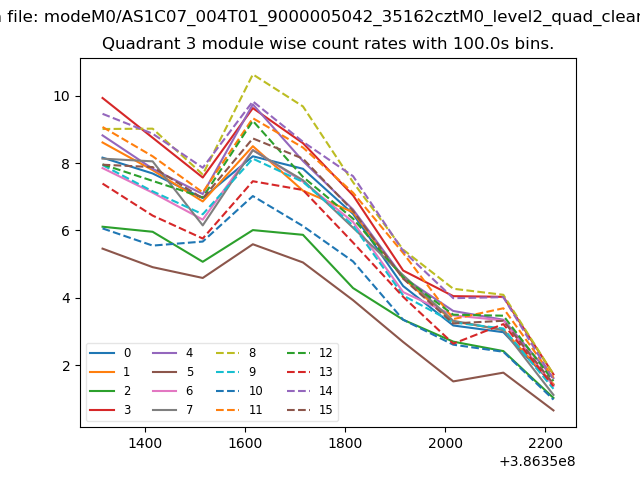
| Module-wise count rates for Quadrant A Data is divided into 100 sec bins |
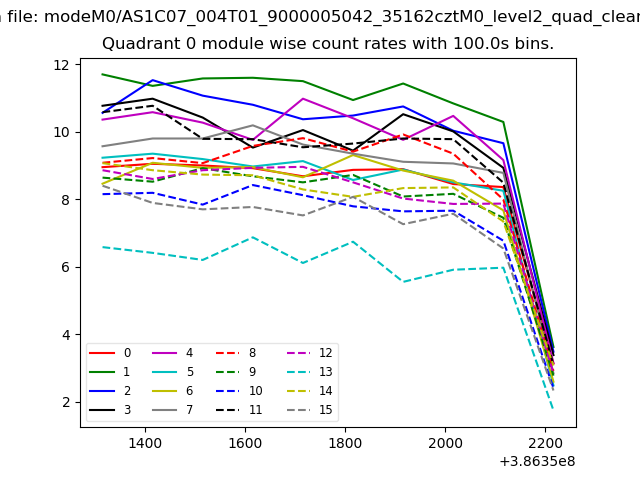 |
 |
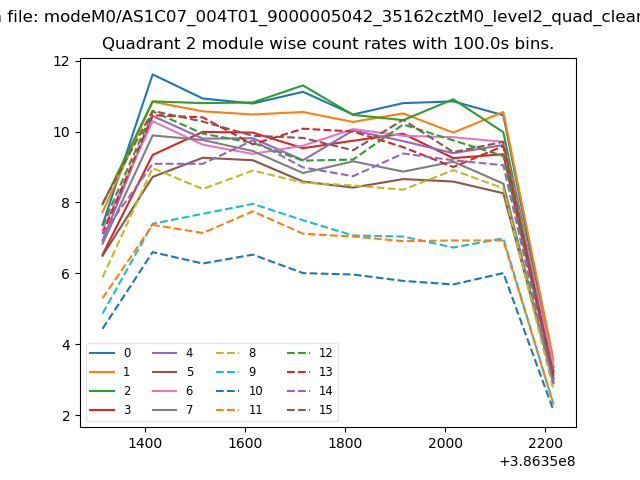
| Module-wise count rates for Quadrant B Data is divided into 100 sec bins |
 |
 |
| Module-wise count rates for Quadrant C Data is divided into 100 sec bins |
 |
 |
| Module-wise count rates for Quadrant D Data is divided into 100 sec bins |
 |
 |
| Parameter | Plot |
|---|---|
| CZT HV Monitor |  |
| D_VDD | 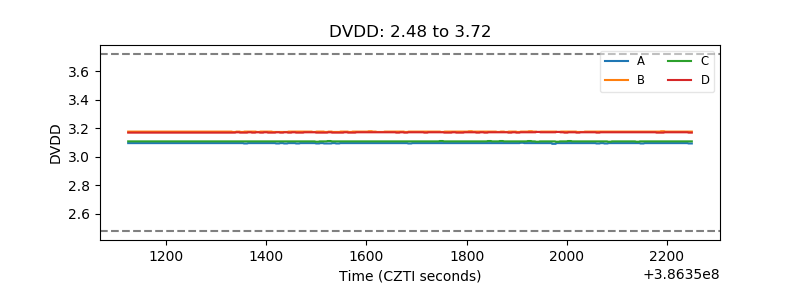 |
| Temperature 1 | 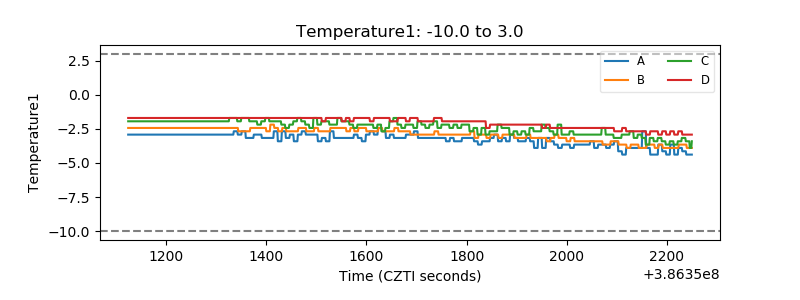 |
| Veto HV Monitor | 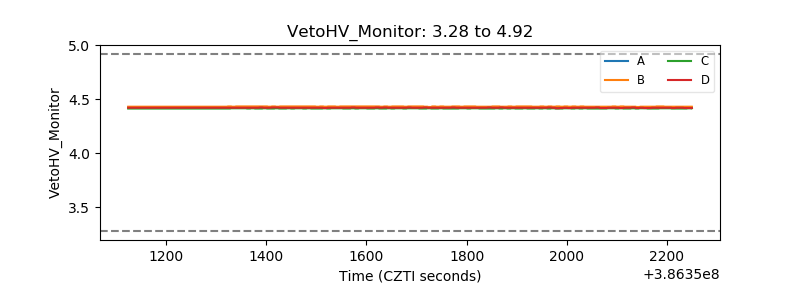 |
| Veto LLD | 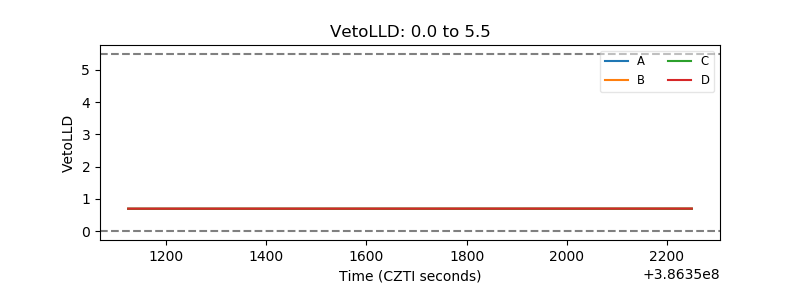 |
| Alpha Counter | 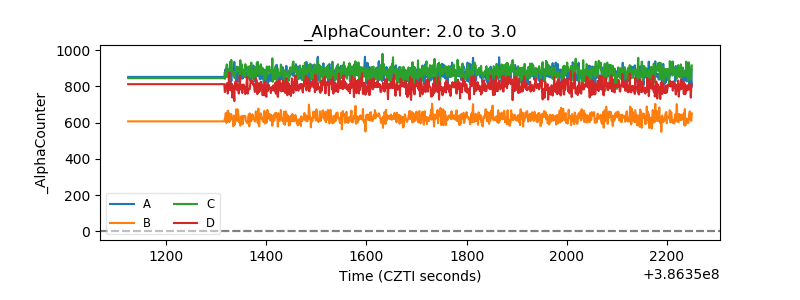 |
| _CPM_Rate | 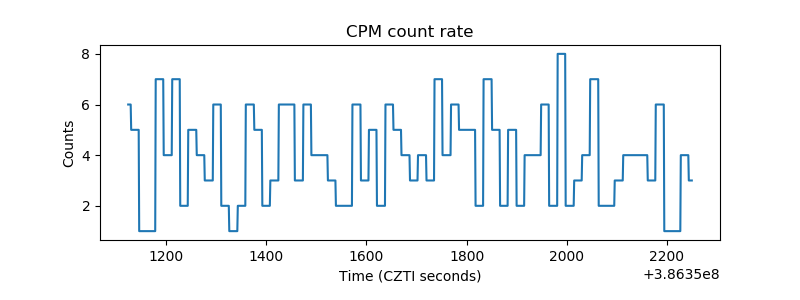 |
| CZT Counter | 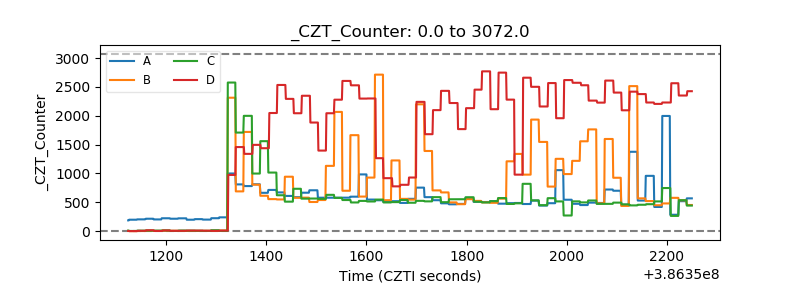 |
| +2.5 Volts monitor | 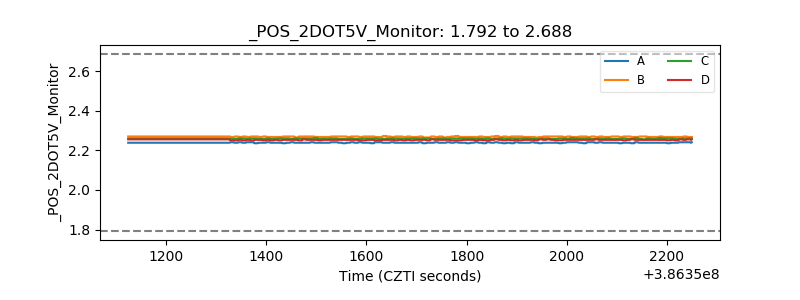 |
| +5 Volts monitor | 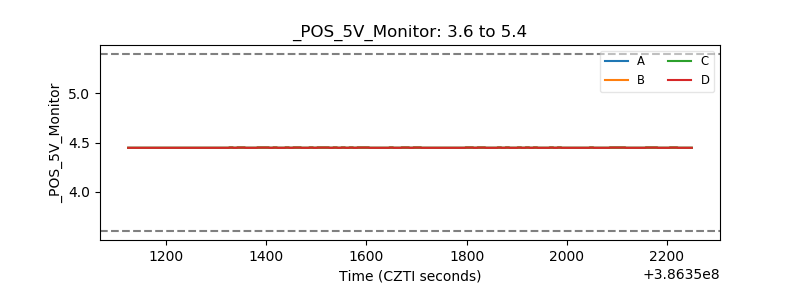 |
| _ROLL_ROT | 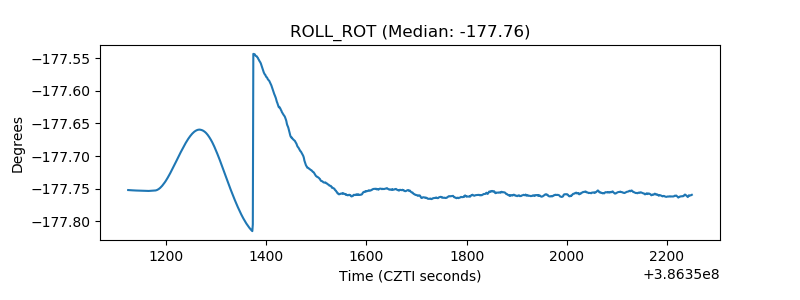 |
| _Roll_DEC | 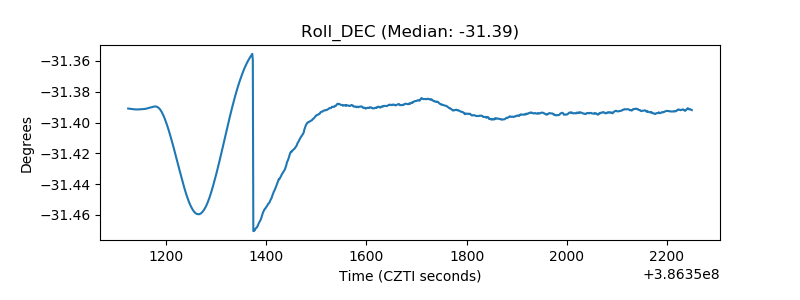 |
| _Roll_RA | 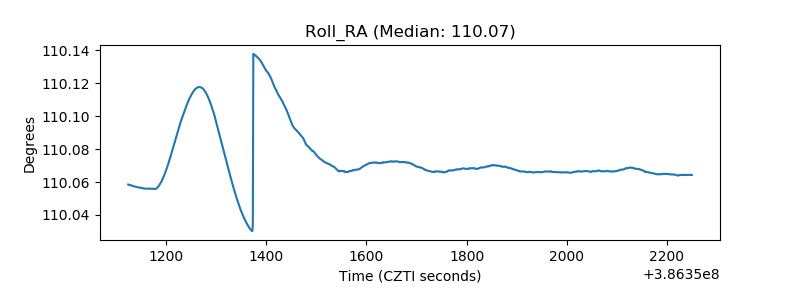 |
| Veto Counter | 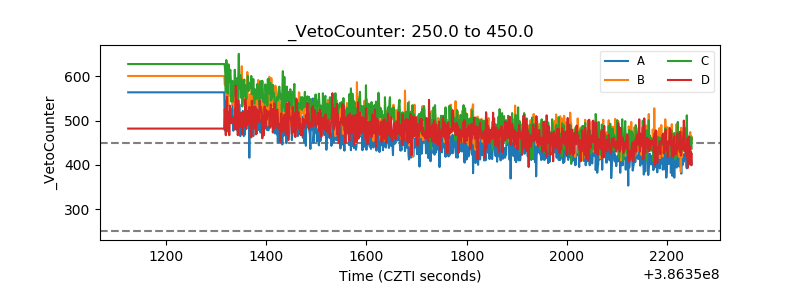 |