| Param | Original file | Final file |
|---|---|---|
| Filename | modeM0/AS1A11_069T05_9000005038_35155cztM0_level2.evt | modeM0/AS1A11_069T05_9000005038_35155cztM0_level2_quad_clean.evt |
| Size (bytes) | 395,032,320 | 45,066,240 |
| Size | 376.7 MB | 43.0 MB |
| Events in quadrant A | 1,938,042 | 293,697 |
| Events in quadrant B | 3,843,384 | 273,214 |
| Events in quadrant C | 2,090,015 | 289,982 |
| Events in quadrant D | 3,858,425 | 263,089 |
| Mode M9 | |||
|---|---|---|---|
| Quadrant | BADHDUFLAG | Total packets | Discarded packets |
| A | 0 | 16 | 0 |
| B | 0 | 16 | 0 |
| C | 0 | 16 | 0 |
| D | 0 | 16 | 0 |
| Mode SS | |||
|---|---|---|---|
| Quadrant | BADHDUFLAG | Total packets | Discarded packets |
| A | 0 | 70 | 0 |
| B | 0 | 70 | 0 |
| C | 0 | 70 | 0 |
| D | 0 | 70 | 0 |
| Mode M0 | |||
|---|---|---|---|
| Quadrant | BADHDUFLAG | Total packets | Discarded packets |
| A | 0 | 7821 | 2 |
| B | 0 | 13806 | 1 |
| C | 0 | 8136 | 1 |
| D | 0 | 13893 | 1 |
| Quadrant | Total seconds | Saturated seconds | Saturation percentage |
|---|---|---|---|
| A | 3446 | 52 | 1.508996% |
| B | 3446 | 681 | 19.762043% |
| C | 3446 | 49 | 1.421938% |
| D | 3446 | 299 | 8.676727% |
Noise dominated data is calculated using 1-second bins in cleaned event files. If a bin has >2000 counts, and if more than 50% of those come from <1% of pixels, then it is considered to be noise-dominated and hence unusable.
| Quadrant | # 1 sec bins | Bins with >0 counts | Bins with >2000 counts | High rate bins dominated by noise | Noise dominated (total time) | Noise dominated (detector-on time) | Marked lightcurve |
|---|---|---|---|---|---|---|---|
| A | 5029 | 3447 | 28 | 28 | 0.56% | 0.81% | 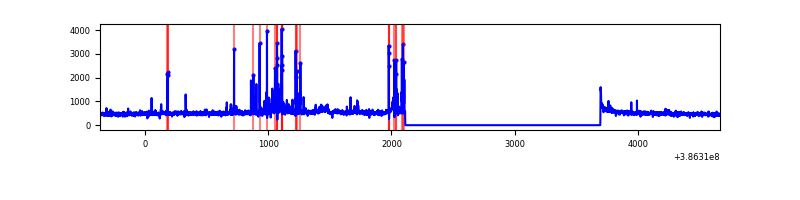 |
| B | 5029 | 3447 | 406 | 406 | 8.07% | 11.78% | 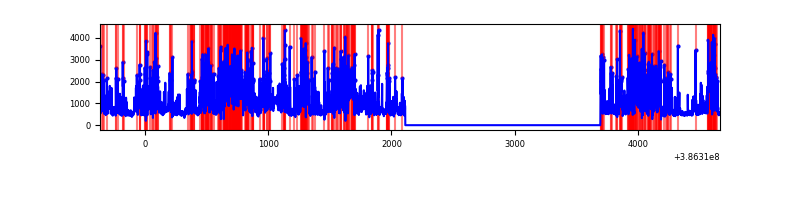 |
| C | 5029 | 3447 | 37 | 37 | 0.74% | 1.07% | 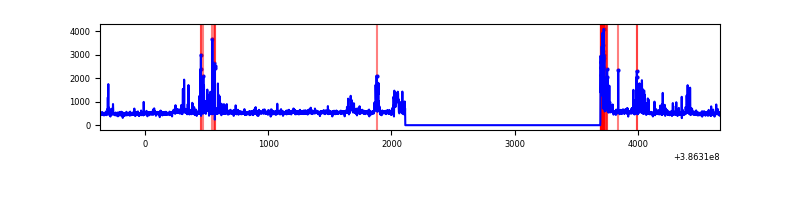 |
| D | 5029 | 3447 | 235 | 235 | 4.67% | 6.82% | 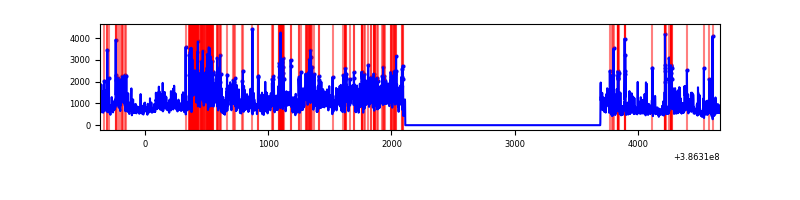 |
Top three noisy pixels from each quadrant. If the there are fewer than three noisy pixels in the level2.evt file, extra rows are filled as -1
| Pixel properties | Quadrant properties | ||||||
|---|---|---|---|---|---|---|---|
| Quadrant | DetID | PixID | Counts | Sigma | Mean | Median | Sigma |
| A | 15 | 237 | 156459 | 1795.53 | 422 | 415 | 86.9 |
| A | 10 | 83 | 56443 | 644.69 | 422 | 415 | 86.9 |
| A | 9 | 143 | 40006 | 455.56 | 422 | 415 | 86.9 |
| B | 5 | 236 | 2016882 | 26276.24 | 391 | 381 | 76.7 |
| B | 5 | 172 | 177755 | 2311.29 | 391 | 381 | 76.7 |
| B | 5 | 200 | 42387 | 547.36 | 391 | 381 | 76.7 |
| C | 15 | 214 | 147431 | 1534.14 | 408 | 411 | 95.8 |
| C | 0 | 10 | 100708 | 1046.59 | 408 | 411 | 95.8 |
| C | 0 | 207 | 97829 | 1016.55 | 408 | 411 | 95.8 |
| D | 8 | 195 | 1413494 | 13984.48 | 403 | 391 | 101.0 |
| D | 12 | 233 | 239674 | 2368.02 | 403 | 391 | 101.0 |
| D | 2 | 250 | 165895 | 1637.88 | 403 | 391 | 101.0 |
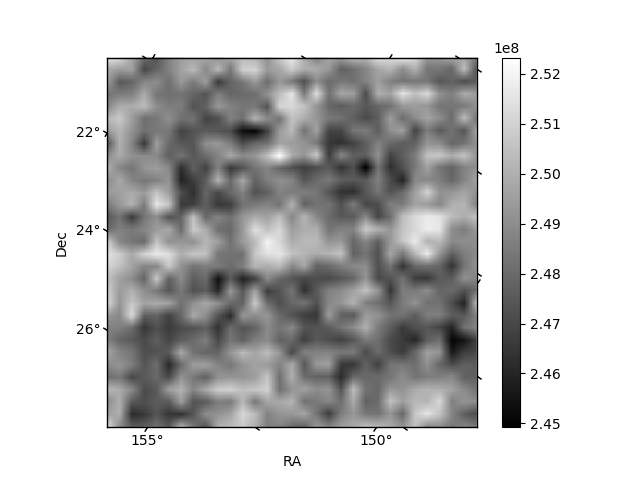
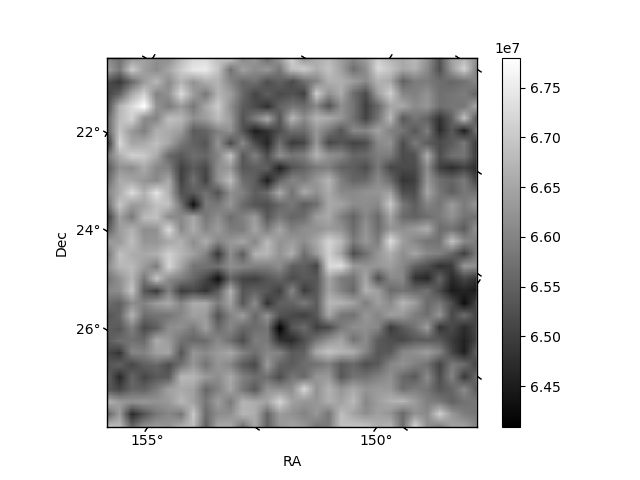
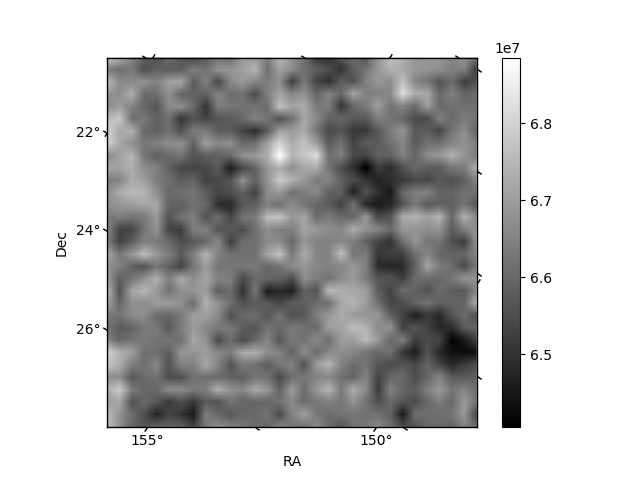
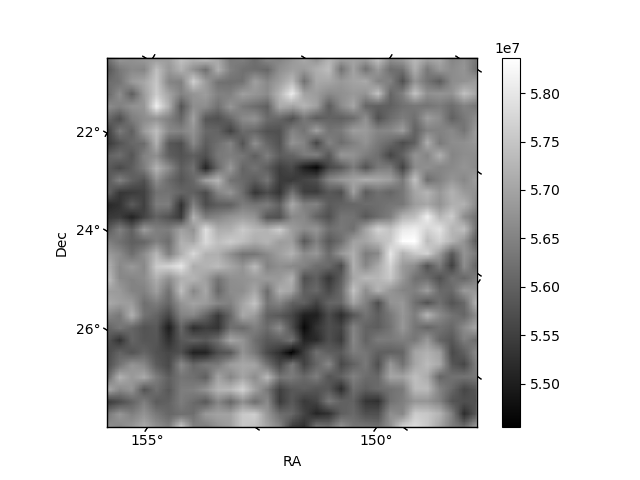
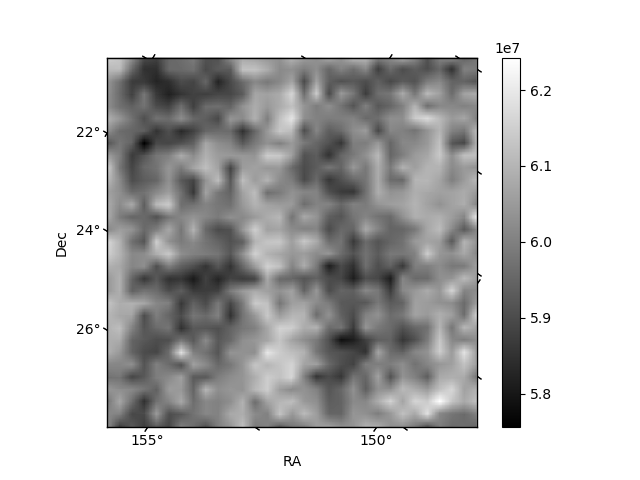
Histogram calculated using DETX and DETY for each event in the final _common_clean file
| Quadrant A | 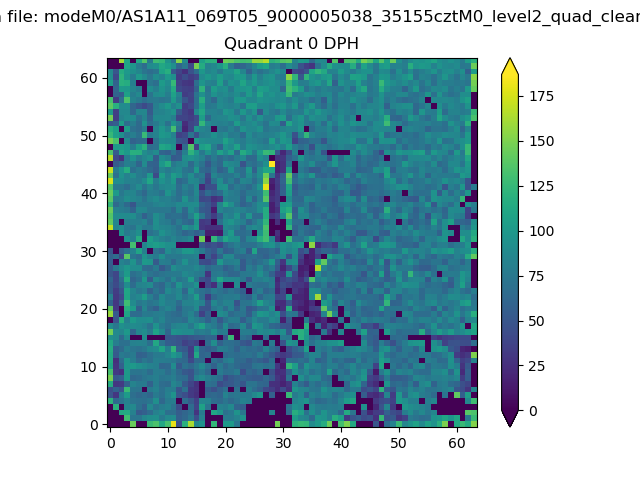 |
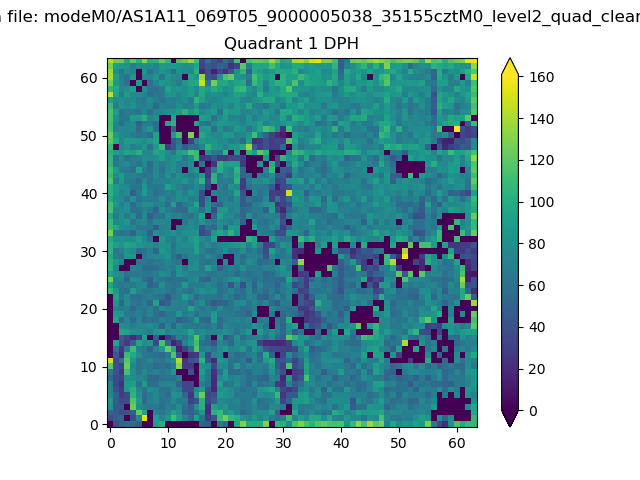 |
Quadrant B |
|---|---|---|---|
| Quadrant D | 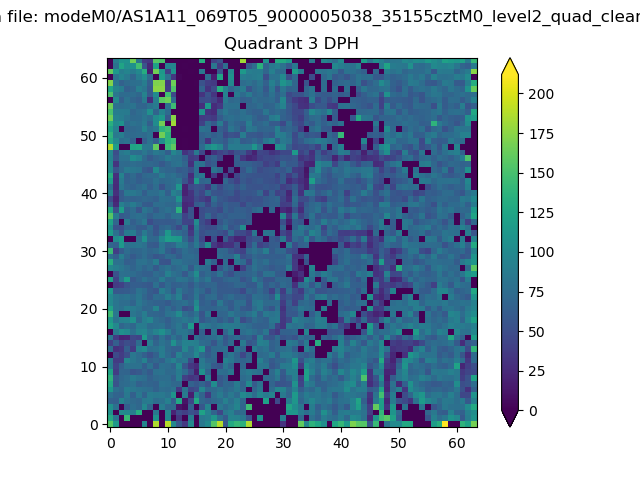 |
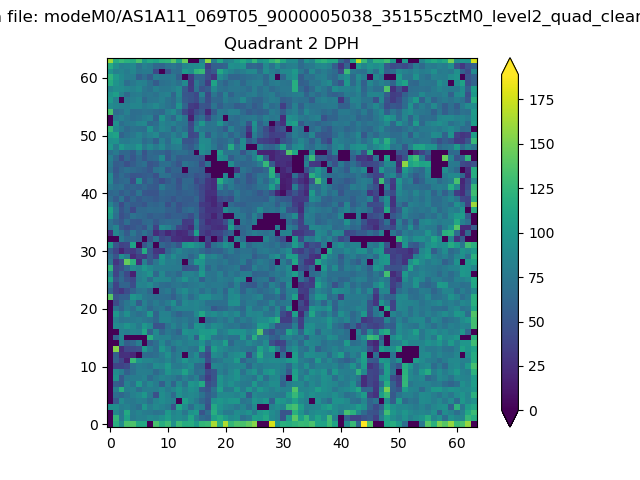 |
Quadrant C |
| Plot type | Count rate plots | Images |
|---|---|---|
| Comparison with Poisson distribution Blue bars denote a histogram of data divided into 1 sec bins. Red curve is a Poisson curve with rate = median count rate of data. |
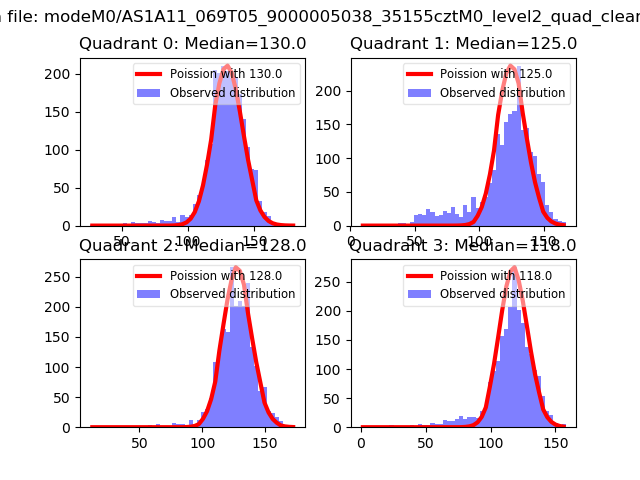 |
 |
| Quadrant-wise count rates Data is divided into 100 sec bins |
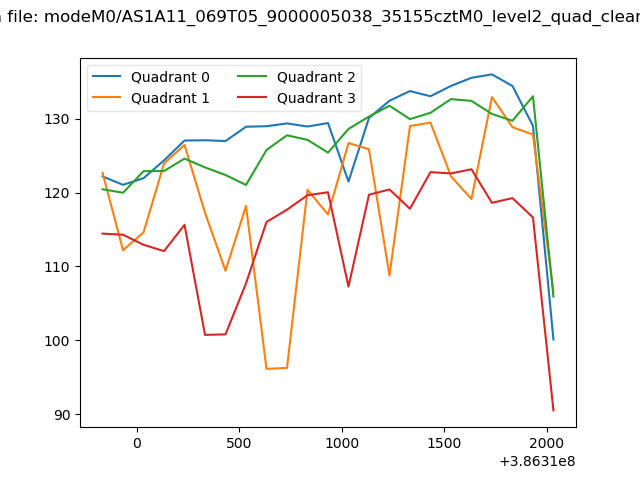 |
|
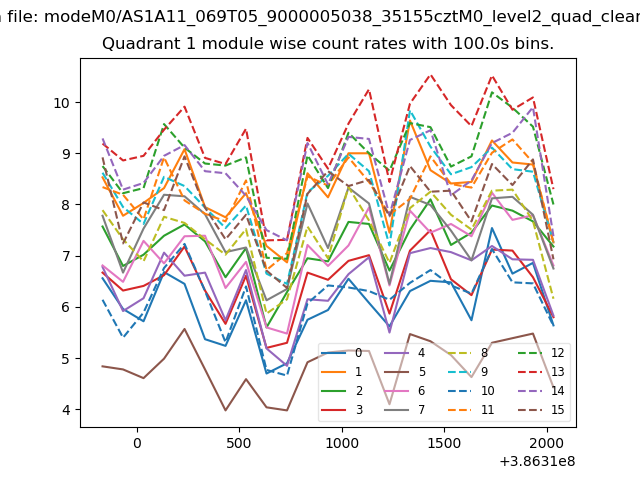
| Module-wise count rates for Quadrant A Data is divided into 100 sec bins |
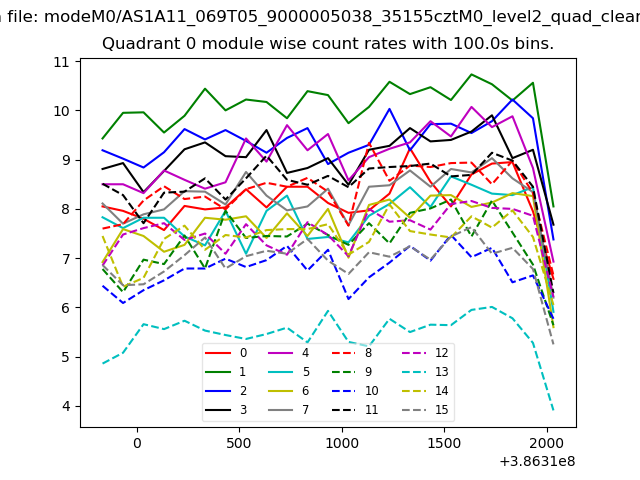 |
 |
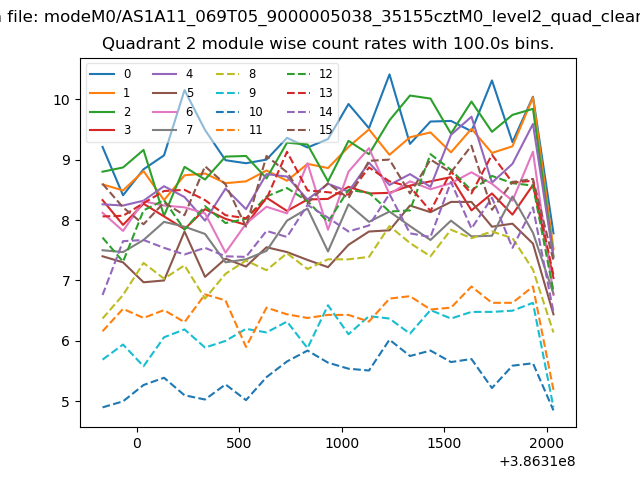
| Module-wise count rates for Quadrant B Data is divided into 100 sec bins |
 |
 |
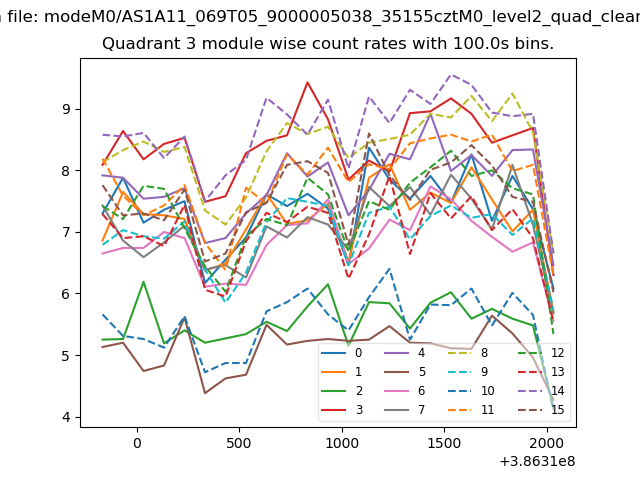
| Module-wise count rates for Quadrant C Data is divided into 100 sec bins |
 |
 |
| Module-wise count rates for Quadrant D Data is divided into 100 sec bins |
 |
 |
| Parameter | Plot |
|---|---|
| CZT HV Monitor | 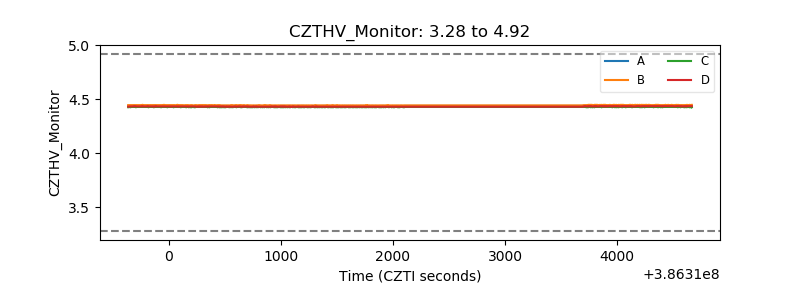 |
| D_VDD | 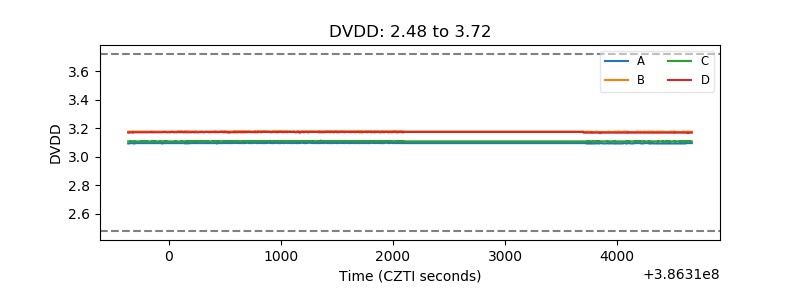 |
| Temperature 1 | 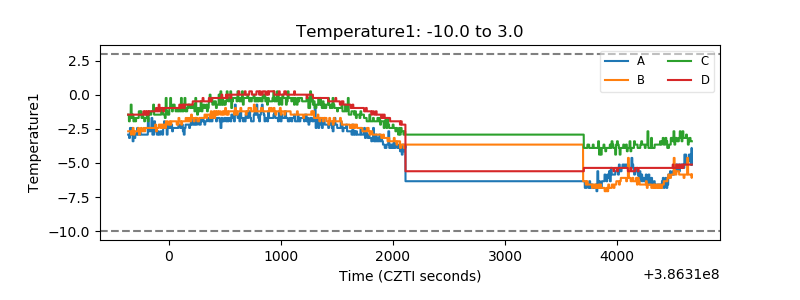 |
| Veto HV Monitor | 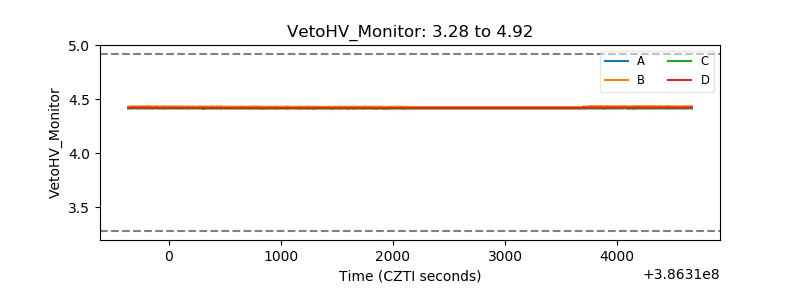 |
| Veto LLD | 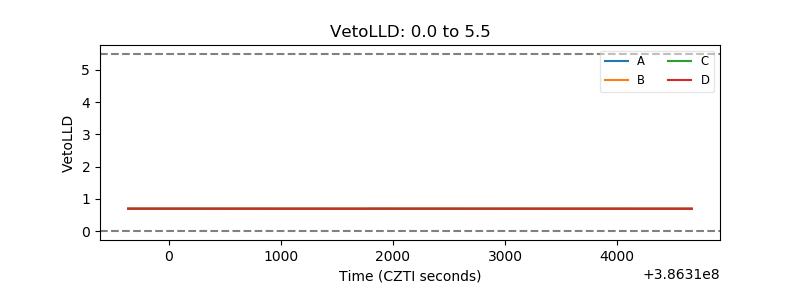 |
| Alpha Counter | 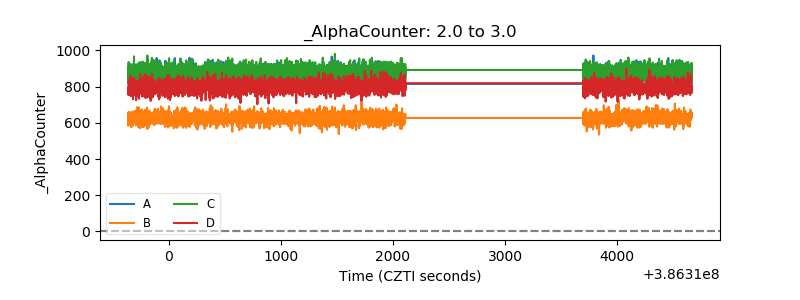 |
| _CPM_Rate | 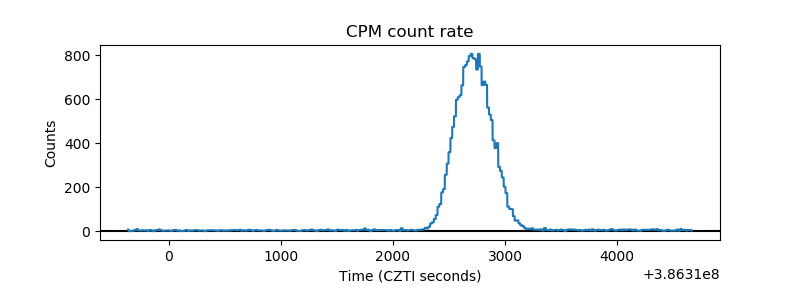 |
| CZT Counter | 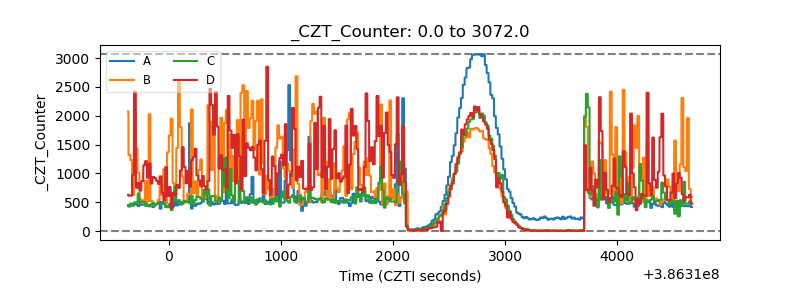 |
| +2.5 Volts monitor | 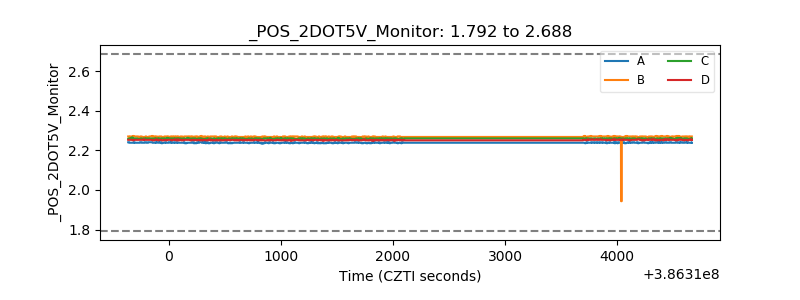 |
| +5 Volts monitor | 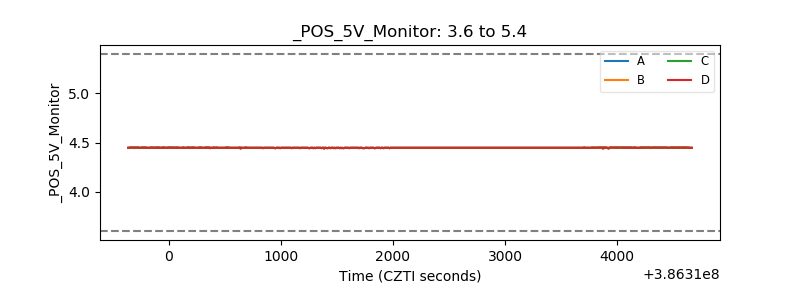 |
| _ROLL_ROT | 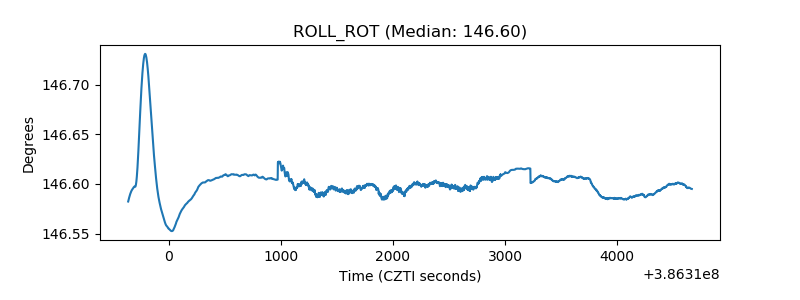 |
| _Roll_DEC | 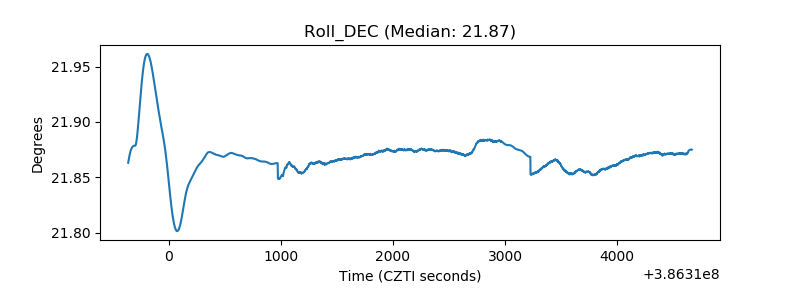 |
| _Roll_RA | 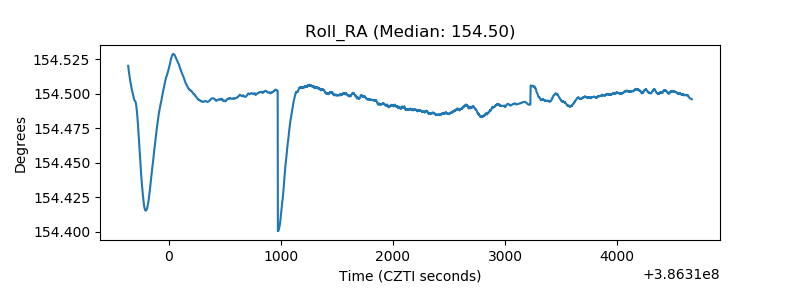 |
| Veto Counter | 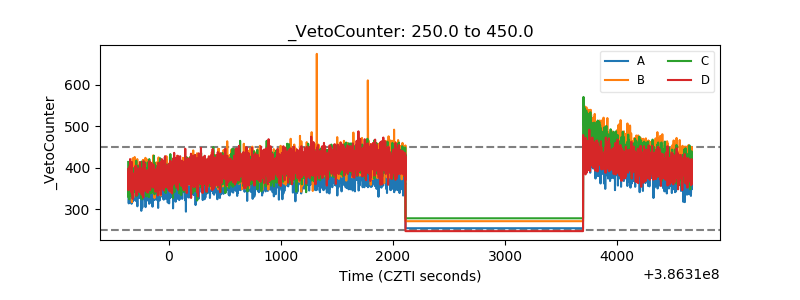 |