| Param | Original file | Final file |
|---|---|---|
| Filename | modeM0/AS1A11_069T05_9000005038cztM0_level2_bc.evt | modeM0/AS1A11_069T05_9000005038cztM0_level2_quad_clean.evt |
| Size (bytes) | 1,642,671,360 | 357,641,280 |
| Size | 1.5 GB | 341.1 MB |
| Events in quadrant A | 5,920,018 | 2,488,845 |
| Events in quadrant B | 13,637,616 | 2,256,691 |
| Events in quadrant C | 7,577,143 | 2,400,857 |
| Events in quadrant D | 21,036,333 | 2,088,432 |
| Mode M9 | |||
|---|---|---|---|
| Quadrant | BADHDUFLAG | Total packets | Discarded packets |
| A | 0 | 92 | 0 |
| B | 0 | 92 | 0 |
| C | 0 | 92 | 0 |
| D | 0 | 92 | 0 |
| Mode SS | |||
|---|---|---|---|
| Quadrant | BADHDUFLAG | Total packets | Discarded packets |
| A | 0 | 472 | 0 |
| B | 0 | 472 | 0 |
| C | 0 | 472 | 0 |
| D | 0 | 472 | 0 |
| Mode M0 | |||
|---|---|---|---|
| Quadrant | BADHDUFLAG | Total packets | Discarded packets |
| A | 0 | 50382 | 0 |
| B | 0 | 89564 | 0 |
| C | 0 | 54937 | 0 |
| D | 0 | 102666 | 0 |
| Quadrant | Total seconds | Saturated seconds | Saturation percentage |
|---|---|---|---|
| A | 23193 | 110 | 0.474281% |
| B | 23193 | 4272 | 18.419351% |
| C | 23193 | 361 | 1.556504% |
| D | 23193 | 3549 | 15.302031% |
Noise dominated data is calculated using 1-second bins in cleaned event files. If a bin has >2000 counts, and if more than 50% of those come from <1% of pixels, then it is considered to be noise-dominated and hence unusable.
| Quadrant | # 1 sec bins | Bins with >0 counts | Bins with >2000 counts | High rate bins dominated by noise | Noise dominated (total time) | Noise dominated (detector-on time) | Marked lightcurve |
|---|---|---|---|---|---|---|---|
| A | 32339 | 23197 | 7 | 7 | 0.02% | 0.03% | 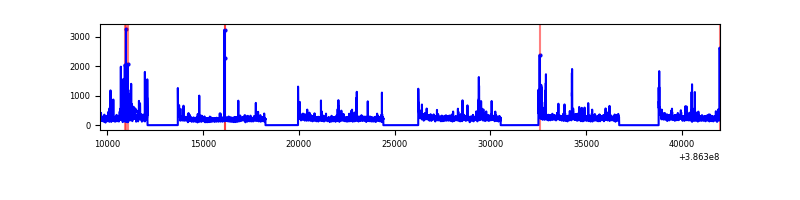 |
| B | 32339 | 23193 | 274 | 274 | 0.85% | 1.18% | 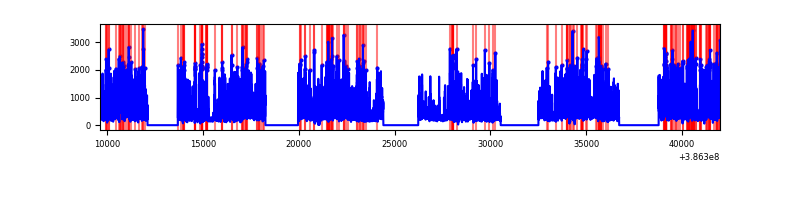 |
| C | 32339 | 23193 | 37 | 37 | 0.11% | 0.16% | 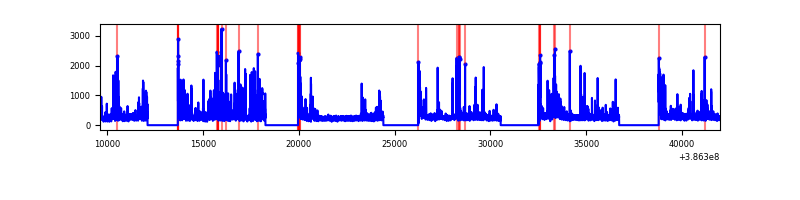 |
| D | 32339 | 23192 | 1330 | 1330 | 4.11% | 5.73% | 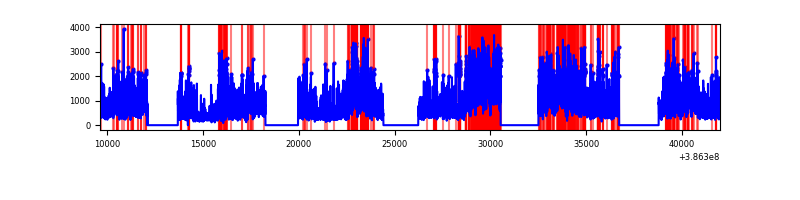 |
Top three noisy pixels from each quadrant. If the there are fewer than three noisy pixels in the level2.evt file, extra rows are filled as -1
| Pixel properties | Quadrant properties | ||||||
|---|---|---|---|---|---|---|---|
| Quadrant | DetID | PixID | Counts | Sigma | Mean | Median | Sigma |
| A | 10 | 83 | 290875 | 993.83 | 1351 | 1334 | 291.3 |
| A | 9 | 143 | 170830 | 581.78 | 1351 | 1334 | 291.3 |
| A | 15 | 237 | 114453 | 388.27 | 1351 | 1334 | 291.3 |
| B | 5 | 236 | 7307852 | 30566.86 | 1235 | 1215 | 239.0 |
| B | 5 | 172 | 958831 | 4006.13 | 1235 | 1215 | 239.0 |
| B | 0 | 182 | 207981 | 864.99 | 1235 | 1215 | 239.0 |
| C | 15 | 214 | 918501 | 3197.04 | 1278 | 1273 | 286.9 |
| C | 0 | 207 | 804846 | 2800.89 | 1278 | 1273 | 286.9 |
| C | 0 | 10 | 490049 | 1703.65 | 1278 | 1273 | 286.9 |
| D | 8 | 195 | 7664355 | 26733.58 | 1227 | 1194 | 286.6 |
| D | 7 | 80 | 5355210 | 18677.93 | 1227 | 1194 | 286.6 |
| D | 2 | 250 | 726822 | 2531.41 | 1227 | 1194 | 286.6 |
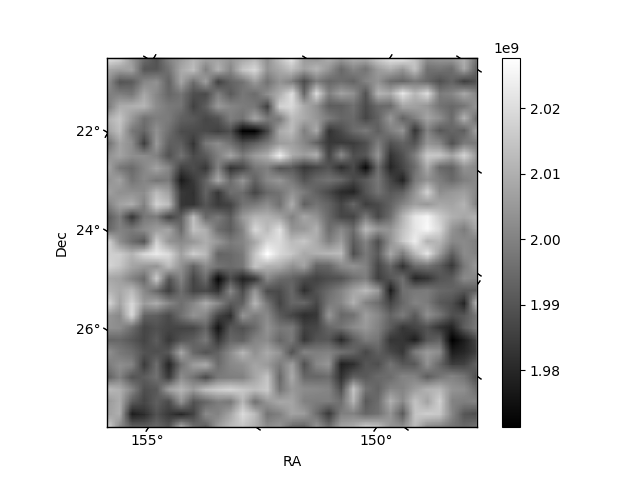
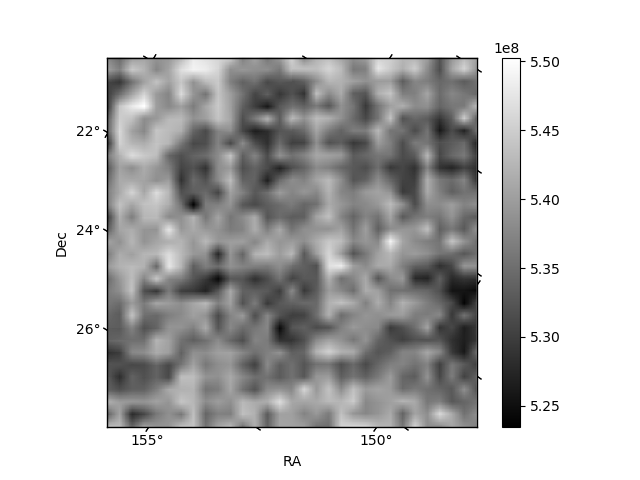
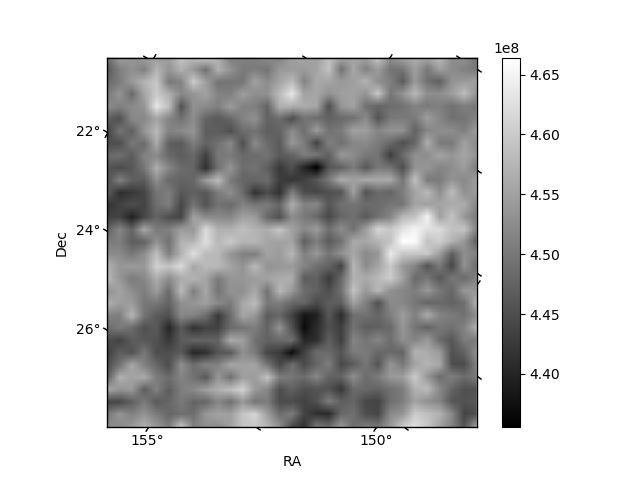
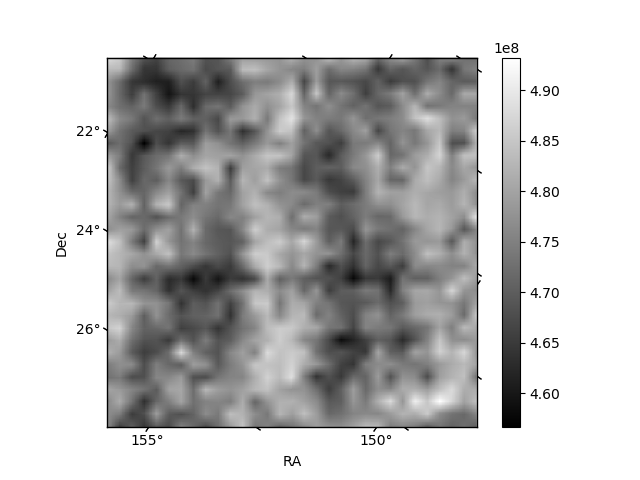
Histogram calculated using DETX and DETY for each event in the final _common_clean file
| Quadrant A | 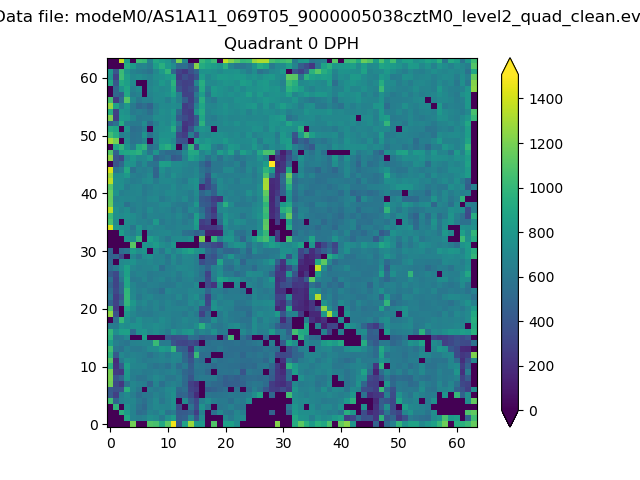 |
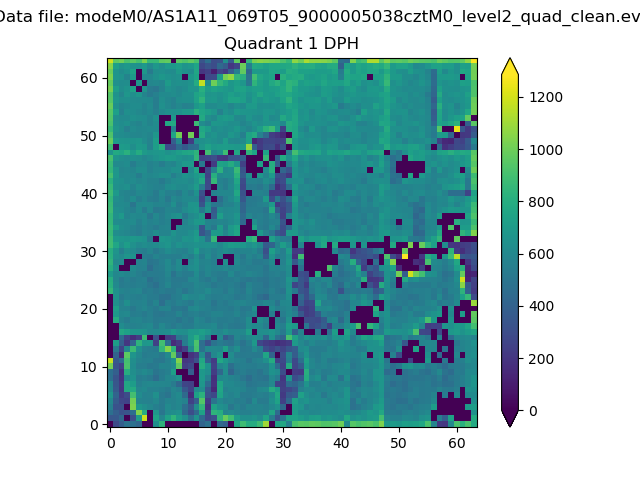 |
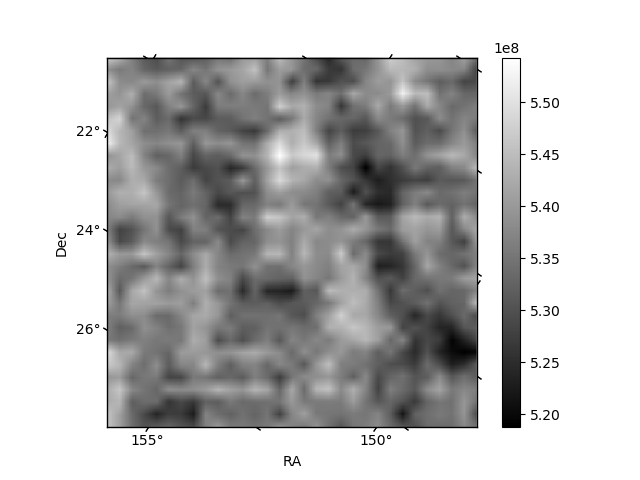
Quadrant B |
|---|---|---|---|
| Quadrant D | 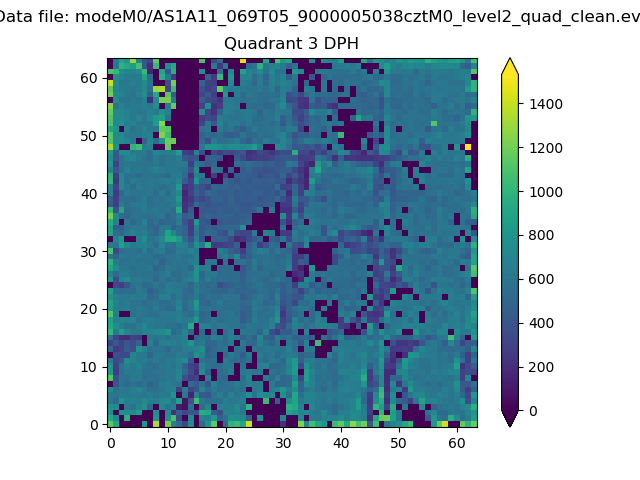 |
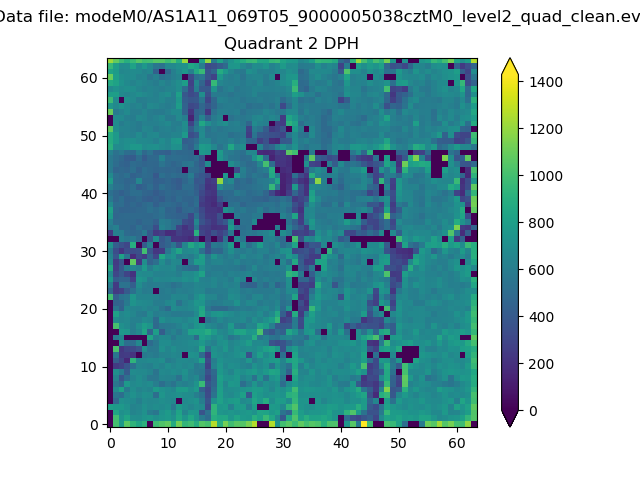 |
Quadrant C |
| Plot type | Count rate plots | Images |
|---|---|---|
| Comparison with Poisson distribution Blue bars denote a histogram of data divided into 1 sec bins. Red curve is a Poisson curve with rate = median count rate of data. |
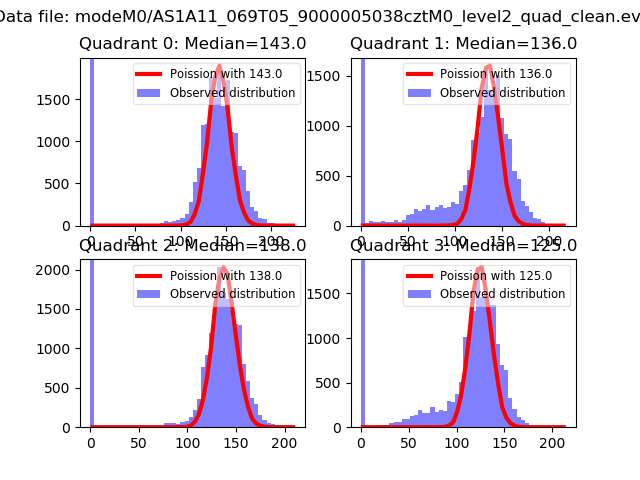 |
 |
| Quadrant-wise count rates Data is divided into 100 sec bins |
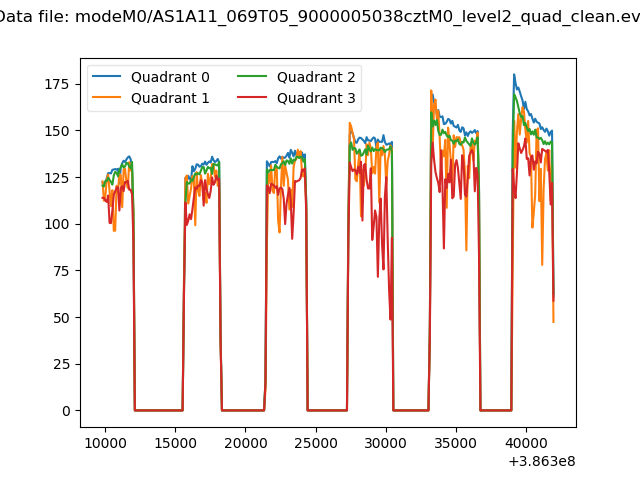 |
|
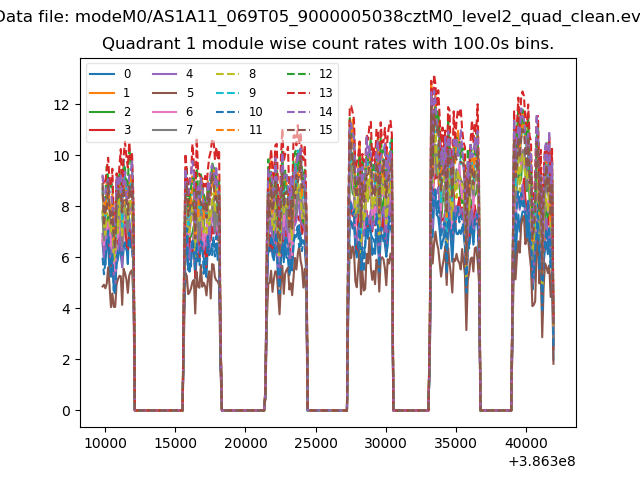
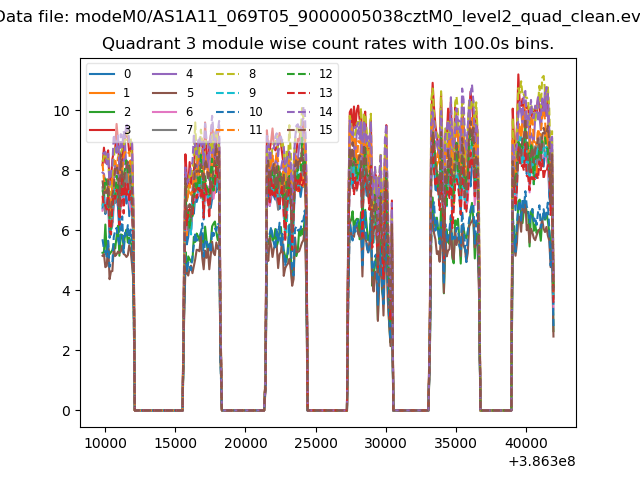
| Module-wise count rates for Quadrant A Data is divided into 100 sec bins |
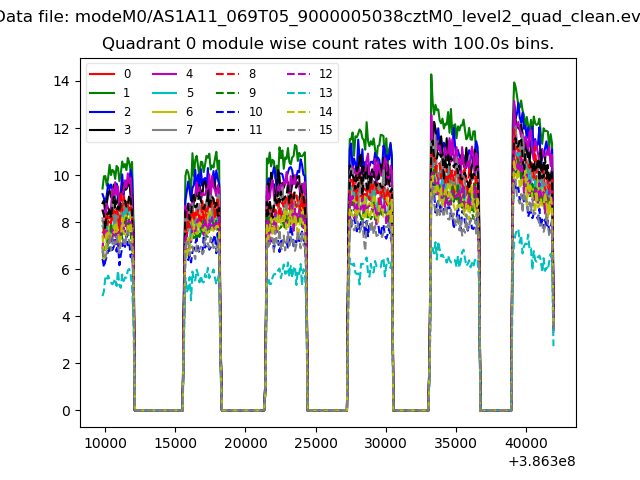 |
 |
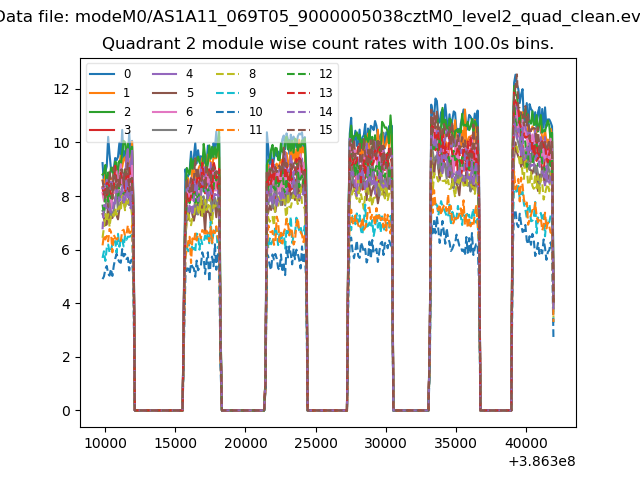
| Module-wise count rates for Quadrant B Data is divided into 100 sec bins |
 |
 |
| Module-wise count rates for Quadrant C Data is divided into 100 sec bins |
 |
 |
| Module-wise count rates for Quadrant D Data is divided into 100 sec bins |
 |
 |
| Parameter | Plot |
|---|---|
| CZT HV Monitor | 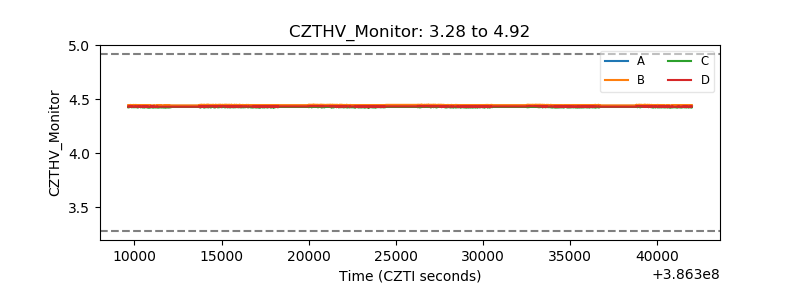 |
| D_VDD | 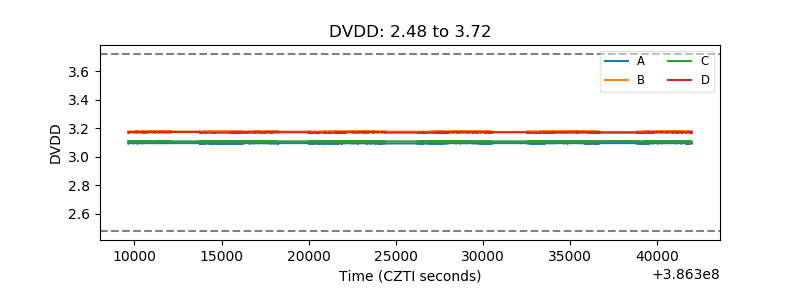 |
| Temperature 1 | 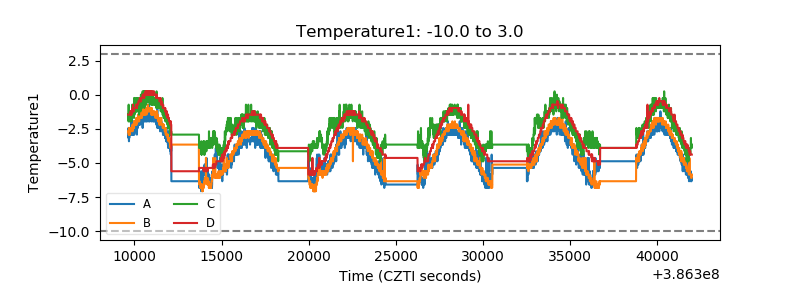 |
| Veto HV Monitor | 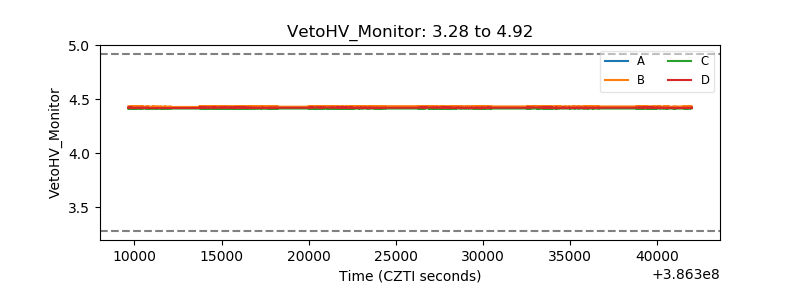 |
| Veto LLD | 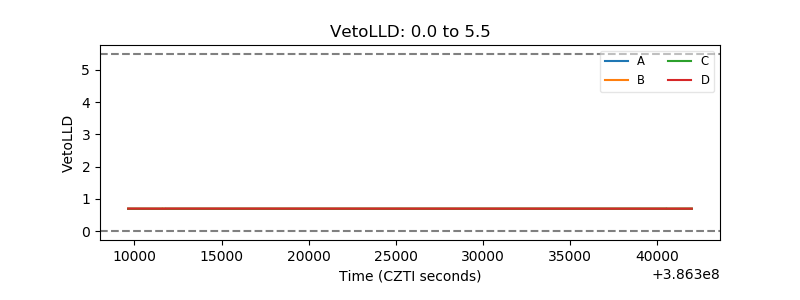 |
| Alpha Counter | 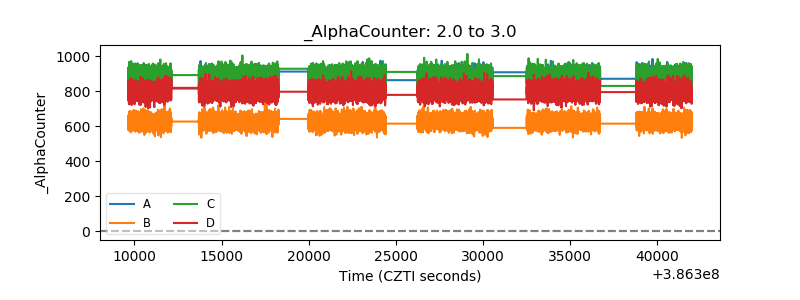 |
| _CPM_Rate | 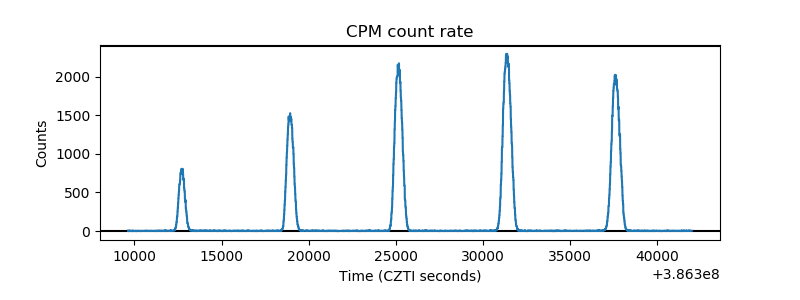 |
| CZT Counter | 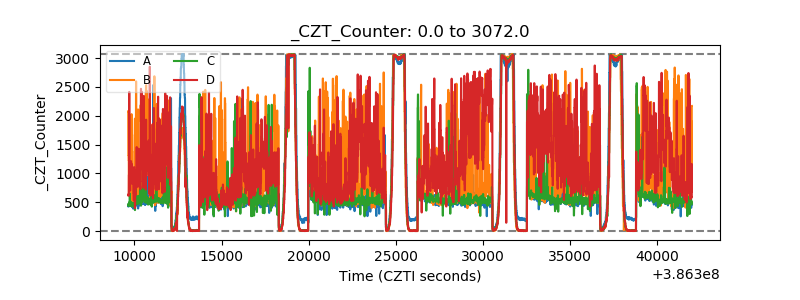 |
| +2.5 Volts monitor | 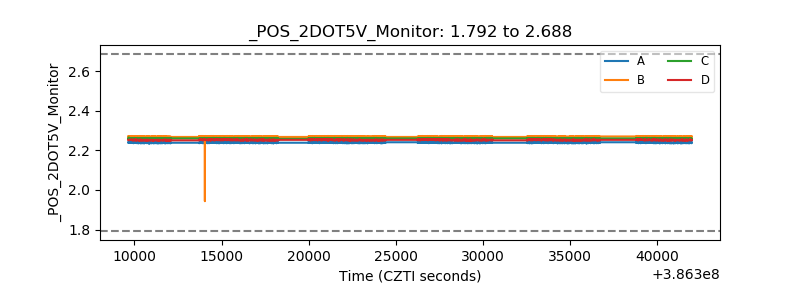 |
| +5 Volts monitor | 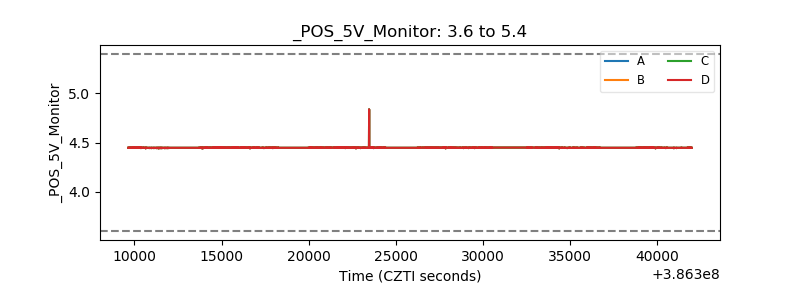 |
| _ROLL_ROT | 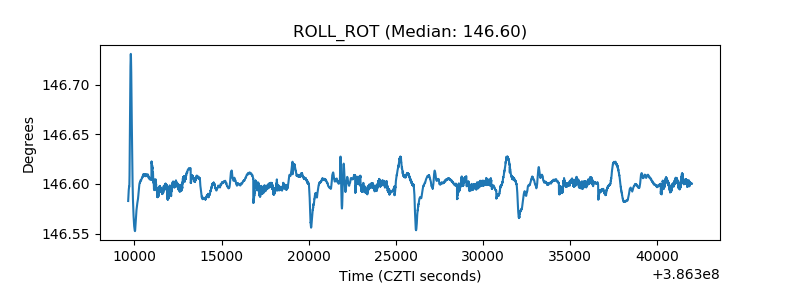 |
| _Roll_DEC | 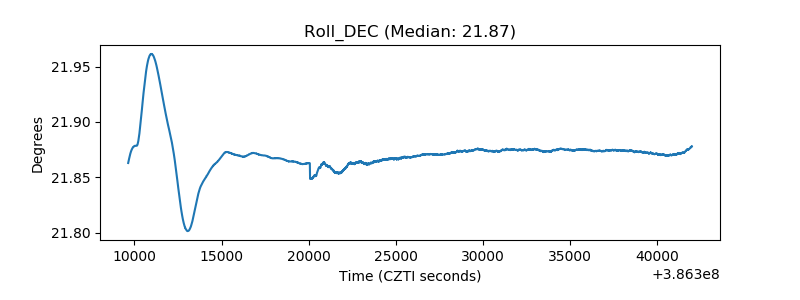 |
| _Roll_RA | 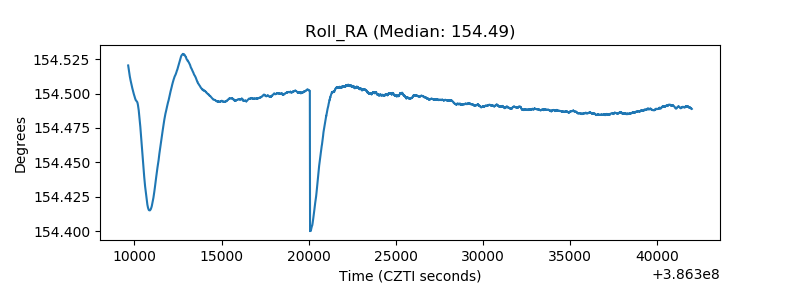 |
| Veto Counter | 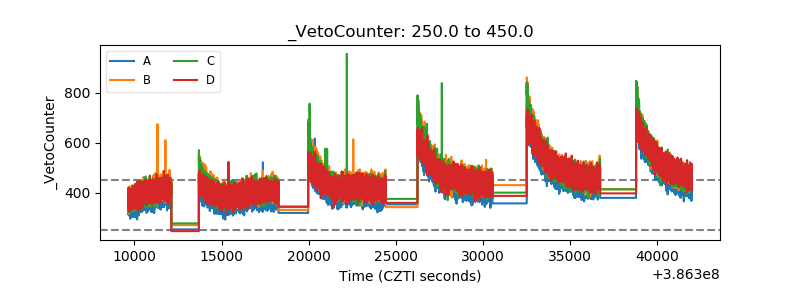 |