| Param | Original file | Final file |
|---|---|---|
| Filename | modeM0/AS1A11_037T01_9000005030_35145cztM0_level2.evt | modeM0/AS1A11_037T01_9000005030_35145cztM0_level2_quad_clean.evt |
| Size (bytes) | 358,004,160 | 76,838,400 |
| Size | 341.4 MB | 73.3 MB |
| Events in quadrant A | 1,951,897 | 537,261 |
| Events in quadrant B | 2,615,460 | 528,848 |
| Events in quadrant C | 2,003,009 | 526,814 |
| Events in quadrant D | 4,033,564 | 485,502 |
| Mode M0 | |||
|---|---|---|---|
| Quadrant | BADHDUFLAG | Total packets | Discarded packets |
| A | 0 | 7893 | 0 |
| B | 0 | 10048 | 0 |
| C | 0 | 8144 | 0 |
| D | 0 | 14510 | 0 |
| Mode SS | |||
|---|---|---|---|
| Quadrant | BADHDUFLAG | Total packets | Discarded packets |
| A | 0 | 70 | 0 |
| B | 0 | 70 | 0 |
| C | 0 | 70 | 0 |
| D | 0 | 70 | 0 |
| Quadrant | Total seconds | Saturated seconds | Saturation percentage |
|---|---|---|---|
| A | 3507 | 15 | 0.427716% |
| B | 3507 | 168 | 4.790419% |
| C | 3507 | 9 | 0.256630% |
| D | 3507 | 185 | 5.275164% |
Noise dominated data is calculated using 1-second bins in cleaned event files. If a bin has >2000 counts, and if more than 50% of those come from <1% of pixels, then it is considered to be noise-dominated and hence unusable.
| Quadrant | # 1 sec bins | Bins with >0 counts | Bins with >2000 counts | High rate bins dominated by noise | Noise dominated (total time) | Noise dominated (detector-on time) | Marked lightcurve |
|---|---|---|---|---|---|---|---|
| A | 3507 | 3507 | 5 | 5 | 0.14% | 0.14% | 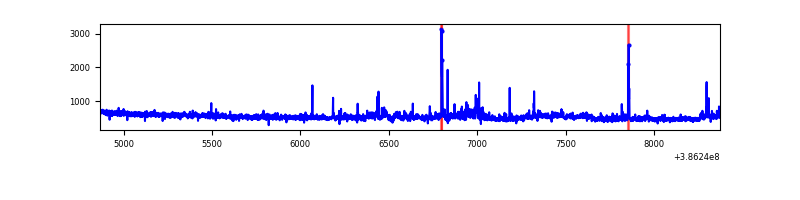 |
| B | 3507 | 3507 | 116 | 116 | 3.31% | 3.31% | 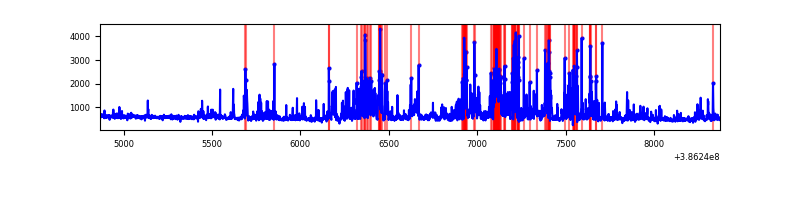 |
| C | 3507 | 3507 | 9 | 9 | 0.26% | 0.26% | 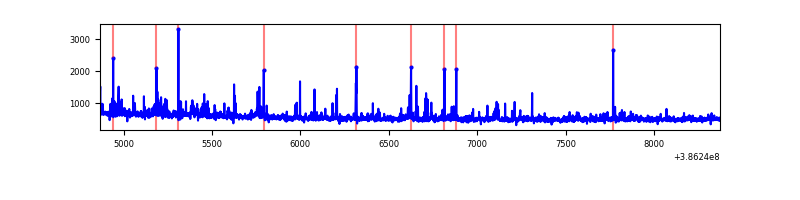 |
| D | 3507 | 3507 | 209 | 209 | 5.96% | 5.96% | 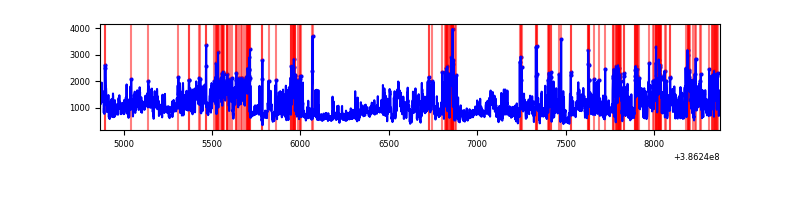 |
Top three noisy pixels from each quadrant. If the there are fewer than three noisy pixels in the level2.evt file, extra rows are filled as -1
| Pixel properties | Quadrant properties | ||||||
|---|---|---|---|---|---|---|---|
| Quadrant | DetID | PixID | Counts | Sigma | Mean | Median | Sigma |
| A | 15 | 169 | 176110 | 1971.88 | 449 | 442 | 89.1 |
| A | 10 | 83 | 30739 | 340.08 | 449 | 442 | 89.1 |
| A | 13 | 6 | 10460 | 112.45 | 449 | 442 | 89.1 |
| B | 5 | 236 | 604044 | 7393.07 | 434 | 425 | 81.6 |
| B | 5 | 172 | 156220 | 1908.16 | 434 | 425 | 81.6 |
| B | 0 | 189 | 64806 | 788.53 | 434 | 425 | 81.6 |
| C | 15 | 214 | 144369 | 1475.04 | 425 | 429 | 97.6 |
| C | 0 | 10 | 134440 | 1373.29 | 425 | 429 | 97.6 |
| C | 0 | 207 | 24070 | 242.26 | 425 | 429 | 97.6 |
| D | 8 | 195 | 1867842 | 18065.82 | 424 | 413 | 103.4 |
| D | 13 | 249 | 134575 | 1297.91 | 424 | 413 | 103.4 |
| D | 7 | 223 | 82689 | 795.95 | 424 | 413 | 103.4 |
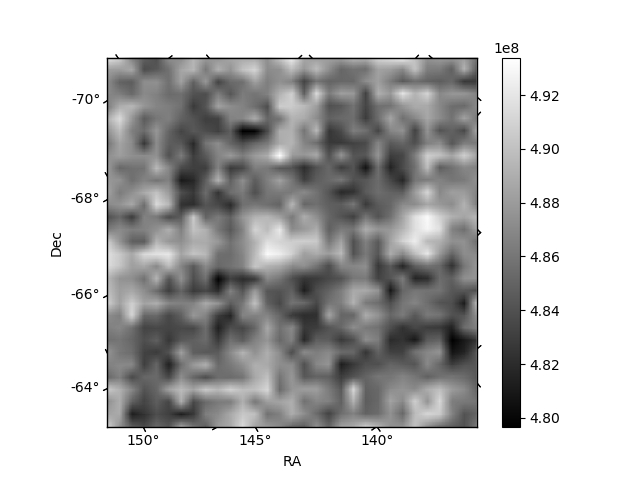
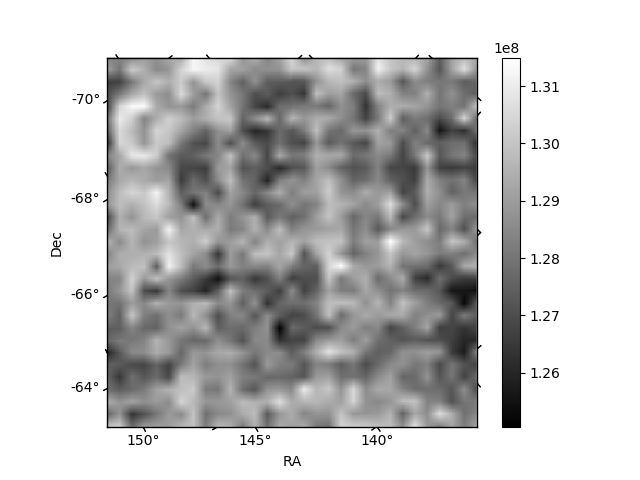
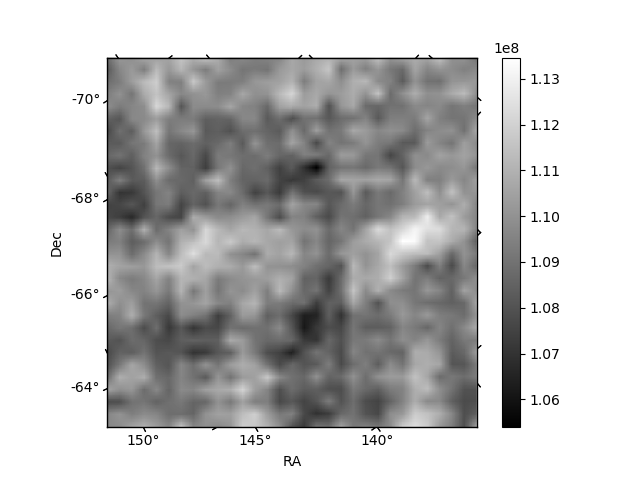
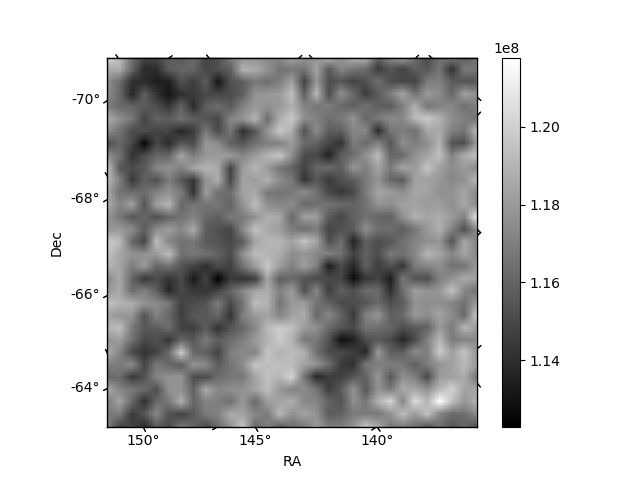
Histogram calculated using DETX and DETY for each event in the final _common_clean file
| Quadrant A | 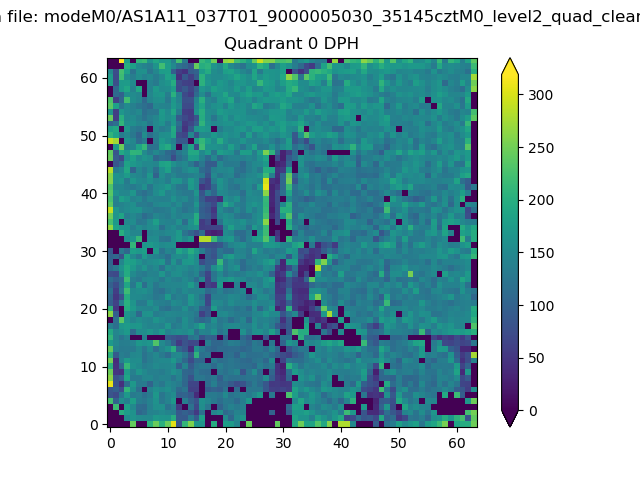 |
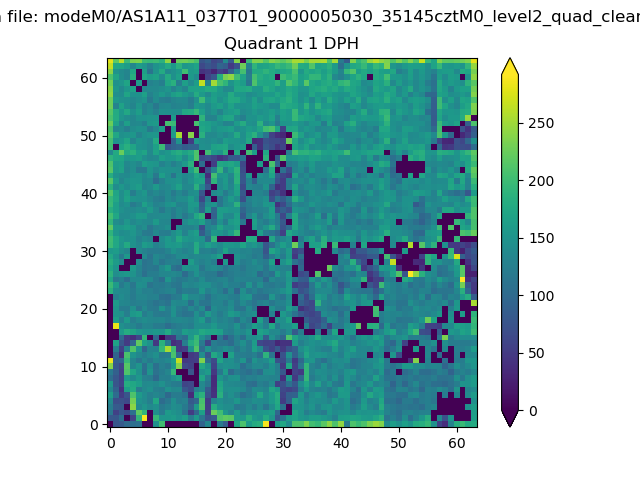 |
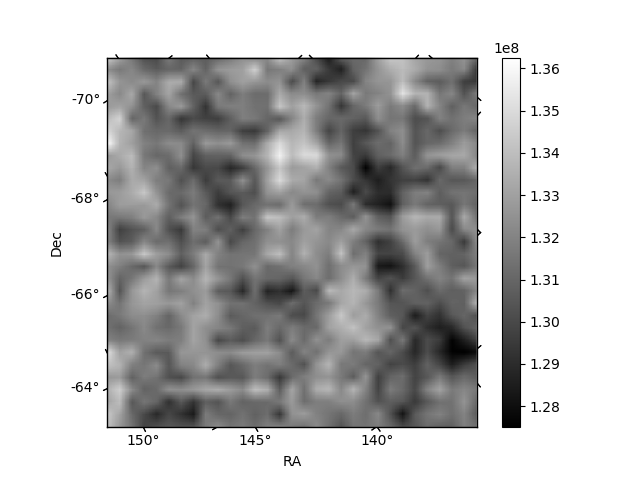
Quadrant B |
|---|---|---|---|
| Quadrant D | 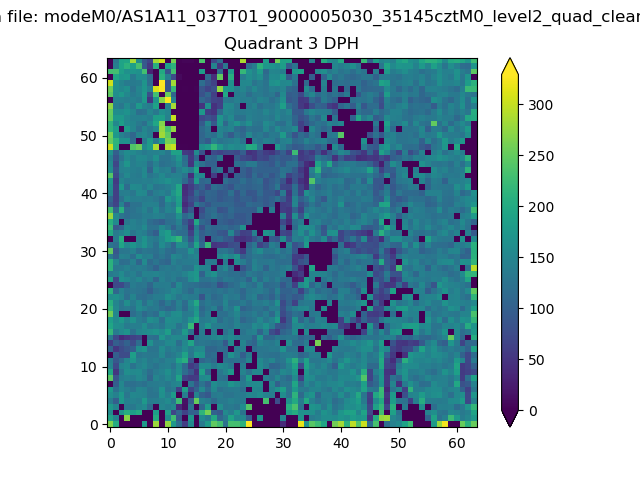 |
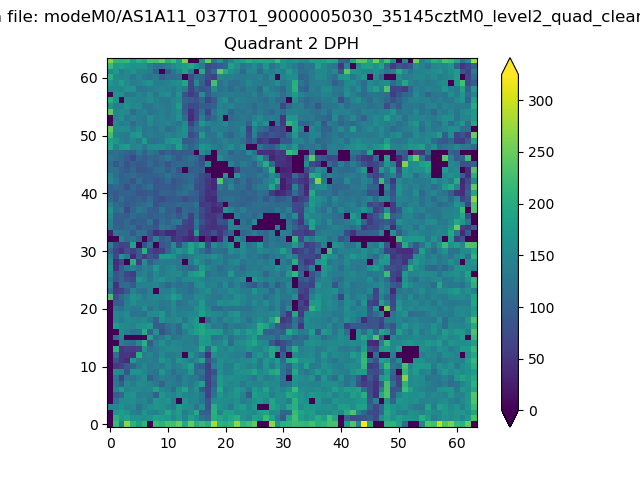 |
Quadrant C |
| Plot type | Count rate plots | Images |
|---|---|---|
| Comparison with Poisson distribution Blue bars denote a histogram of data divided into 1 sec bins. Red curve is a Poisson curve with rate = median count rate of data. |
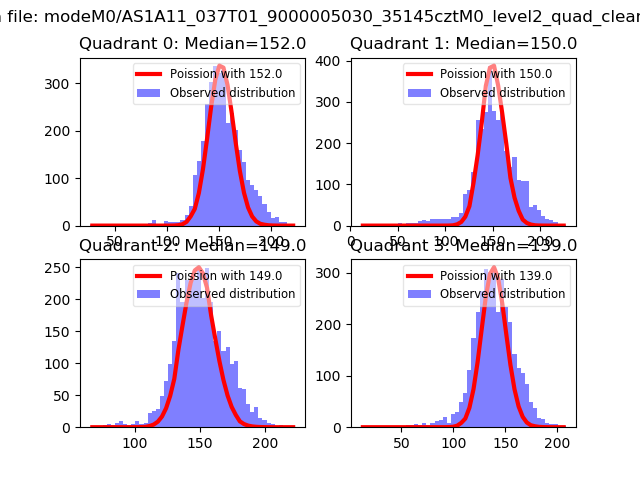 |
 |
| Quadrant-wise count rates Data is divided into 100 sec bins |
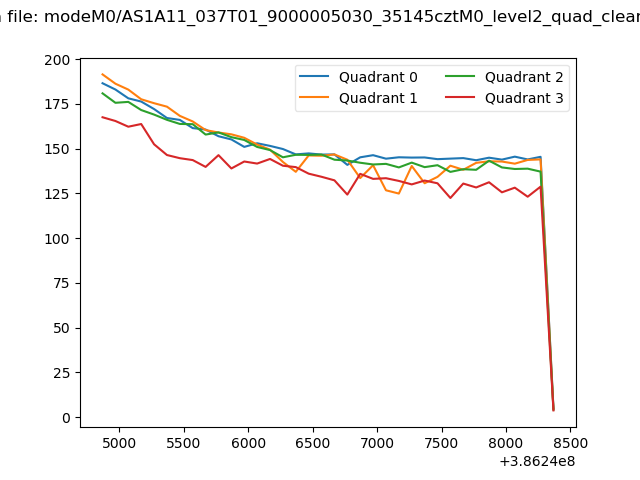 |
|
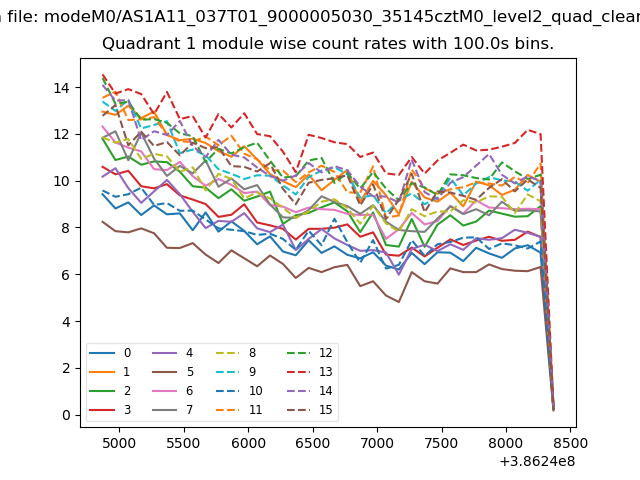
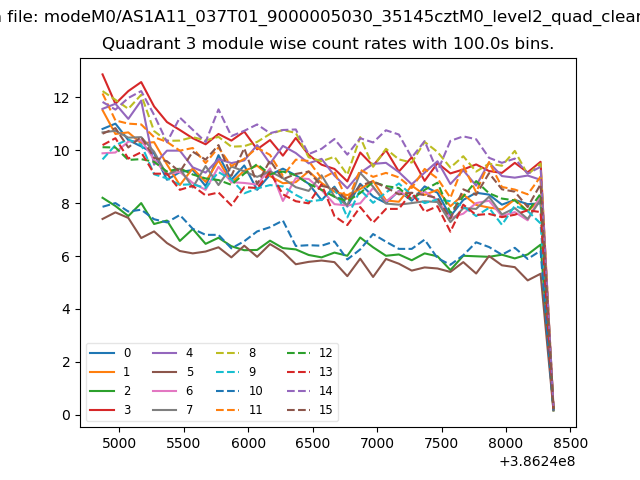
| Module-wise count rates for Quadrant A Data is divided into 100 sec bins |
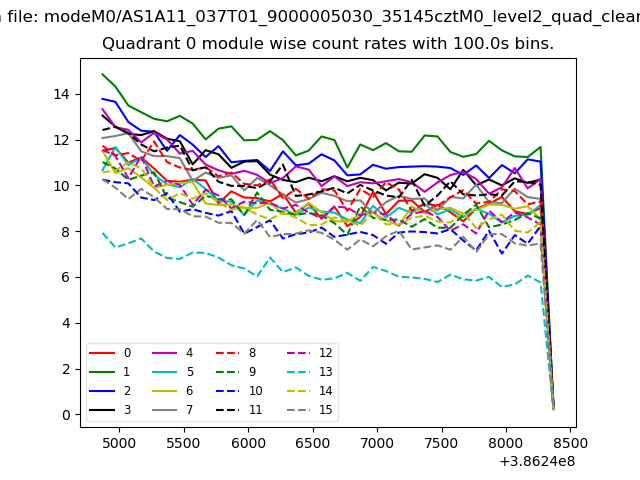 |
 |
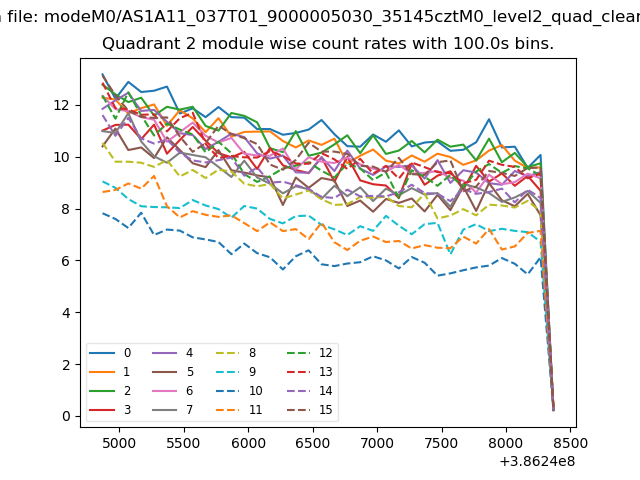
| Module-wise count rates for Quadrant B Data is divided into 100 sec bins |
 |
 |
| Module-wise count rates for Quadrant C Data is divided into 100 sec bins |
 |
 |
| Module-wise count rates for Quadrant D Data is divided into 100 sec bins |
 |
 |
| Parameter | Plot |
|---|---|
| CZT HV Monitor | 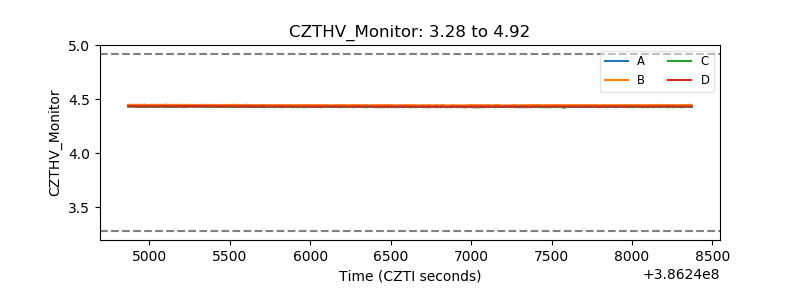 |
| D_VDD | 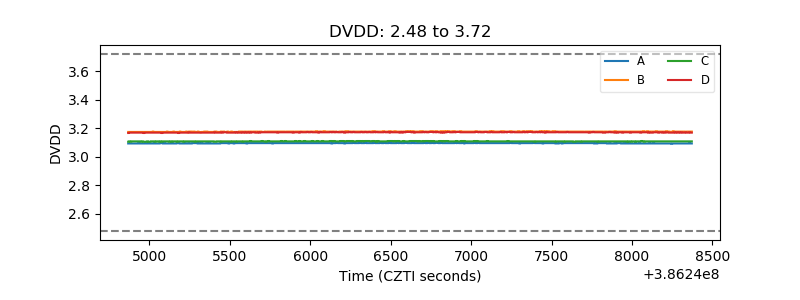 |
| Temperature 1 | 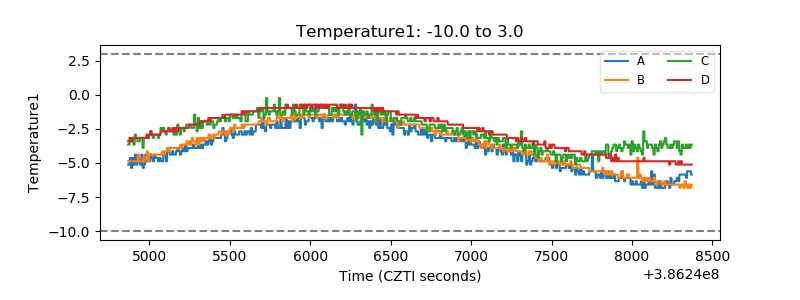 |
| Veto HV Monitor | 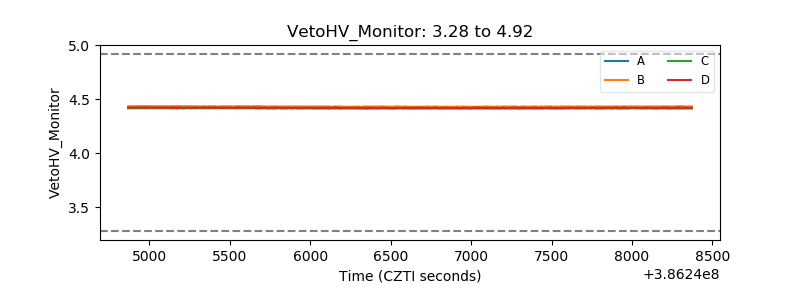 |
| Veto LLD | 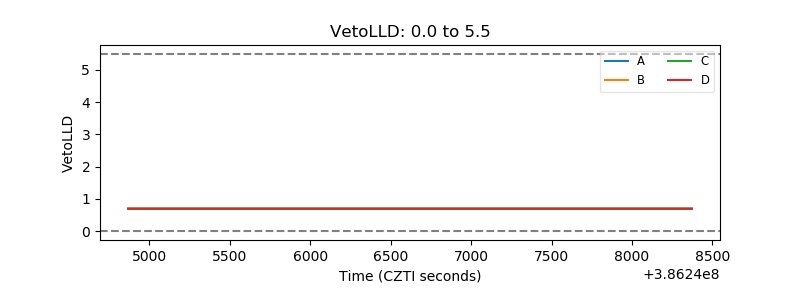 |
| Alpha Counter | 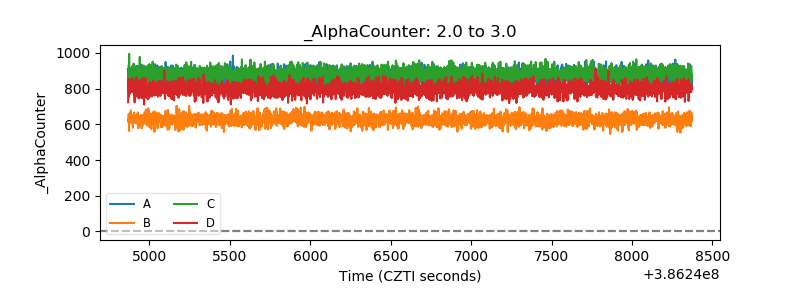 |
| _CPM_Rate | 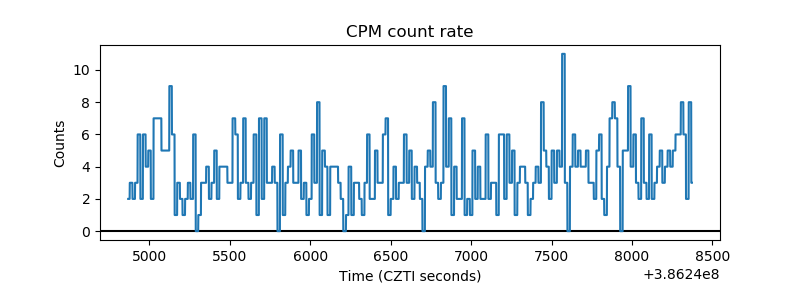 |
| CZT Counter | 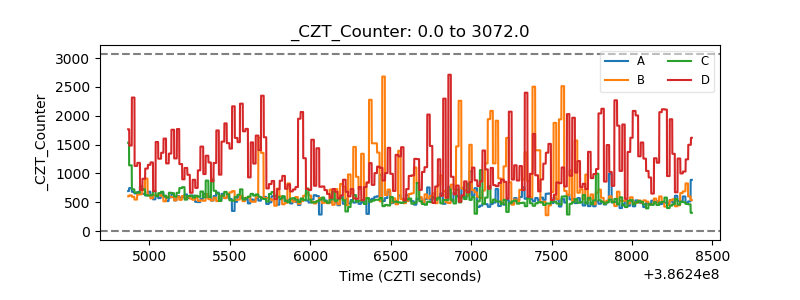 |
| +2.5 Volts monitor | 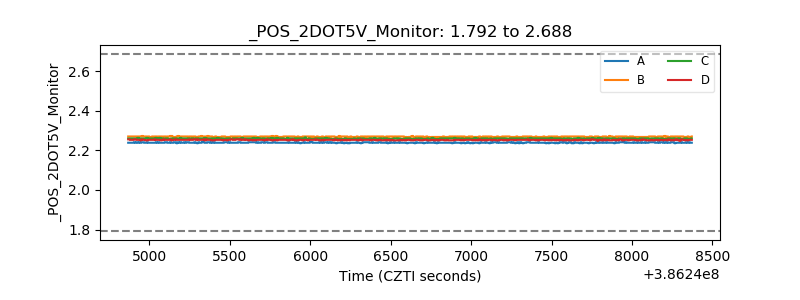 |
| +5 Volts monitor | 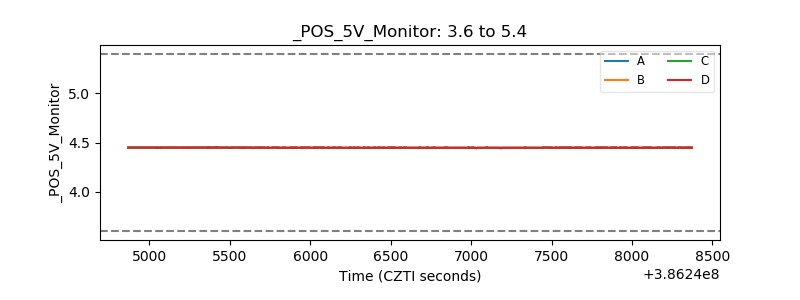 |
| _ROLL_ROT | 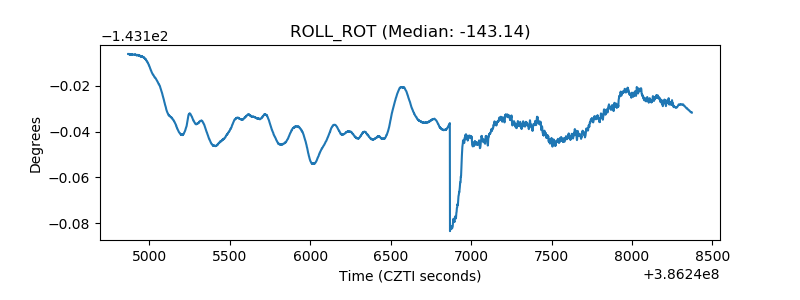 |
| _Roll_DEC | 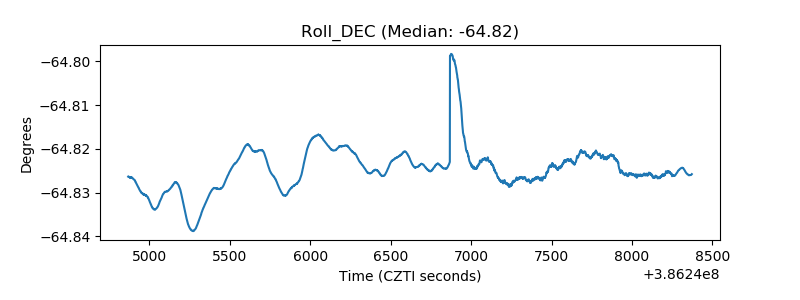 |
| _Roll_RA | 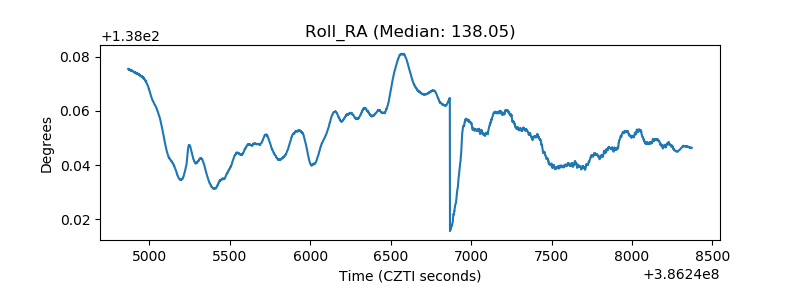 |
| Veto Counter | 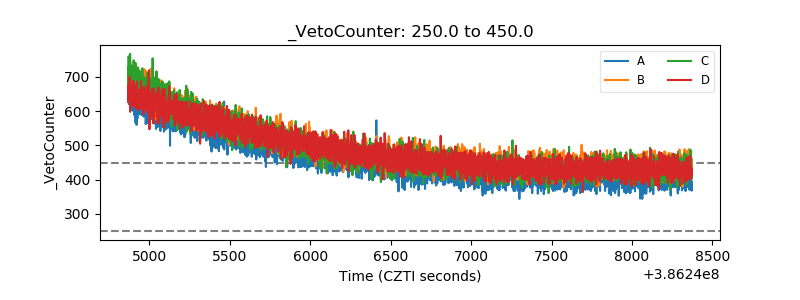 |