| Param | Original file | Final file |
|---|---|---|
| Filename | modeM0/AS1A11_037T01_9000005030_35144cztM0_level2.evt | modeM0/AS1A11_037T01_9000005030_35144cztM0_level2_quad_clean.evt |
| Size (bytes) | 592,306,560 | 109,333,440 |
| Size | 564.9 MB | 104.3 MB |
| Events in quadrant A | 4,446,260 | 747,067 |
| Events in quadrant B | 3,669,443 | 762,637 |
| Events in quadrant C | 3,168,285 | 752,512 |
| Events in quadrant D | 6,303,185 | 684,432 |
| Mode M0 | |||
|---|---|---|---|
| Quadrant | BADHDUFLAG | Total packets | Discarded packets |
| A | 0 | 16712 | 3 |
| B | 0 | 14265 | 2 |
| C | 0 | 12657 | 2 |
| D | 0 | 22430 | 2 |
| Mode SS | |||
|---|---|---|---|
| Quadrant | BADHDUFLAG | Total packets | Discarded packets |
| A | 0 | 106 | 0 |
| B | 0 | 106 | 0 |
| C | 0 | 106 | 0 |
| D | 0 | 106 | 0 |
| Mode M9 | |||
|---|---|---|---|
| Quadrant | BADHDUFLAG | Total packets | Discarded packets |
| A | 0 | 21 | 0 |
| B | 0 | 21 | 0 |
| C | 0 | 21 | 0 |
| D | 0 | 22 | 0 |
| Quadrant | Total seconds | Saturated seconds | Saturation percentage |
|---|---|---|---|
| A | 5201 | 400 | 7.690829% |
| B | 5201 | 295 | 5.671986% |
| C | 5201 | 112 | 2.153432% |
| D | 5201 | 485 | 9.325130% |
Noise dominated data is calculated using 1-second bins in cleaned event files. If a bin has >2000 counts, and if more than 50% of those come from <1% of pixels, then it is considered to be noise-dominated and hence unusable.
| Quadrant | # 1 sec bins | Bins with >0 counts | Bins with >2000 counts | High rate bins dominated by noise | Noise dominated (total time) | Noise dominated (detector-on time) | Marked lightcurve |
|---|---|---|---|---|---|---|---|
| A | 7085 | 5202 | 177 | 177 | 2.50% | 3.40% | 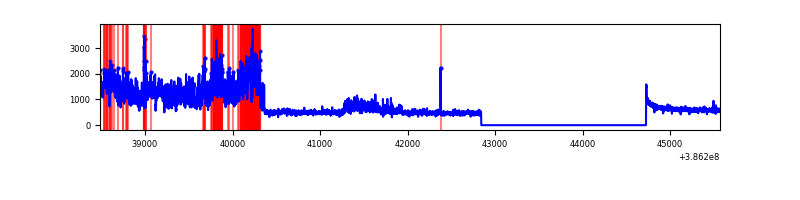 |
| B | 7085 | 5202 | 186 | 186 | 2.63% | 3.58% | 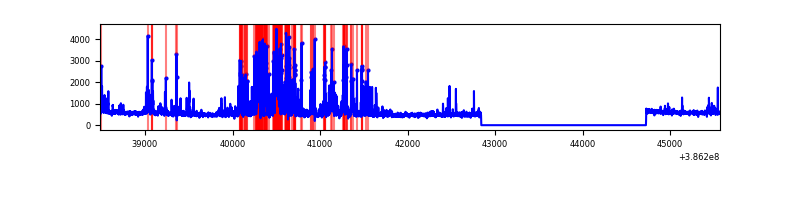 |
| C | 7085 | 5202 | 68 | 68 | 0.96% | 1.31% | 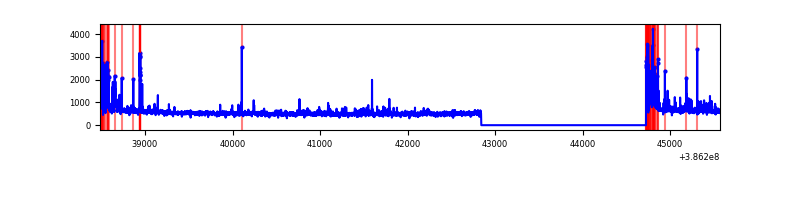 |
| D | 7085 | 5202 | 421 | 421 | 5.94% | 8.09% | 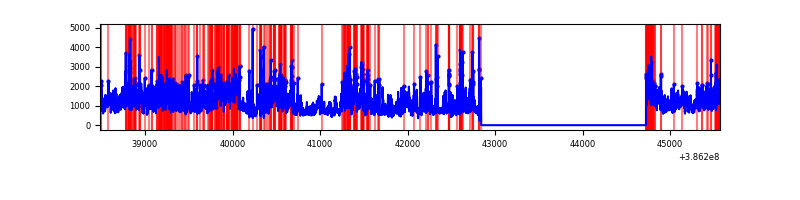 |
Top three noisy pixels from each quadrant. If the there are fewer than three noisy pixels in the level2.evt file, extra rows are filled as -1
| Pixel properties | Quadrant properties | ||||||
|---|---|---|---|---|---|---|---|
| Quadrant | DetID | PixID | Counts | Sigma | Mean | Median | Sigma |
| A | 15 | 169 | 1822169 | 14157.58 | 651 | 641 | 128.7 |
| A | 10 | 83 | 89163 | 688.03 | 651 | 641 | 128.7 |
| A | 13 | 6 | 15853 | 118.23 | 651 | 641 | 128.7 |
| B | 5 | 172 | 791737 | 6648.2 | 641 | 627 | 119.0 |
| B | 5 | 236 | 265953 | 2229.7 | 641 | 627 | 119.0 |
| B | 4 | 232 | 45226 | 374.79 | 641 | 627 | 119.0 |
| C | 0 | 10 | 339432 | 2347.64 | 631 | 635 | 144.3 |
| C | 15 | 214 | 219687 | 1517.88 | 631 | 635 | 144.3 |
| C | 9 | 187 | 53081 | 363.42 | 631 | 635 | 144.3 |
| D | 8 | 195 | 2786247 | 18243.63 | 626 | 608 | 152.7 |
| D | 13 | 249 | 245650 | 1604.82 | 626 | 608 | 152.7 |
| D | 7 | 223 | 243649 | 1591.71 | 626 | 608 | 152.7 |
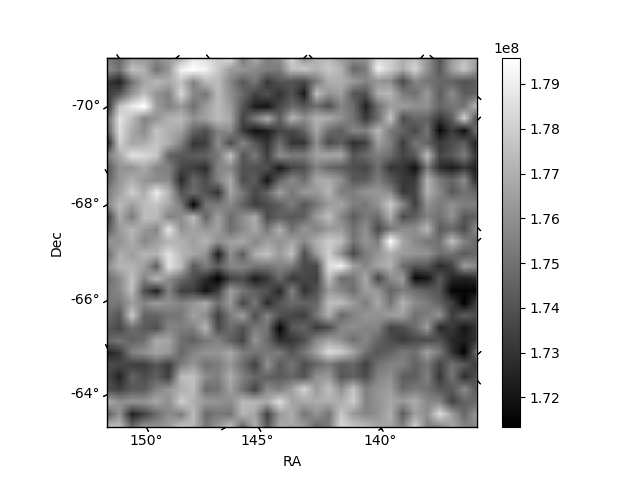
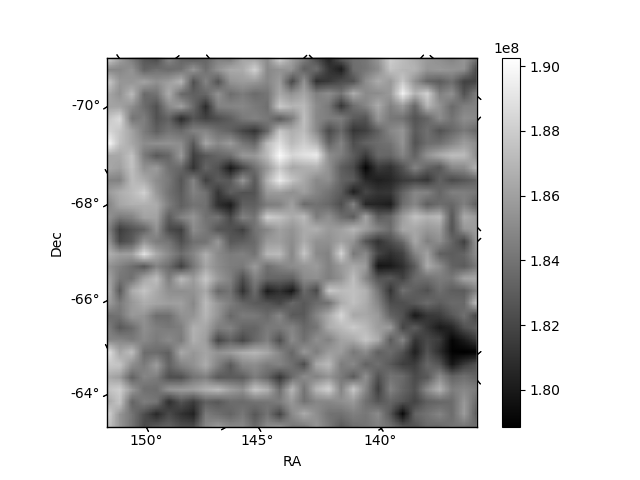
Histogram calculated using DETX and DETY for each event in the final _common_clean file
| Quadrant A | 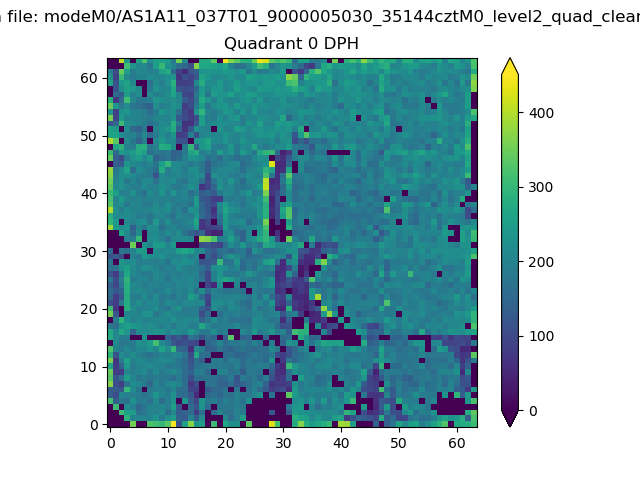 |
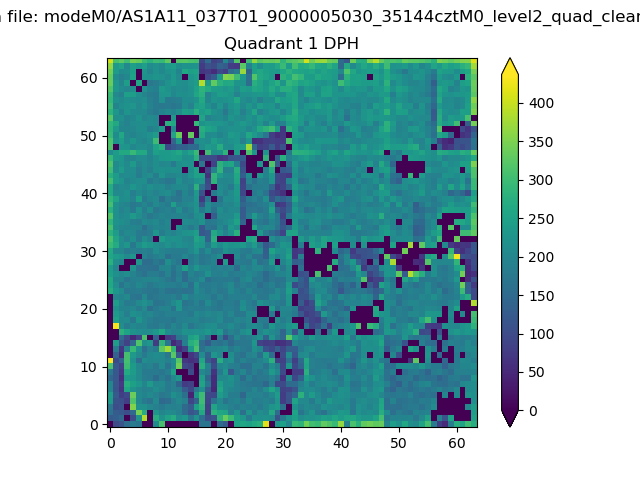 |
Quadrant B |
|---|---|---|---|
| Quadrant D | 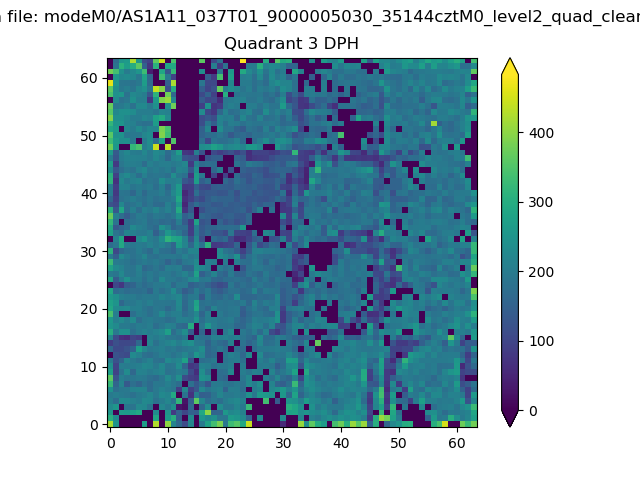 |
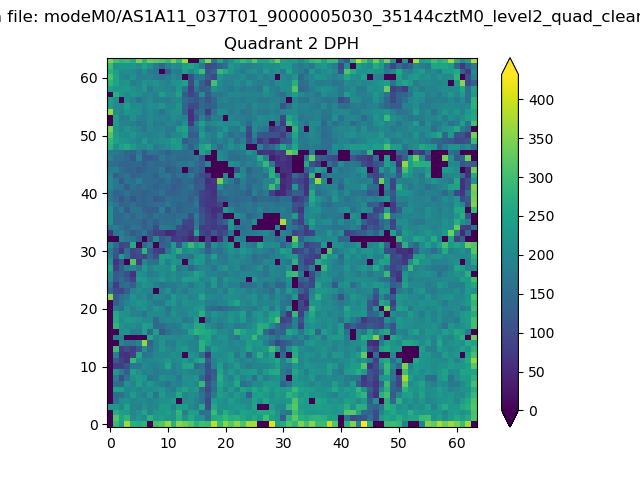 |
Quadrant C |
| Plot type | Count rate plots | Images |
|---|---|---|
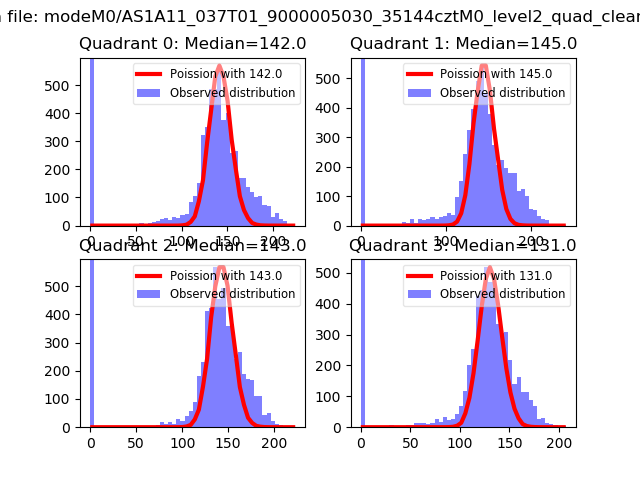
| Comparison with Poisson distribution Blue bars denote a histogram of data divided into 1 sec bins. Red curve is a Poisson curve with rate = median count rate of data. |
 |
 |
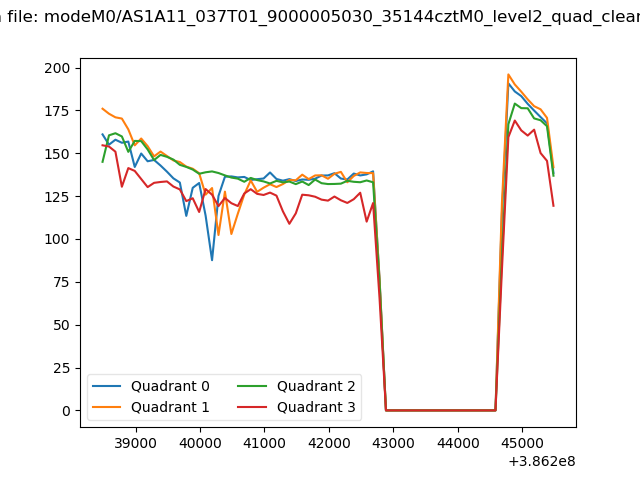
| Quadrant-wise count rates Data is divided into 100 sec bins |
 |
|
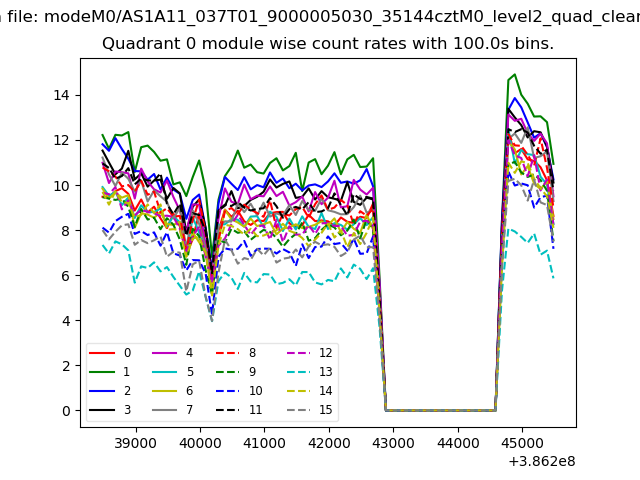
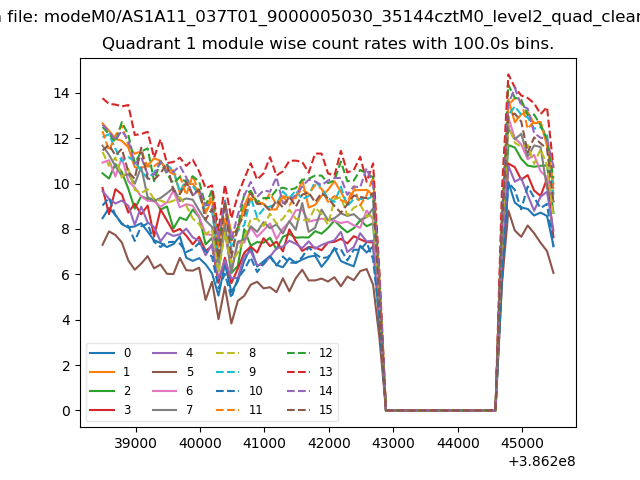
| Module-wise count rates for Quadrant A Data is divided into 100 sec bins |
 |
 |
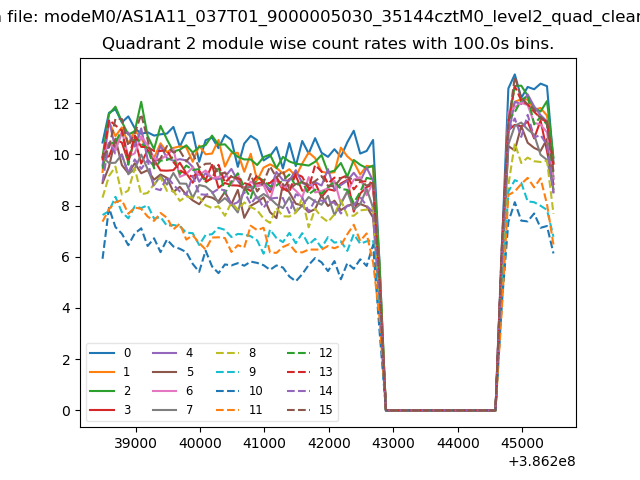
| Module-wise count rates for Quadrant B Data is divided into 100 sec bins |
 |
 |
| Module-wise count rates for Quadrant C Data is divided into 100 sec bins |
 |
 |
| Module-wise count rates for Quadrant D Data is divided into 100 sec bins |
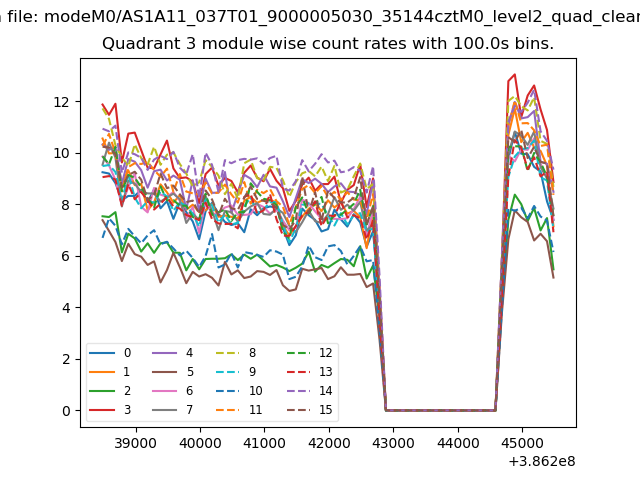 |
 |
| Parameter | Plot |
|---|---|
| CZT HV Monitor | 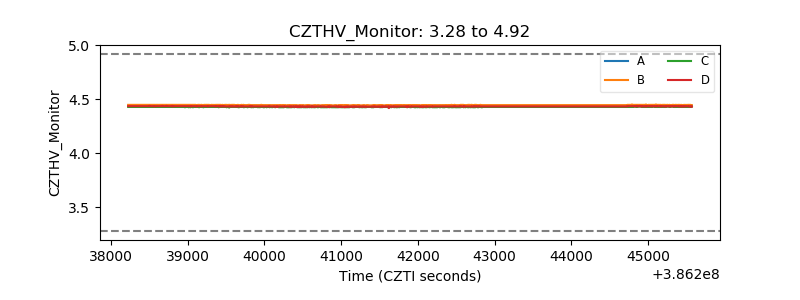 |
| D_VDD | 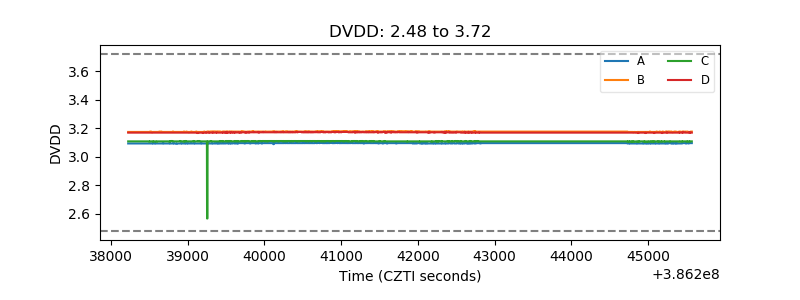 |
| Temperature 1 | 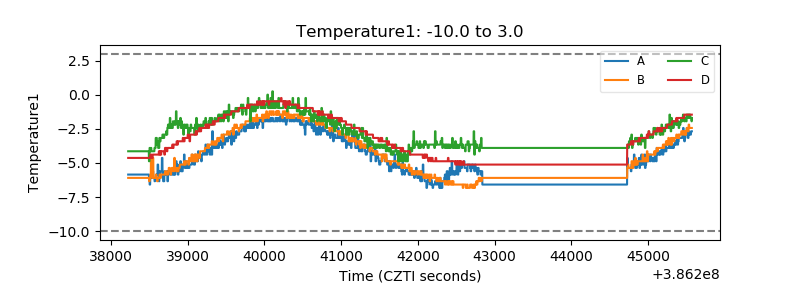 |
| Veto HV Monitor | 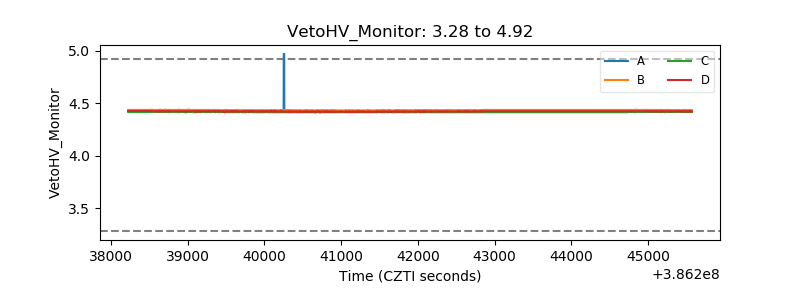 |
| Veto LLD | 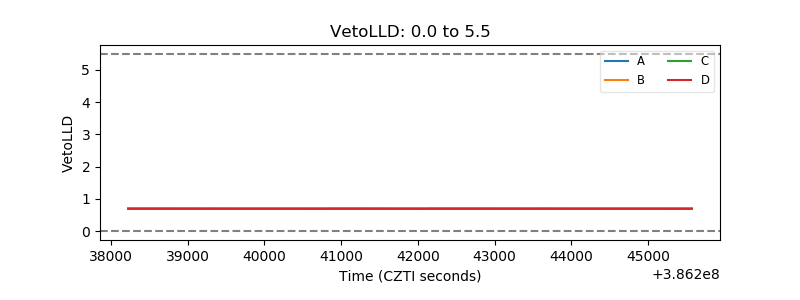 |
| Alpha Counter | 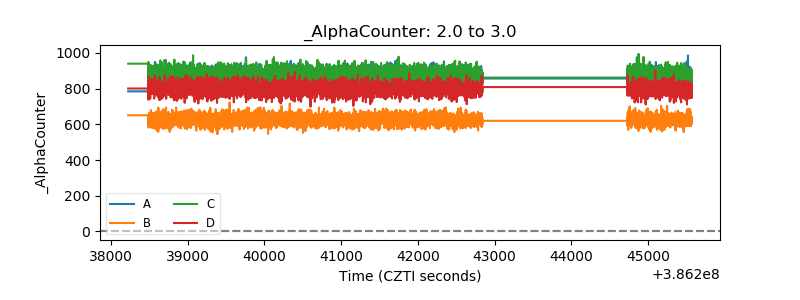 |
| _CPM_Rate | 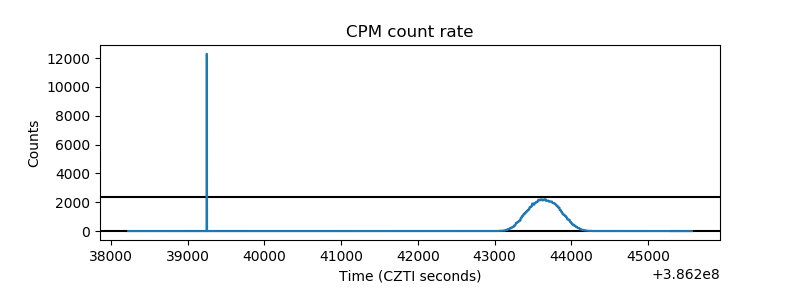 |
| CZT Counter | 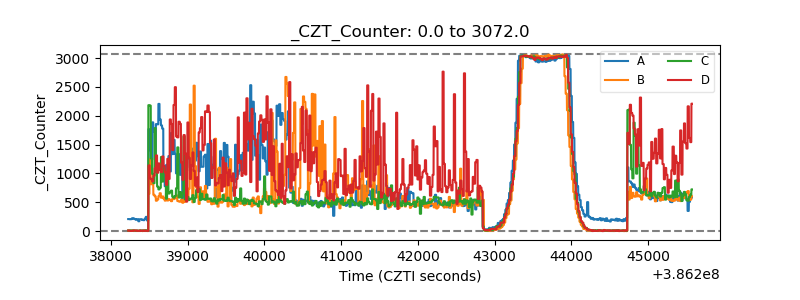 |
| +2.5 Volts monitor | 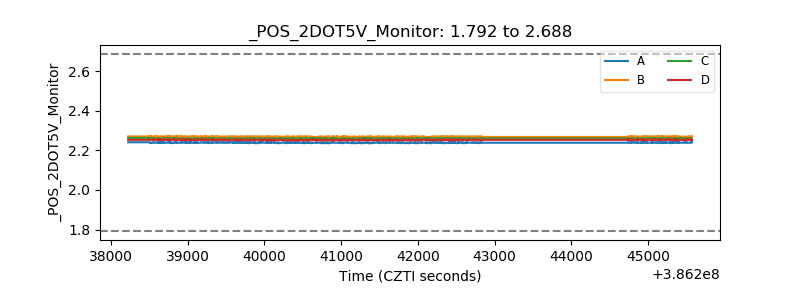 |
| +5 Volts monitor | 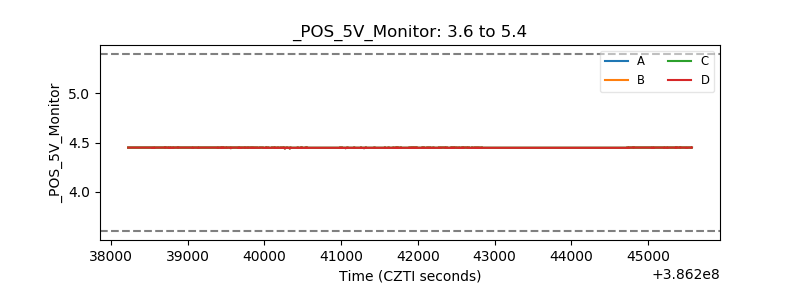 |
| _ROLL_ROT | 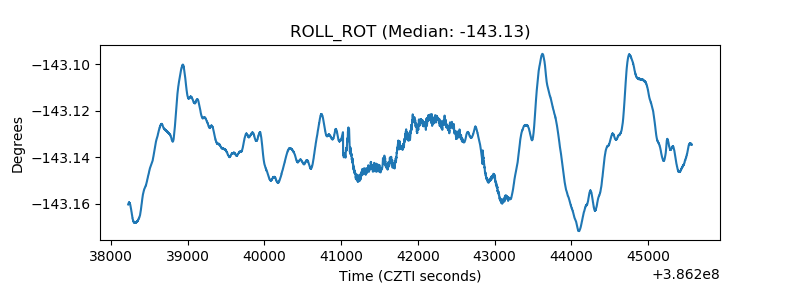 |
| _Roll_DEC | 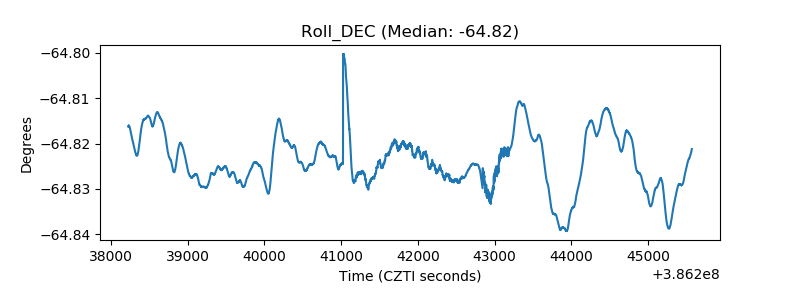 |
| _Roll_RA | 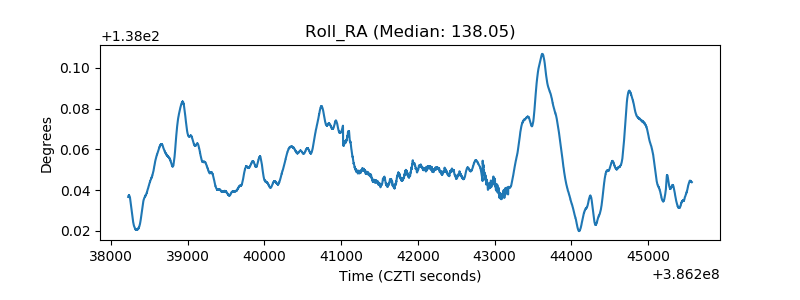 |
| Veto Counter | 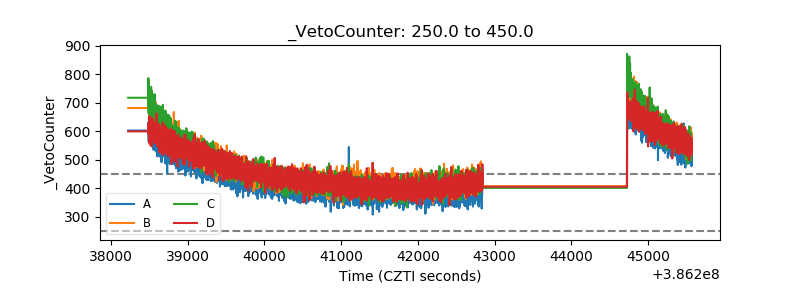 |