| Param | Original file | Final file |
|---|---|---|
| Filename | modeM0/AS1A11_037T01_9000005030_35141cztM0_level2.evt | modeM0/AS1A11_037T01_9000005030_35141cztM0_level2_quad_clean.evt |
| Size (bytes) | 501,960,960 | 97,770,240 |
| Size | 478.7 MB | 93.2 MB |
| Events in quadrant A | 3,393,743 | 656,604 |
| Events in quadrant B | 3,182,303 | 671,119 |
| Events in quadrant C | 2,910,805 | 662,316 |
| Events in quadrant D | 5,358,607 | 602,031 |
| Mode M0 | |||
|---|---|---|---|
| Quadrant | BADHDUFLAG | Total packets | Discarded packets |
| A | 0 | 13438 | 2 |
| B | 0 | 12845 | 1 |
| C | 0 | 11779 | 1 |
| D | 0 | 19687 | 1 |
| Mode SS | |||
|---|---|---|---|
| Quadrant | BADHDUFLAG | Total packets | Discarded packets |
| A | 0 | 108 | 0 |
| B | 0 | 108 | 0 |
| C | 0 | 108 | 0 |
| D | 0 | 108 | 0 |
| Mode M9 | |||
|---|---|---|---|
| Quadrant | BADHDUFLAG | Total packets | Discarded packets |
| A | 0 | 16 | 0 |
| B | 0 | 16 | 0 |
| C | 0 | 16 | 0 |
| D | 0 | 16 | 0 |
| Quadrant | Total seconds | Saturated seconds | Saturation percentage |
|---|---|---|---|
| A | 5260 | 319 | 6.064639% |
| B | 5260 | 172 | 3.269962% |
| C | 5260 | 33 | 0.627376% |
| D | 5260 | 364 | 6.920152% |
Noise dominated data is calculated using 1-second bins in cleaned event files. If a bin has >2000 counts, and if more than 50% of those come from <1% of pixels, then it is considered to be noise-dominated and hence unusable.
| Quadrant | # 1 sec bins | Bins with >0 counts | Bins with >2000 counts | High rate bins dominated by noise | Noise dominated (total time) | Noise dominated (detector-on time) | Marked lightcurve |
|---|---|---|---|---|---|---|---|
| A | 6903 | 5261 | 153 | 153 | 2.22% | 2.91% | 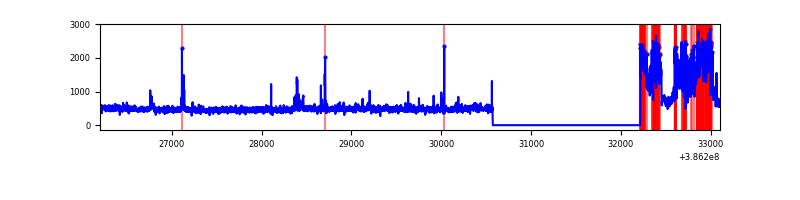 |
| B | 6903 | 5261 | 92 | 92 | 1.33% | 1.75% | 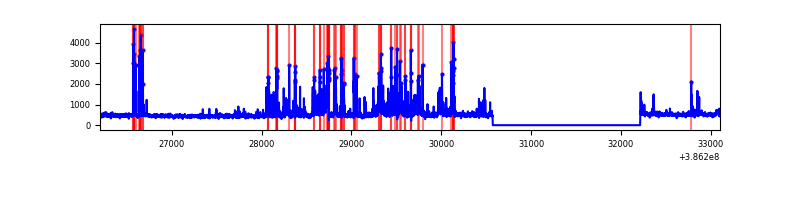 |
| C | 6903 | 5261 | 21 | 21 | 0.30% | 0.40% |  |
| D | 6903 | 5261 | 221 | 221 | 3.20% | 4.20% | 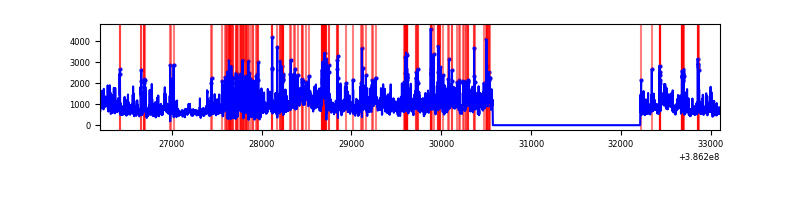 |
Top three noisy pixels from each quadrant. If the there are fewer than three noisy pixels in the level2.evt file, extra rows are filled as -1
| Pixel properties | Quadrant properties | ||||||
|---|---|---|---|---|---|---|---|
| Quadrant | DetID | PixID | Counts | Sigma | Mean | Median | Sigma |
| A | 15 | 169 | 856525 | 7071.51 | 605 | 594 | 121.0 |
| A | 15 | 174 | 127432 | 1047.91 | 605 | 594 | 121.0 |
| A | 10 | 83 | 61997 | 507.3 | 605 | 594 | 121.0 |
| B | 5 | 172 | 306978 | 2645.39 | 602 | 586 | 115.8 |
| B | 5 | 236 | 306087 | 2637.7 | 602 | 586 | 115.8 |
| B | 3 | 112 | 102060 | 876.13 | 602 | 586 | 115.8 |
| C | 15 | 214 | 219987 | 1597.63 | 594 | 599 | 137.3 |
| C | 0 | 10 | 207098 | 1503.77 | 594 | 599 | 137.3 |
| C | 14 | 67 | 70604 | 509.79 | 594 | 599 | 137.3 |
| D | 8 | 195 | 1624000 | 11418.68 | 580 | 565 | 142.2 |
| D | 12 | 79 | 366228 | 2571.95 | 580 | 565 | 142.2 |
| D | 5 | 223 | 362124 | 2543.08 | 580 | 565 | 142.2 |
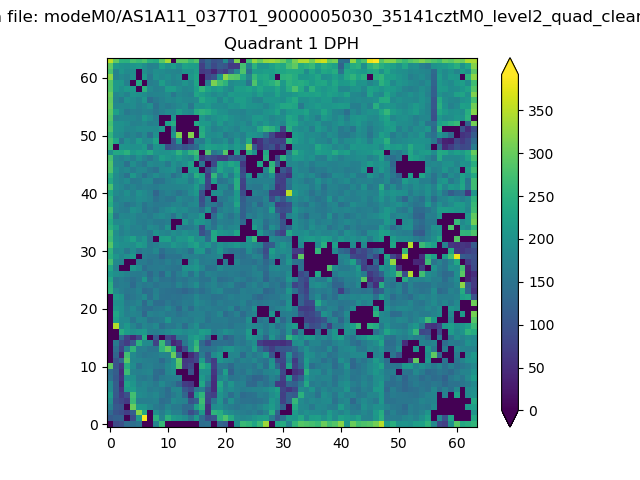
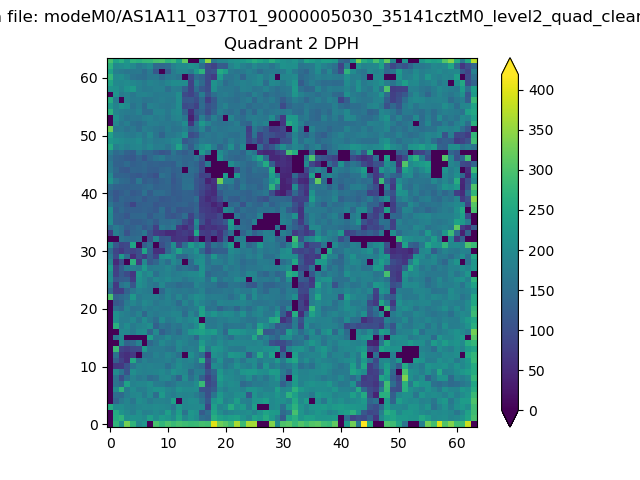
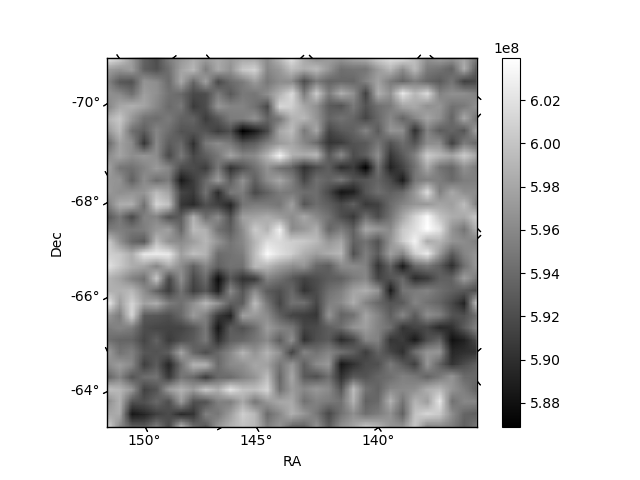
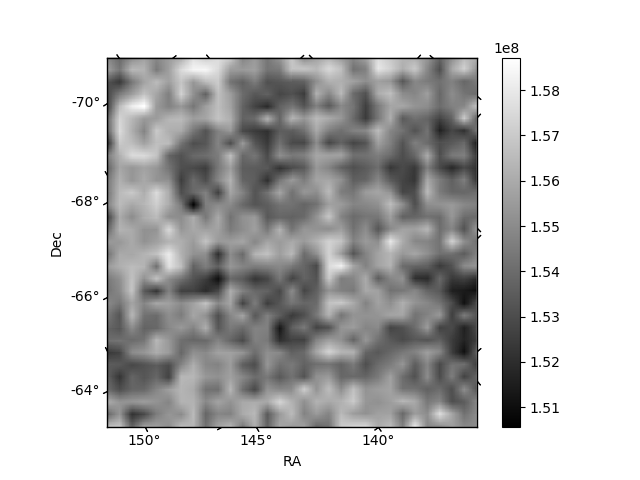
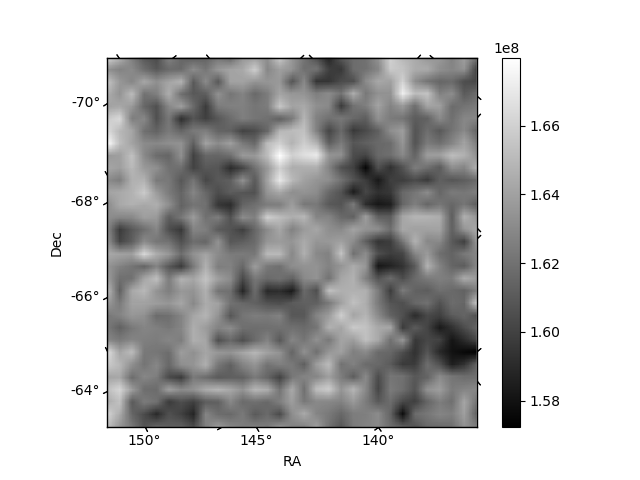
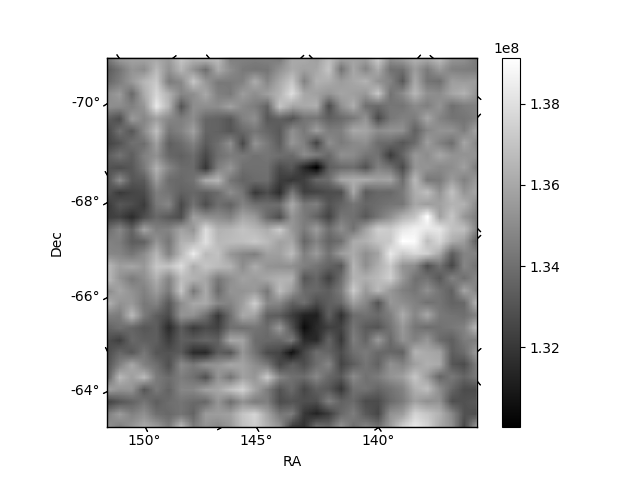
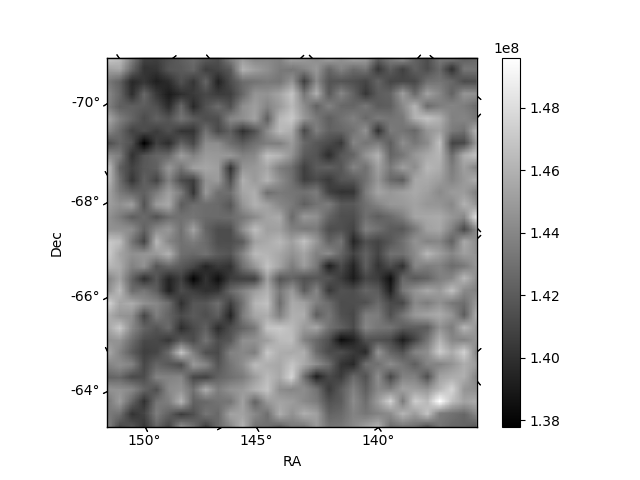
Histogram calculated using DETX and DETY for each event in the final _common_clean file
| Quadrant A | 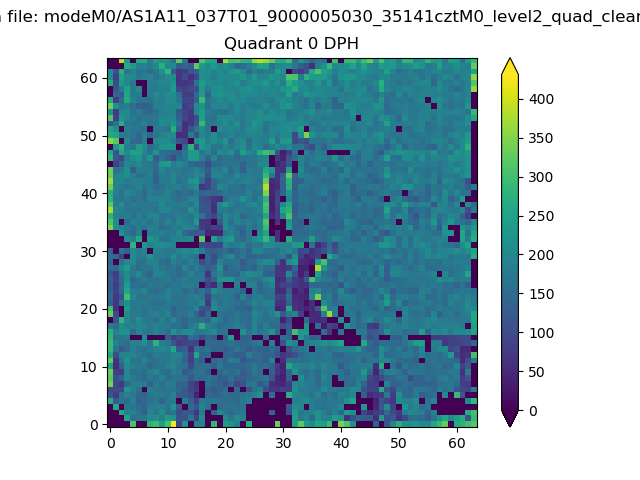 |
 |
Quadrant B |
|---|---|---|---|
| Quadrant D | 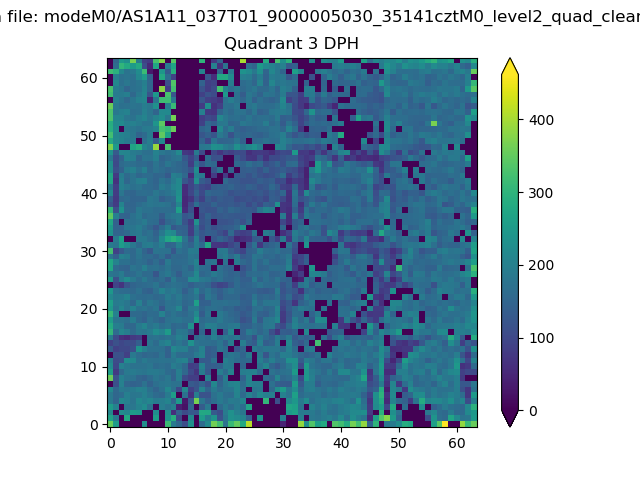 |
 |
Quadrant C |
| Plot type | Count rate plots | Images |
|---|---|---|
| Comparison with Poisson distribution Blue bars denote a histogram of data divided into 1 sec bins. Red curve is a Poisson curve with rate = median count rate of data. |
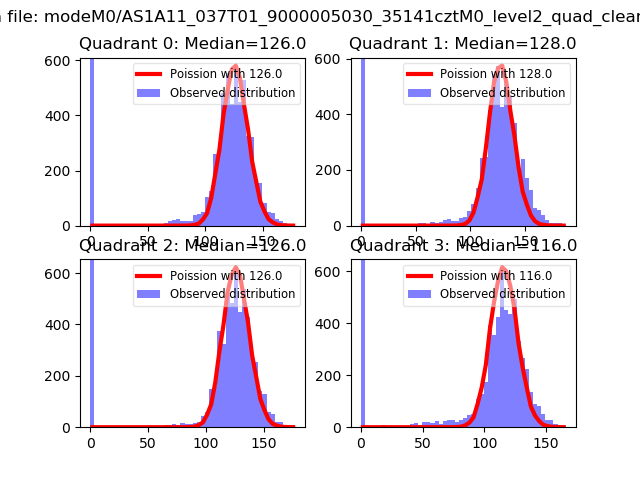 |
 |
| Quadrant-wise count rates Data is divided into 100 sec bins |
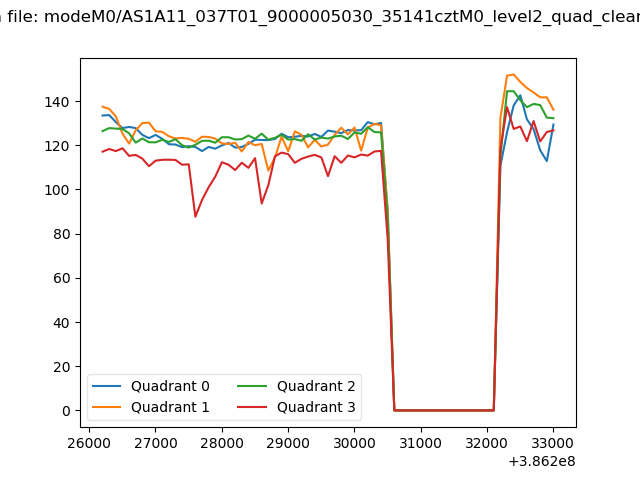 |
|
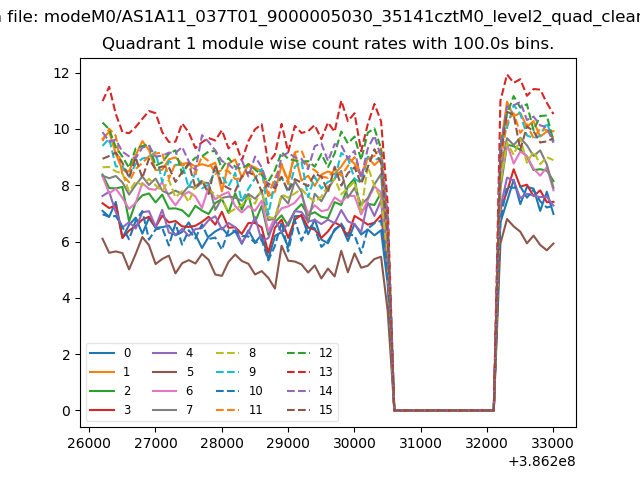
| Module-wise count rates for Quadrant A Data is divided into 100 sec bins |
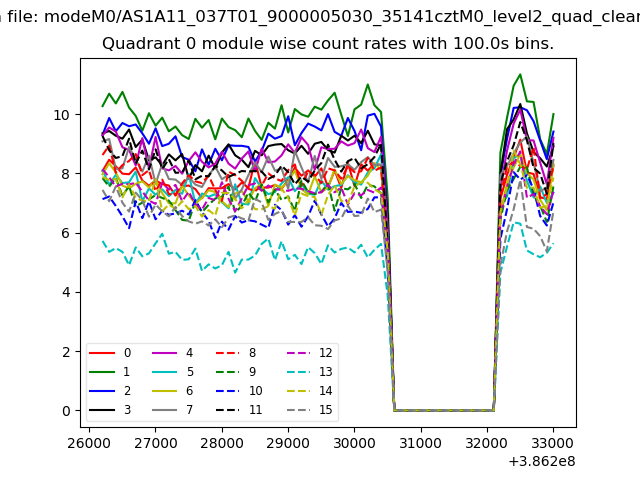 |
 |
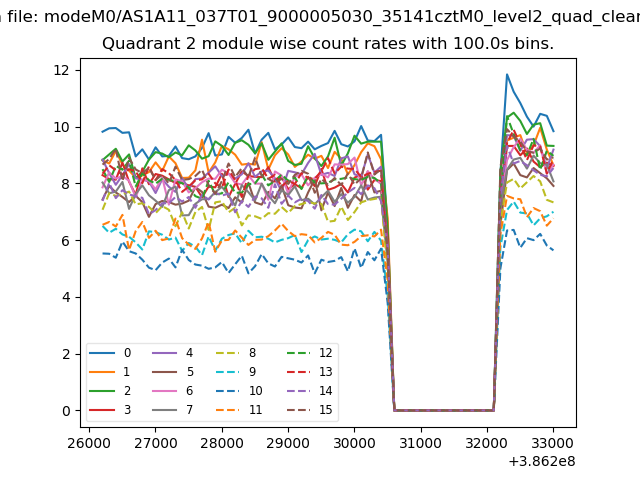
| Module-wise count rates for Quadrant B Data is divided into 100 sec bins |
 |
 |
| Module-wise count rates for Quadrant C Data is divided into 100 sec bins |
 |
 |
| Module-wise count rates for Quadrant D Data is divided into 100 sec bins |
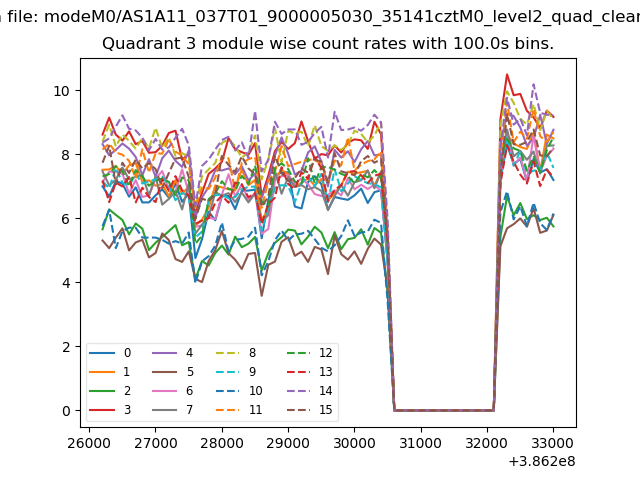 |
 |
| Parameter | Plot |
|---|---|
| CZT HV Monitor | 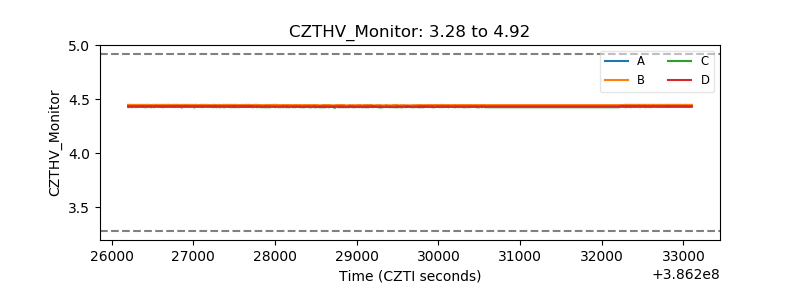 |
| D_VDD | 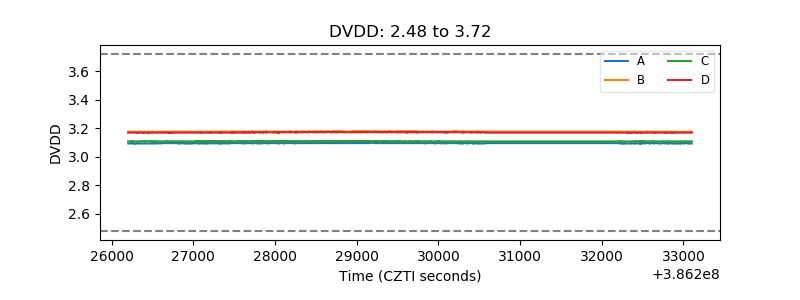 |
| Temperature 1 | 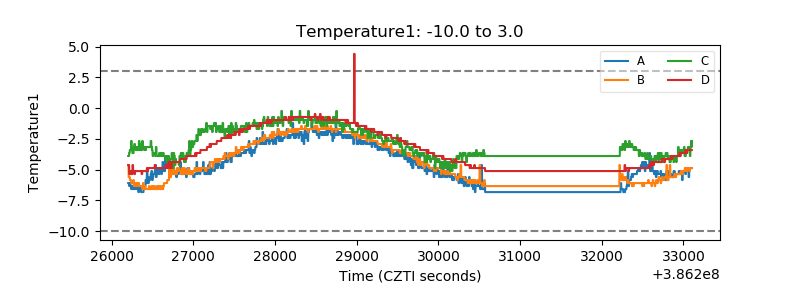 |
| Veto HV Monitor | 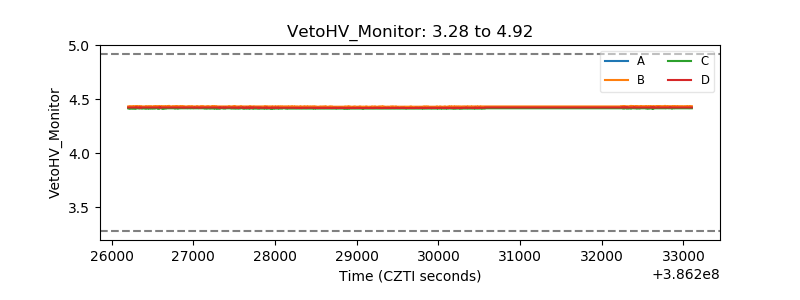 |
| Veto LLD | 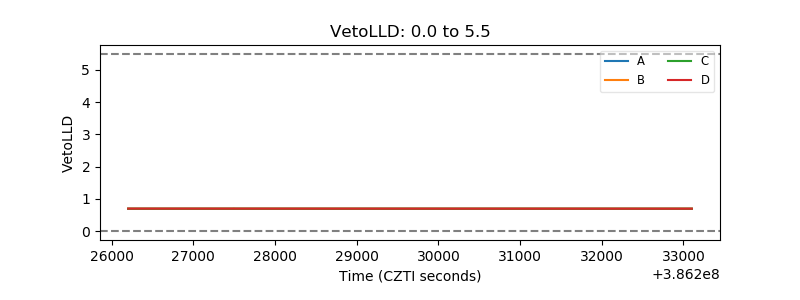 |
| Alpha Counter | 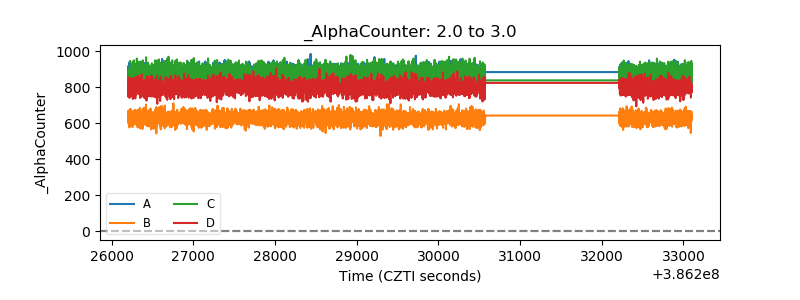 |
| _CPM_Rate | 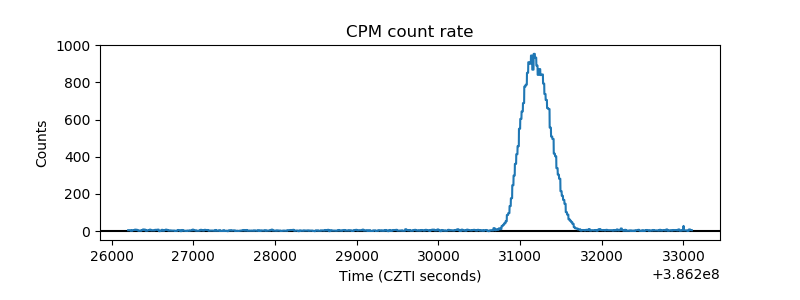 |
| CZT Counter | 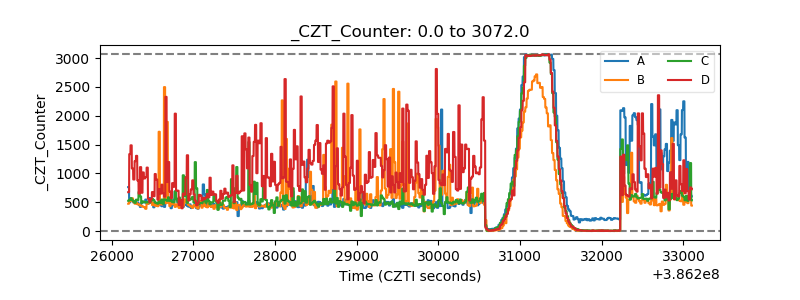 |
| +2.5 Volts monitor | 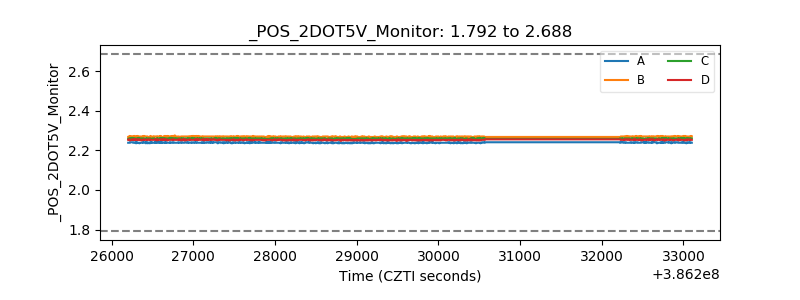 |
| +5 Volts monitor | 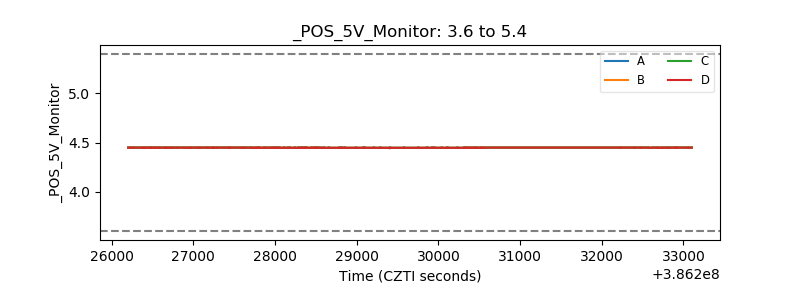 |
| _ROLL_ROT | 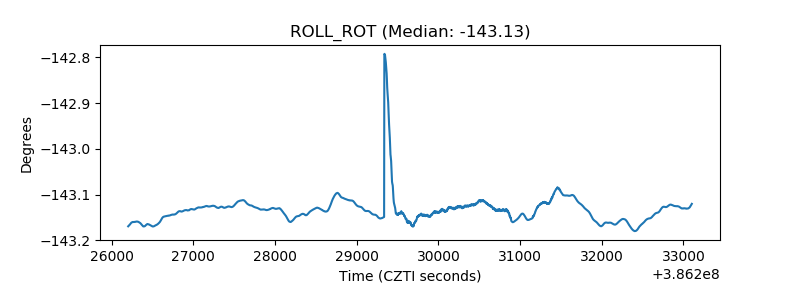 |
| _Roll_DEC | 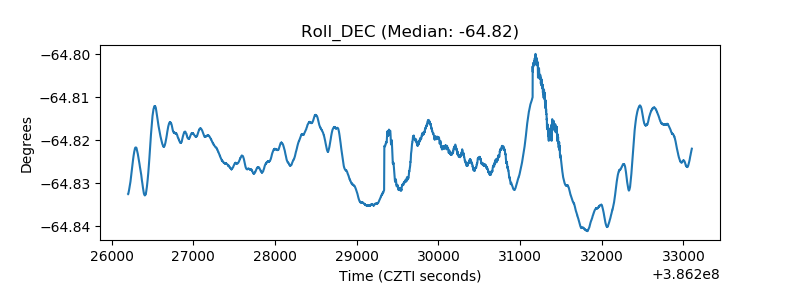 |
| _Roll_RA | 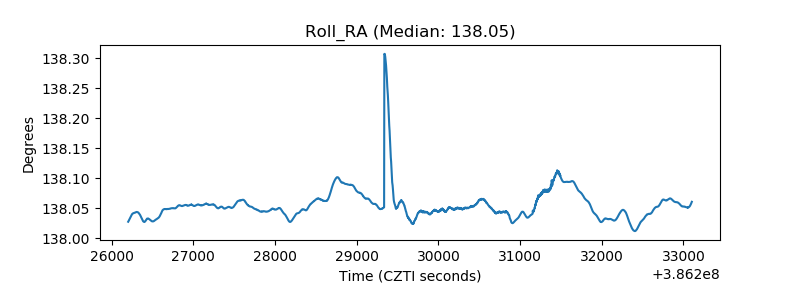 |
| Veto Counter | 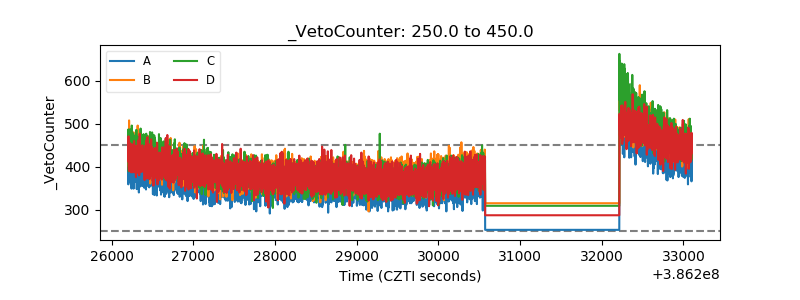 |