| Param | Original file | Final file |
|---|---|---|
| Filename | modeM0/AS1A11_047T09_9000005028_35134cztM0_level2.evt | modeM0/AS1A11_047T09_9000005028_35134cztM0_level2_quad_clean.evt |
| Size (bytes) | 768,983,040 | 64,183,680 |
| Size | 733.4 MB | 61.2 MB |
| Events in quadrant A | 8,772,408 | 376,658 |
| Events in quadrant B | 2,991,401 | 444,465 |
| Events in quadrant C | 3,057,674 | 428,847 |
| Events in quadrant D | 8,122,731 | 333,499 |
| Mode SS | |||
|---|---|---|---|
| Quadrant | BADHDUFLAG | Total packets | Discarded packets |
| A | 0 | 102 | 0 |
| B | 0 | 102 | 0 |
| C | 0 | 102 | 0 |
| D | 0 | 102 | 0 |
| Mode M9 | |||
|---|---|---|---|
| Quadrant | BADHDUFLAG | Total packets | Discarded packets |
| A | 0 | 24 | 0 |
| B | 0 | 24 | 0 |
| C | 0 | 24 | 0 |
| D | 0 | 25 | 0 |
| Mode M0 | |||
|---|---|---|---|
| Quadrant | BADHDUFLAG | Total packets | Discarded packets |
| A | 0 | 29523 | 3 |
| B | 0 | 12168 | 2 |
| C | 0 | 12139 | 2 |
| D | 0 | 27720 | 2 |
| Quadrant | Total seconds | Saturated seconds | Saturation percentage |
|---|---|---|---|
| A | 5122 | 2254 | 44.006248% |
| B | 5122 | 57 | 1.112847% |
| C | 5122 | 145 | 2.830925% |
| D | 5122 | 1248 | 24.365482% |
Noise dominated data is calculated using 1-second bins in cleaned event files. If a bin has >2000 counts, and if more than 50% of those come from <1% of pixels, then it is considered to be noise-dominated and hence unusable.
| Quadrant | # 1 sec bins | Bins with >0 counts | Bins with >2000 counts | High rate bins dominated by noise | Noise dominated (total time) | Noise dominated (detector-on time) | Marked lightcurve |
|---|---|---|---|---|---|---|---|
| A | 7125 | 5123 | 2241 | 2241 | 31.45% | 43.74% | 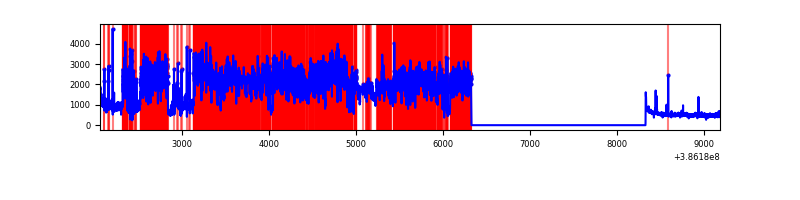 |
| B | 7125 | 5123 | 26 | 26 | 0.36% | 0.51% | 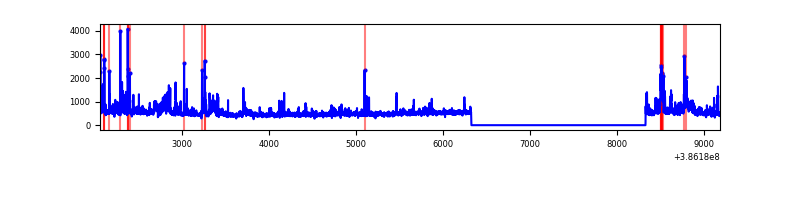 |
| C | 7125 | 5123 | 97 | 97 | 1.36% | 1.89% | 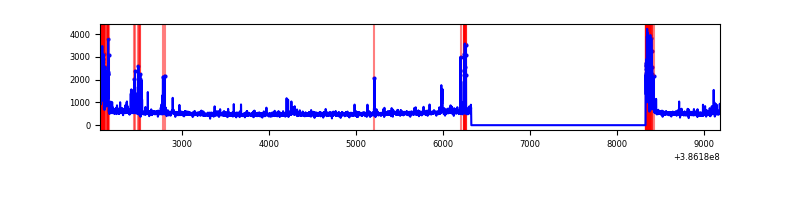 |
| D | 7125 | 5123 | 1310 | 1310 | 18.39% | 25.57% | 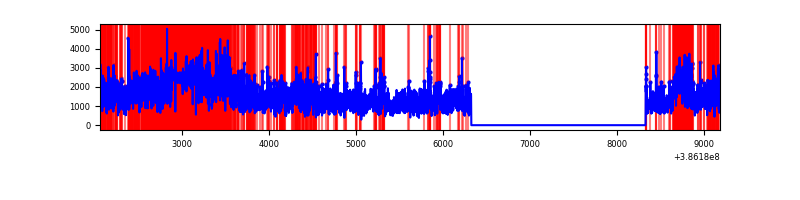 |
Top three noisy pixels from each quadrant. If the there are fewer than three noisy pixels in the level2.evt file, extra rows are filled as -1
| Pixel properties | Quadrant properties | ||||||
|---|---|---|---|---|---|---|---|
| Quadrant | DetID | PixID | Counts | Sigma | Mean | Median | Sigma |
| A | 15 | 169 | 6648756 | 63453.91 | 523 | 514 | 104.8 |
| A | 10 | 83 | 85764 | 813.67 | 523 | 514 | 104.8 |
| A | 13 | 6 | 13988 | 128.6 | 523 | 514 | 104.8 |
| B | 5 | 172 | 279387 | 2419.01 | 602 | 586 | 115.3 |
| B | 0 | 190 | 168554 | 1457.37 | 602 | 586 | 115.3 |
| B | 5 | 236 | 98261 | 847.47 | 602 | 586 | 115.3 |
| C | 0 | 10 | 405044 | 2989.87 | 584 | 589 | 135.3 |
| C | 15 | 214 | 214878 | 1584.1 | 584 | 589 | 135.3 |
| C | 14 | 67 | 75749 | 555.61 | 584 | 589 | 135.3 |
| D | 8 | 195 | 3673873 | 28587.69 | 529 | 516 | 128.5 |
| D | 10 | 118 | 1318013 | 10253.34 | 529 | 516 | 128.5 |
| D | 14 | 52 | 325789 | 2531.42 | 529 | 516 | 128.5 |
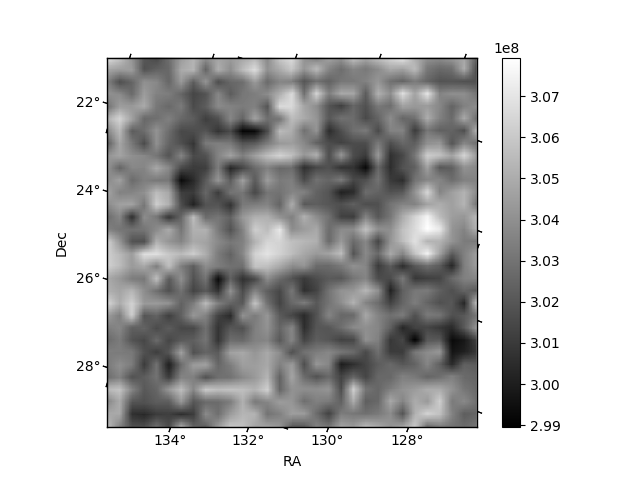
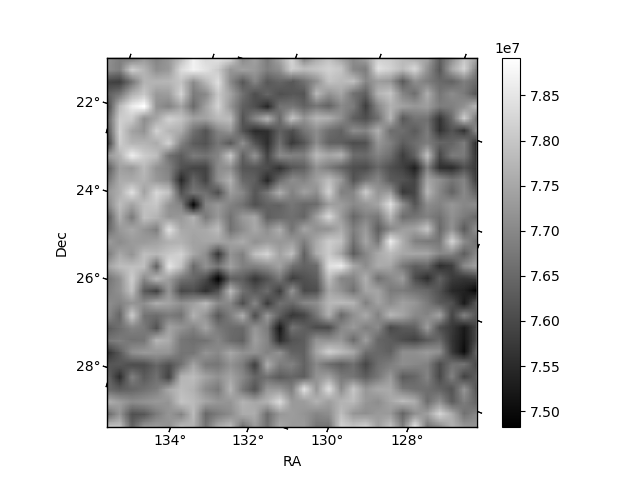
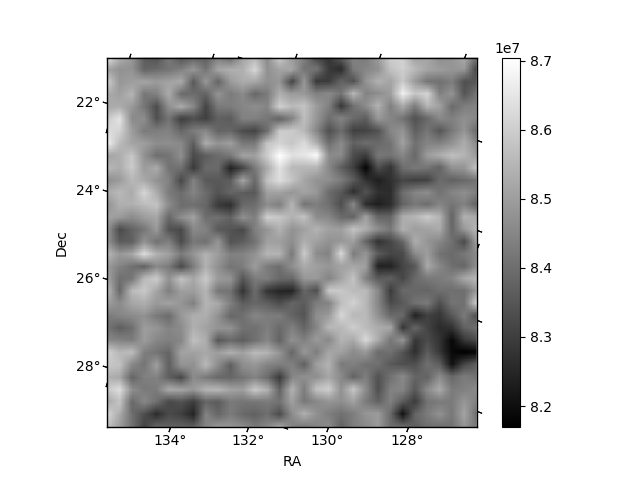
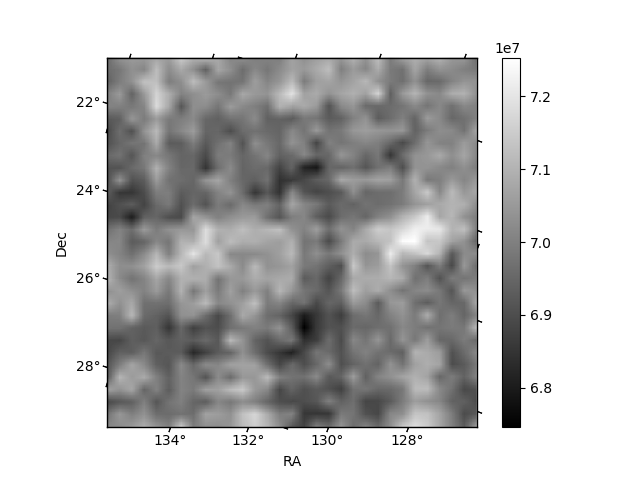
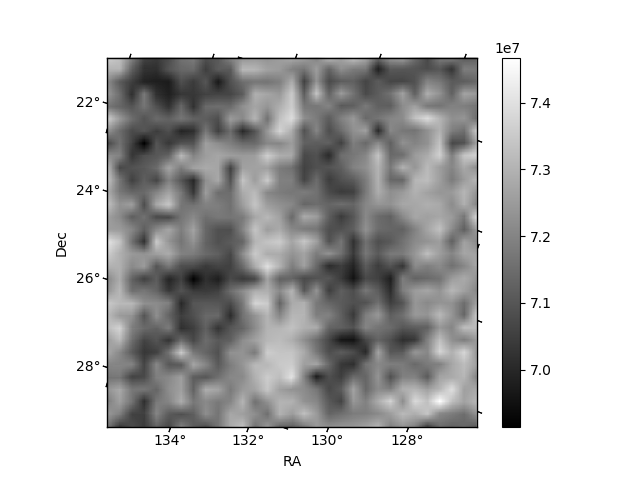
Histogram calculated using DETX and DETY for each event in the final _common_clean file
| Quadrant A | 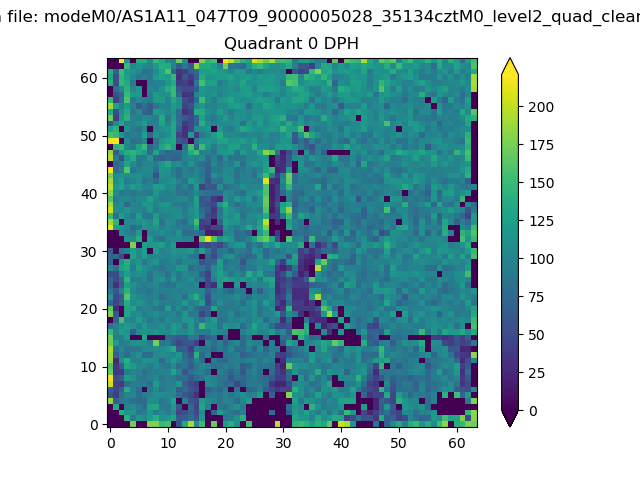 |
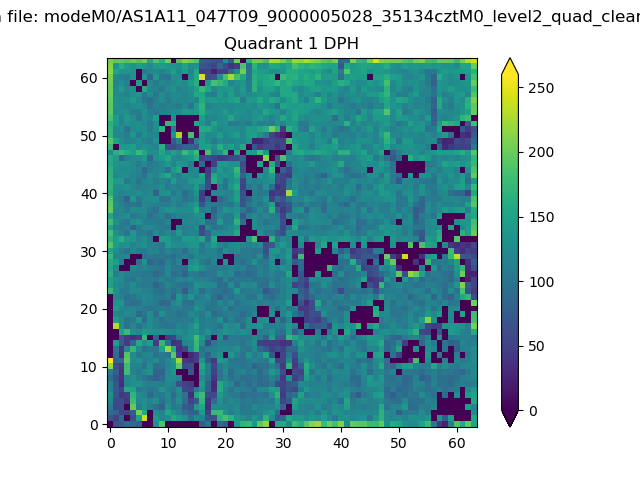 |
Quadrant B |
|---|---|---|---|
| Quadrant D | 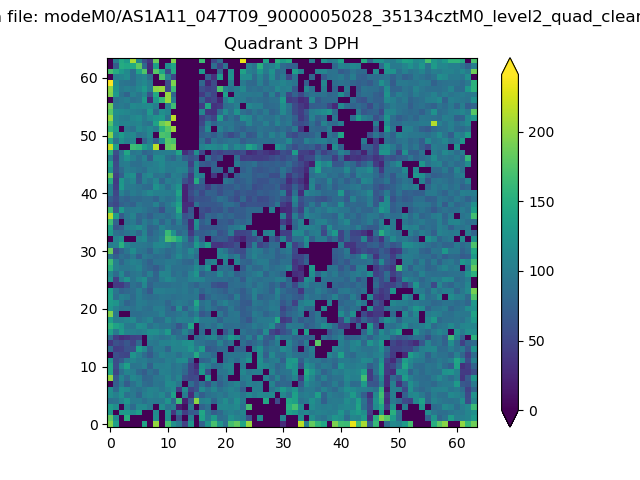 |
 |
Quadrant C |
| Plot type | Count rate plots | Images |
|---|---|---|
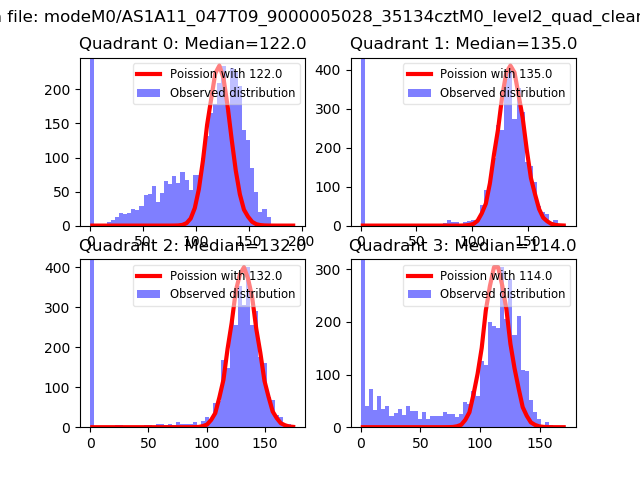
| Comparison with Poisson distribution Blue bars denote a histogram of data divided into 1 sec bins. Red curve is a Poisson curve with rate = median count rate of data. |
 |
 |
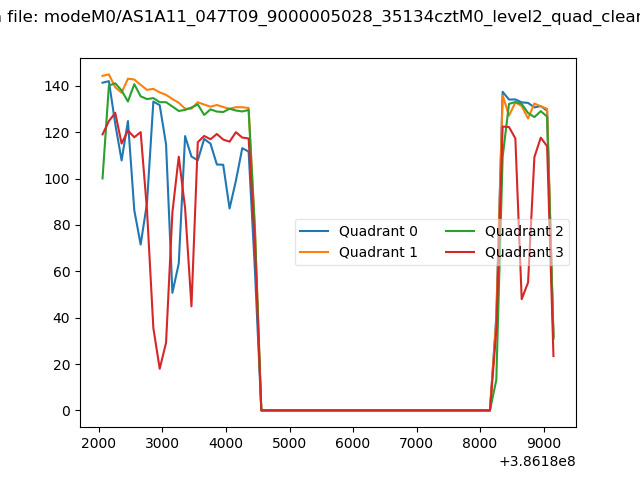
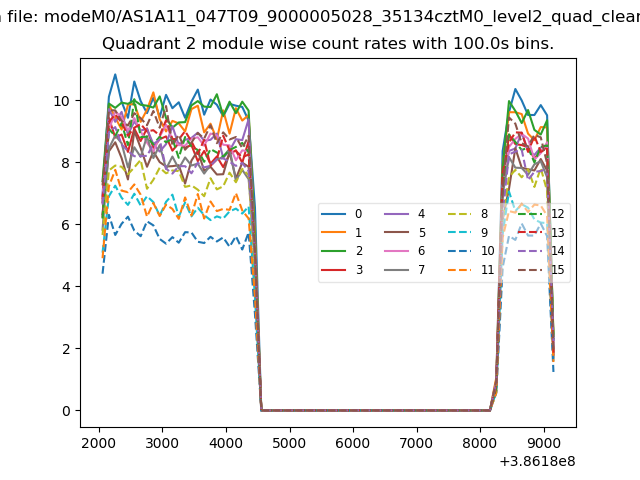
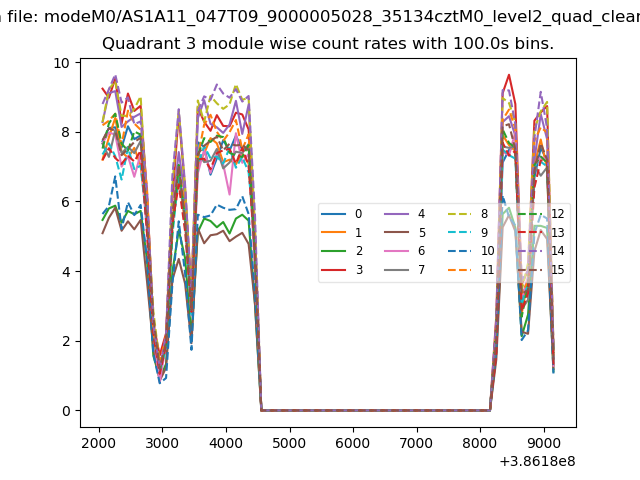
| Quadrant-wise count rates Data is divided into 100 sec bins |
 |
|
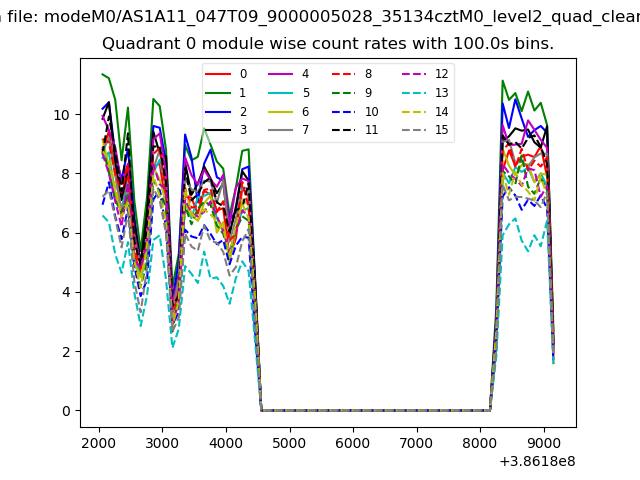
| Module-wise count rates for Quadrant A Data is divided into 100 sec bins |
 |
 |
| Module-wise count rates for Quadrant B Data is divided into 100 sec bins |
 |
 |
| Module-wise count rates for Quadrant C Data is divided into 100 sec bins |
 |
 |
| Module-wise count rates for Quadrant D Data is divided into 100 sec bins |
 |
 |
| Parameter | Plot |
|---|---|
| CZT HV Monitor |  |
| D_VDD | 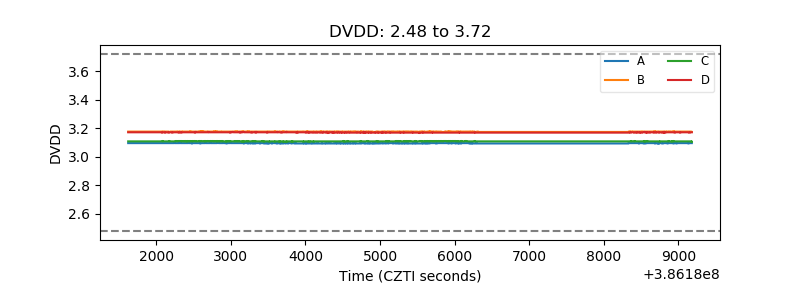 |
| Temperature 1 | 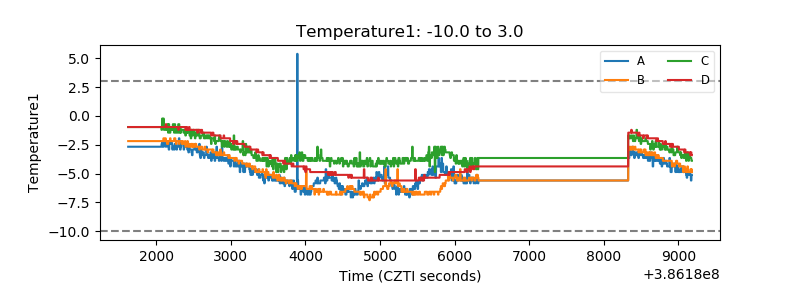 |
| Veto HV Monitor | 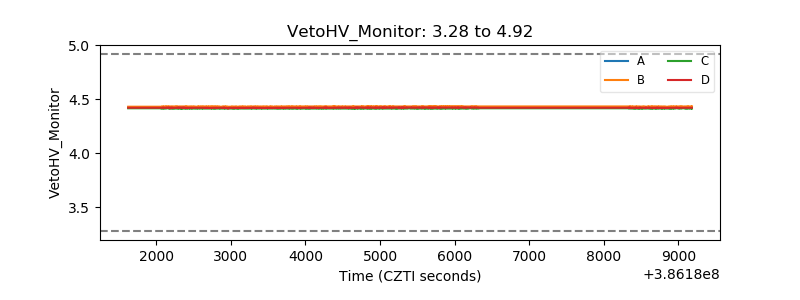 |
| Veto LLD | 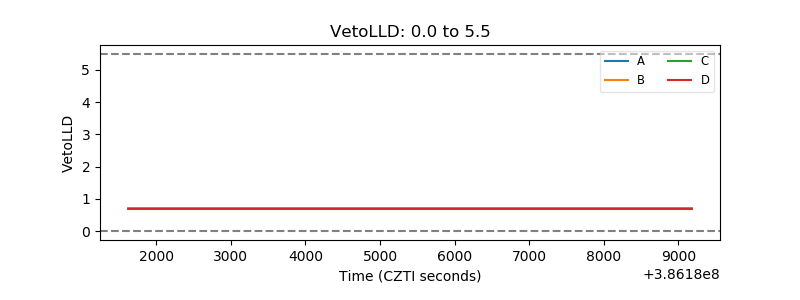 |
| Alpha Counter | 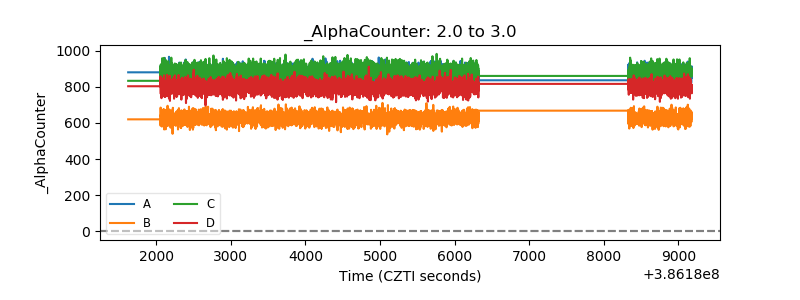 |
| _CPM_Rate | 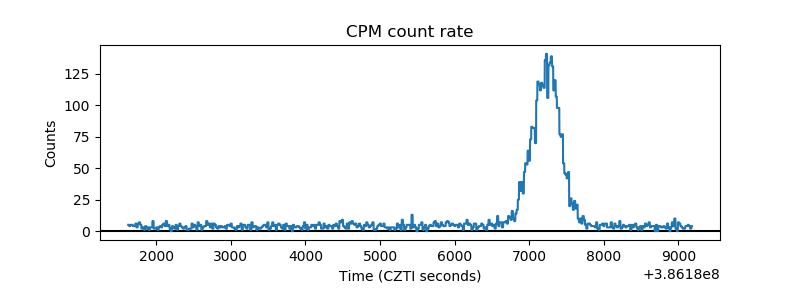 |
| CZT Counter | 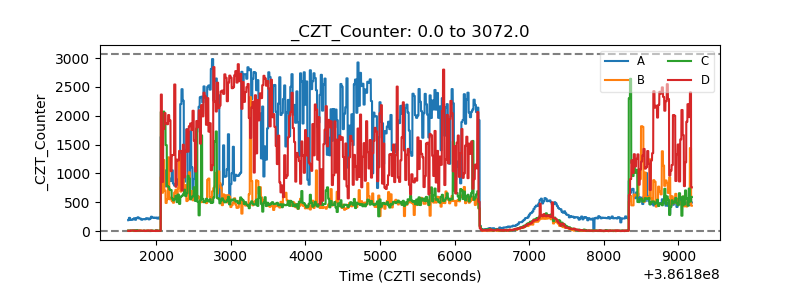 |
| +2.5 Volts monitor | 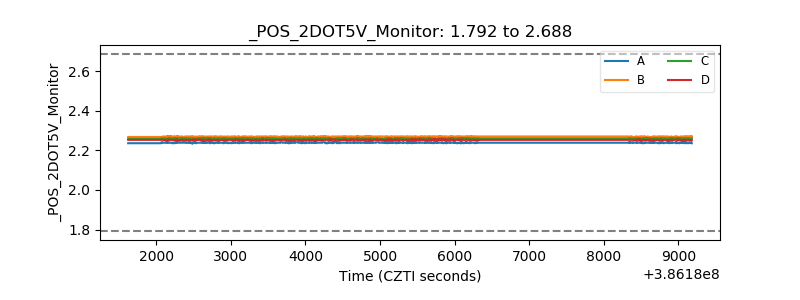 |
| +5 Volts monitor | 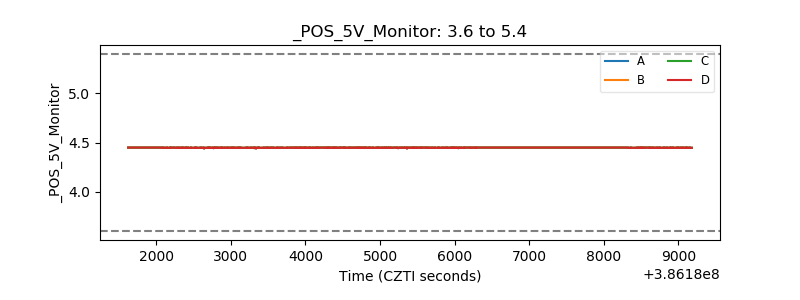 |
| _ROLL_ROT | 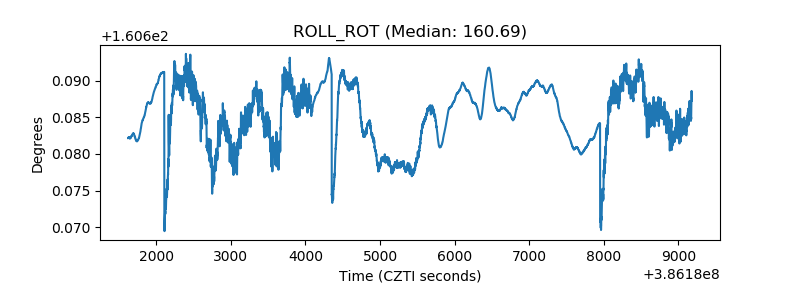 |
| _Roll_DEC | 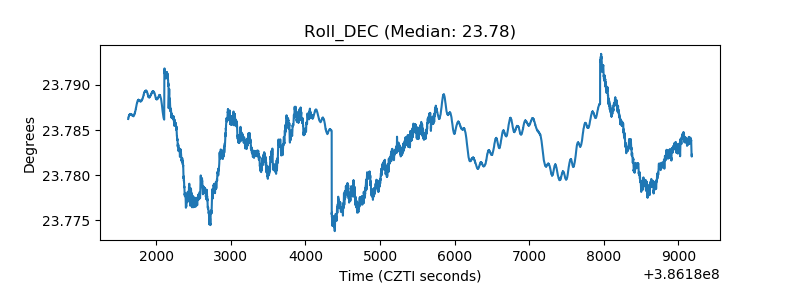 |
| _Roll_RA | 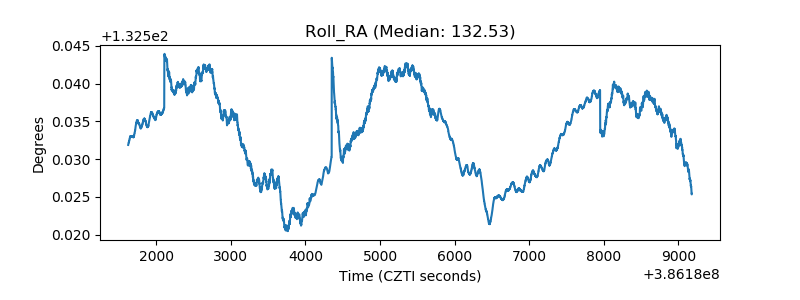 |
| Veto Counter | 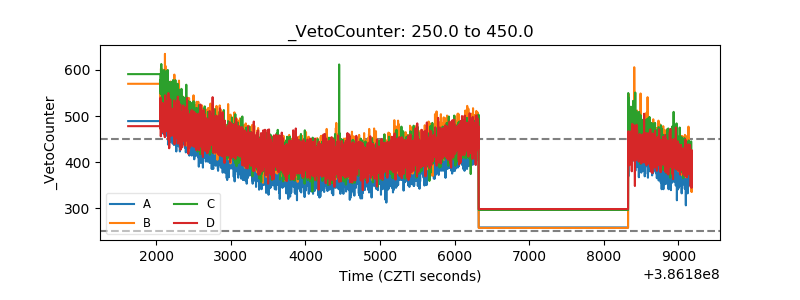 |