| Param | Original file | Final file |
|---|---|---|
| Filename | modeM0/AS1A11_047T09_9000005028_35129cztM0_level2.evt | modeM0/AS1A11_047T09_9000005028_35129cztM0_level2_quad_clean.evt |
| Size (bytes) | 620,890,560 | 74,615,040 |
| Size | 592.1 MB | 71.2 MB |
| Events in quadrant A | 6,289,703 | 440,313 |
| Events in quadrant B | 3,365,026 | 506,466 |
| Events in quadrant C | 3,173,850 | 492,419 |
| Events in quadrant D | 5,618,672 | 450,218 |
| Mode SS | |||
|---|---|---|---|
| Quadrant | BADHDUFLAG | Total packets | Discarded packets |
| A | 0 | 108 | 0 |
| B | 0 | 108 | 0 |
| C | 0 | 108 | 0 |
| D | 0 | 108 | 0 |
| Mode M9 | |||
|---|---|---|---|
| Quadrant | BADHDUFLAG | Total packets | Discarded packets |
| A | 0 | 26 | 0 |
| B | 0 | 26 | 0 |
| C | 0 | 26 | 0 |
| D | 0 | 27 | 0 |
| Mode M0 | |||
|---|---|---|---|
| Quadrant | BADHDUFLAG | Total packets | Discarded packets |
| A | 0 | 22191 | 3 |
| B | 0 | 13430 | 2 |
| C | 0 | 12590 | 2 |
| D | 0 | 20510 | 2 |
| Quadrant | Total seconds | Saturated seconds | Saturation percentage |
|---|---|---|---|
| A | 5275 | 1601 | 30.350711% |
| B | 5275 | 105 | 1.990521% |
| C | 5275 | 107 | 2.028436% |
| D | 5275 | 373 | 7.071090% |
Noise dominated data is calculated using 1-second bins in cleaned event files. If a bin has >2000 counts, and if more than 50% of those come from <1% of pixels, then it is considered to be noise-dominated and hence unusable.
| Quadrant | # 1 sec bins | Bins with >0 counts | Bins with >2000 counts | High rate bins dominated by noise | Noise dominated (total time) | Noise dominated (detector-on time) | Marked lightcurve |
|---|---|---|---|---|---|---|---|
| A | 7098 | 5276 | 1274 | 1274 | 17.95% | 24.15% | 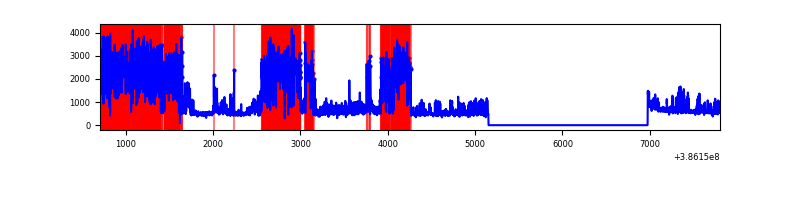 |
| B | 7098 | 5276 | 45 | 45 | 0.63% | 0.85% | 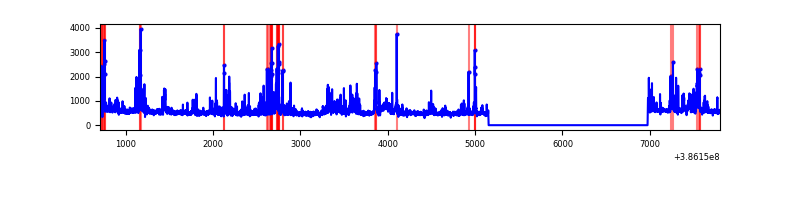 |
| C | 7098 | 5276 | 62 | 62 | 0.87% | 1.18% | 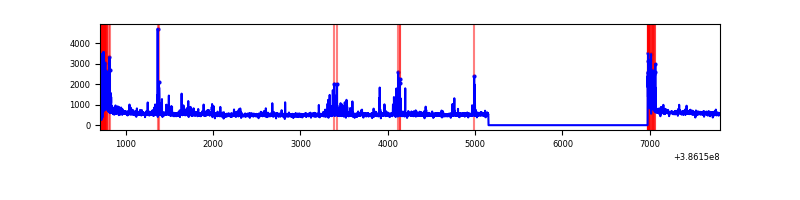 |
| D | 7098 | 5276 | 328 | 328 | 4.62% | 6.22% | 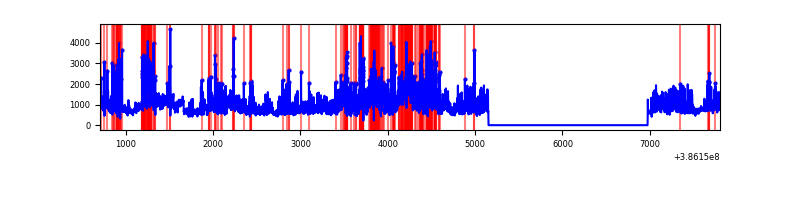 |
Top three noisy pixels from each quadrant. If the there are fewer than three noisy pixels in the level2.evt file, extra rows are filled as -1
| Pixel properties | Quadrant properties | ||||||
|---|---|---|---|---|---|---|---|
| Quadrant | DetID | PixID | Counts | Sigma | Mean | Median | Sigma |
| A | 15 | 169 | 3997582 | 35184.72 | 567 | 557 | 113.6 |
| A | 10 | 83 | 73035 | 638.0 | 567 | 557 | 113.6 |
| A | 12 | 16 | 12091 | 101.53 | 567 | 557 | 113.6 |
| B | 5 | 172 | 458301 | 3597.89 | 663 | 647 | 127.2 |
| B | 0 | 190 | 101323 | 791.47 | 663 | 647 | 127.2 |
| B | 0 | 182 | 68967 | 537.1 | 663 | 647 | 127.2 |
| C | 0 | 10 | 306212 | 2075.59 | 639 | 645 | 147.2 |
| C | 15 | 214 | 226520 | 1534.28 | 639 | 645 | 147.2 |
| C | 0 | 207 | 89688 | 604.83 | 639 | 645 | 147.2 |
| D | 8 | 195 | 1645800 | 10716.52 | 632 | 615 | 153.5 |
| D | 13 | 249 | 382034 | 2484.51 | 632 | 615 | 153.5 |
| D | 7 | 223 | 325335 | 2115.18 | 632 | 615 | 153.5 |
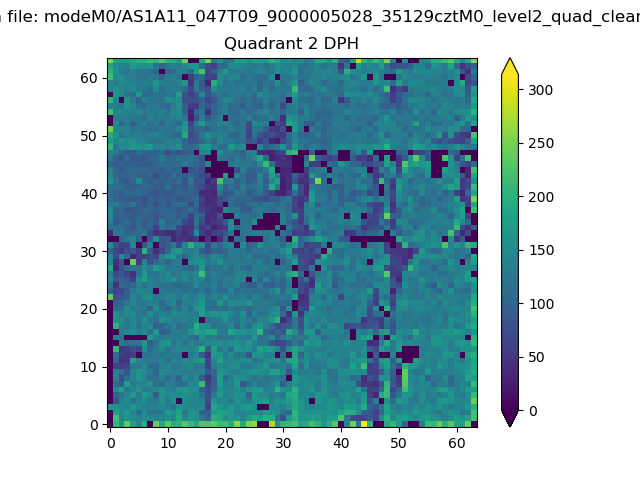
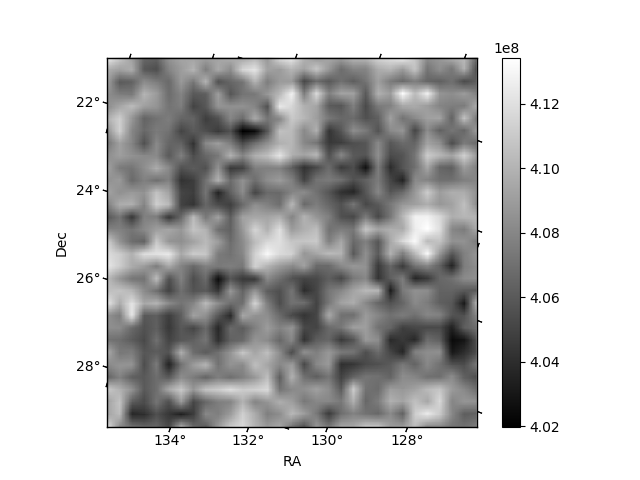
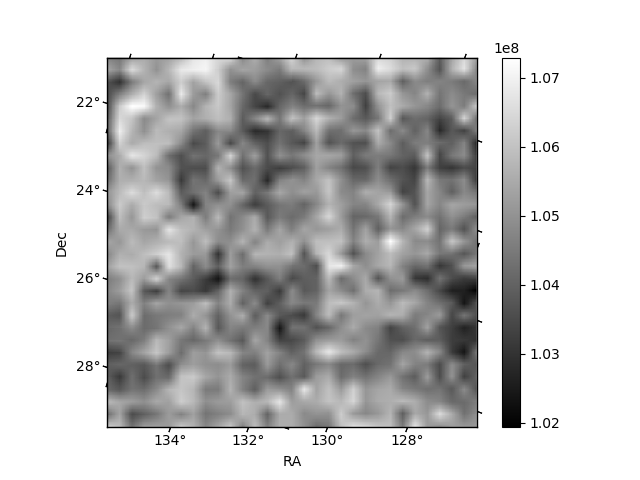
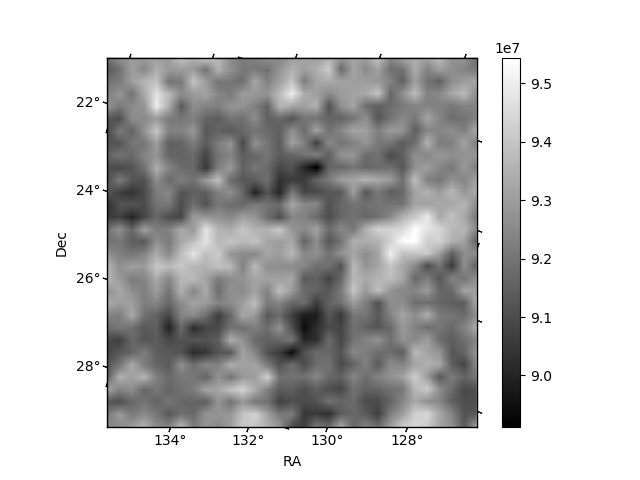
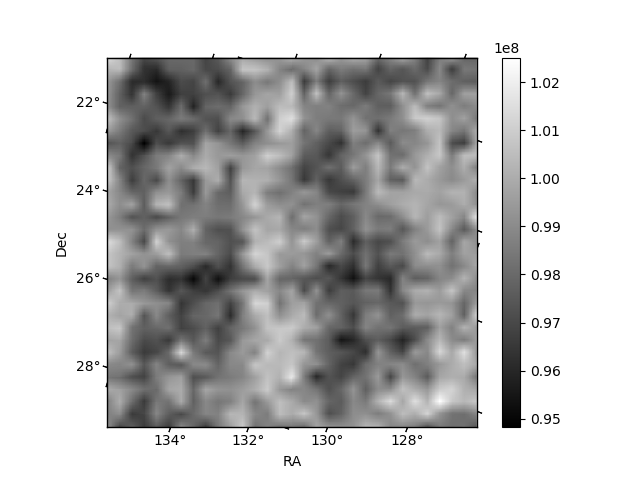
Histogram calculated using DETX and DETY for each event in the final _common_clean file
| Quadrant A | 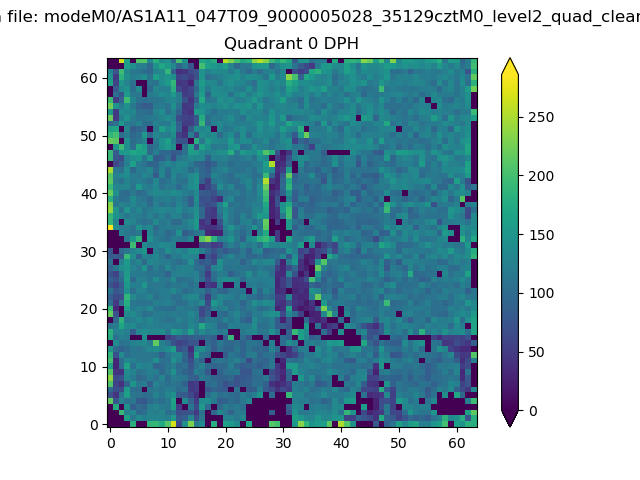 |
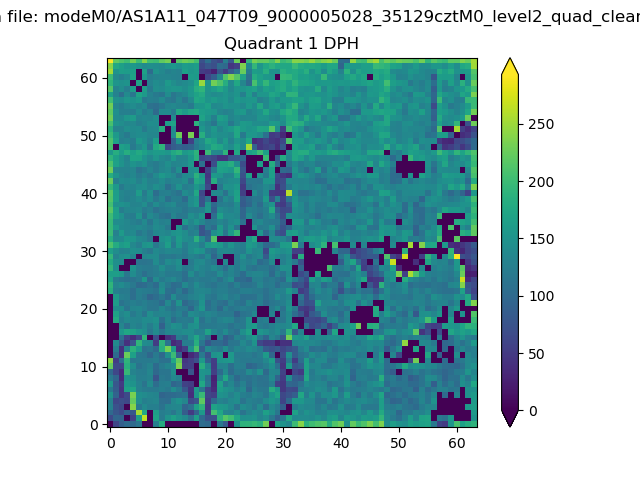 |
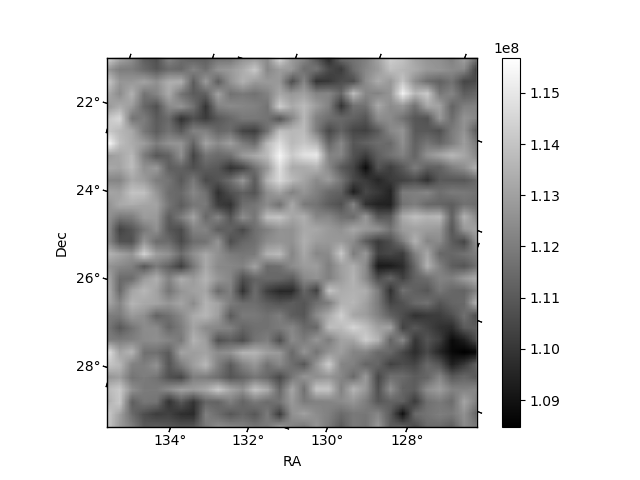
Quadrant B |
|---|---|---|---|
| Quadrant D | 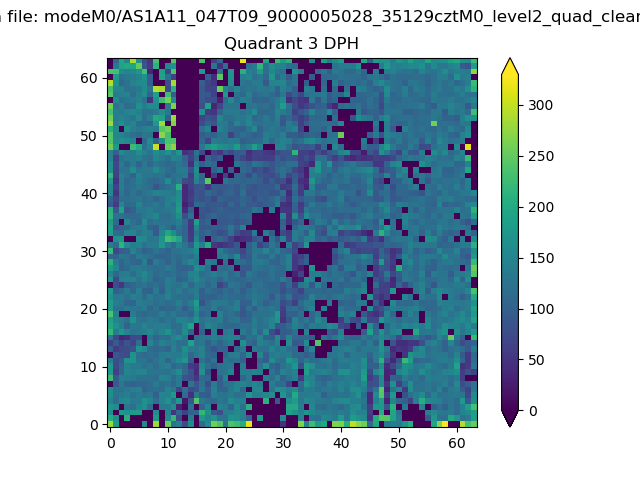 |
 |
Quadrant C |
| Plot type | Count rate plots | Images |
|---|---|---|
| Comparison with Poisson distribution Blue bars denote a histogram of data divided into 1 sec bins. Red curve is a Poisson curve with rate = median count rate of data. |
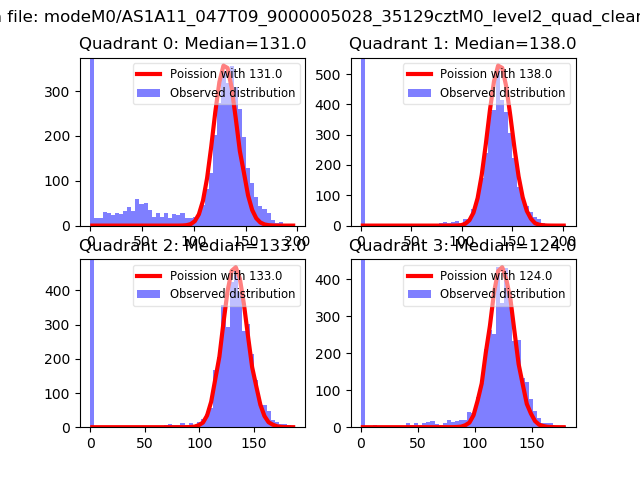 |
 |
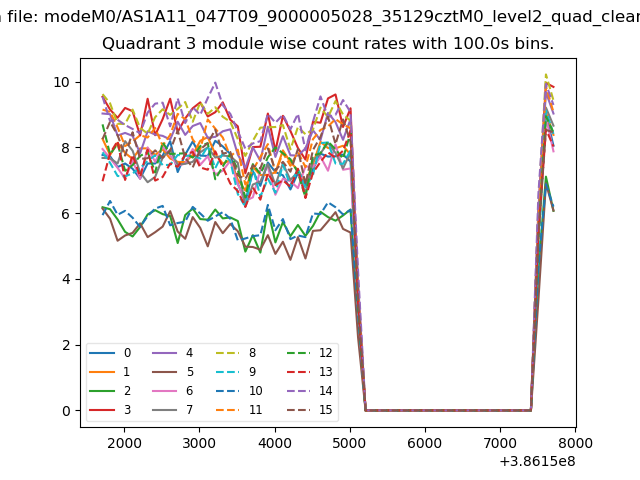
| Quadrant-wise count rates Data is divided into 100 sec bins |
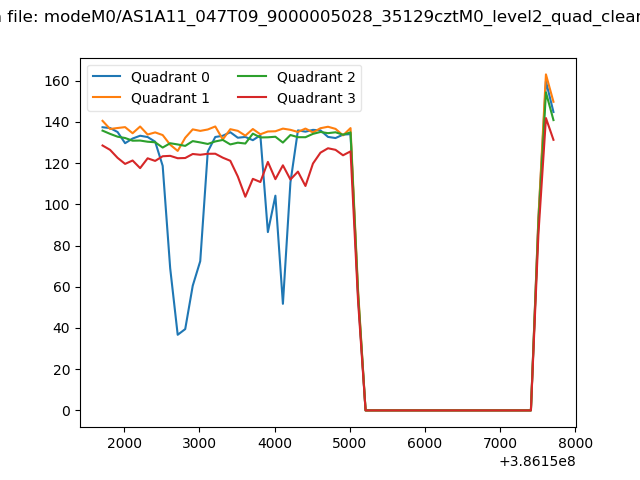 |
|
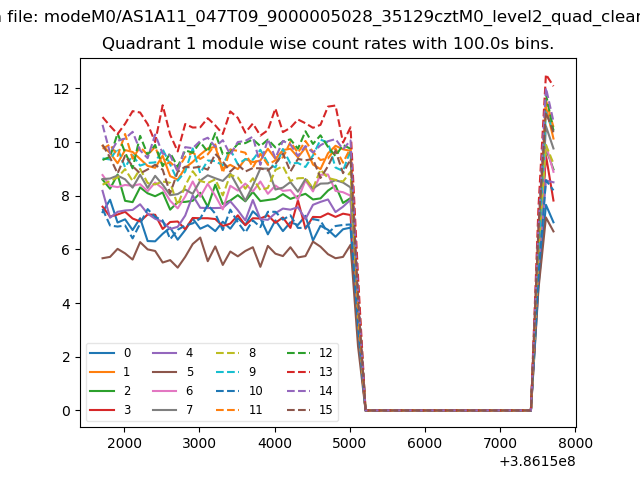
| Module-wise count rates for Quadrant A Data is divided into 100 sec bins |
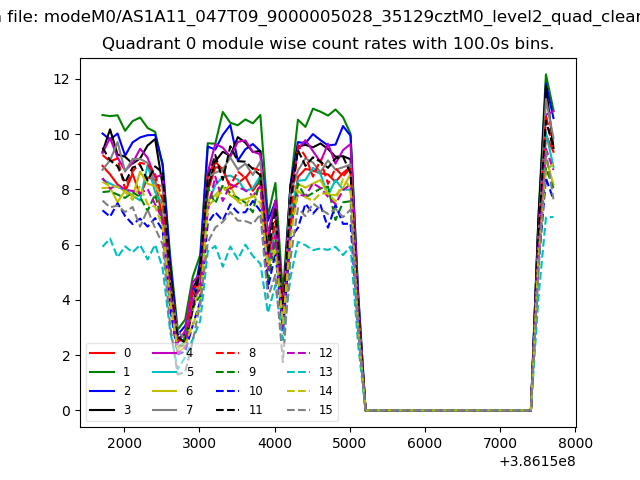 |
 |
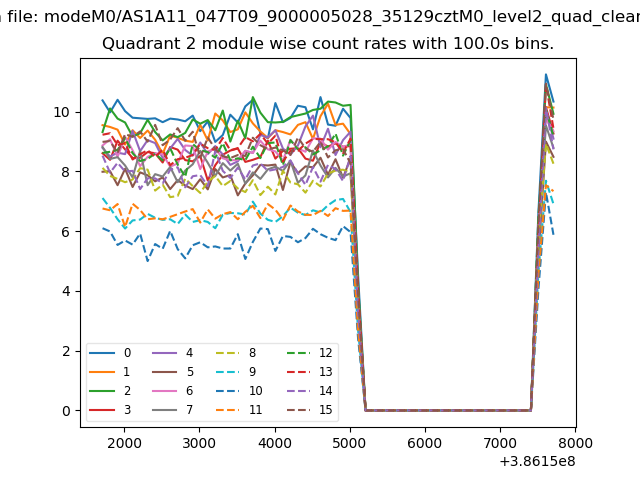
| Module-wise count rates for Quadrant B Data is divided into 100 sec bins |
 |
 |
| Module-wise count rates for Quadrant C Data is divided into 100 sec bins |
 |
 |
| Module-wise count rates for Quadrant D Data is divided into 100 sec bins |
 |
 |
| Parameter | Plot |
|---|---|
| CZT HV Monitor | 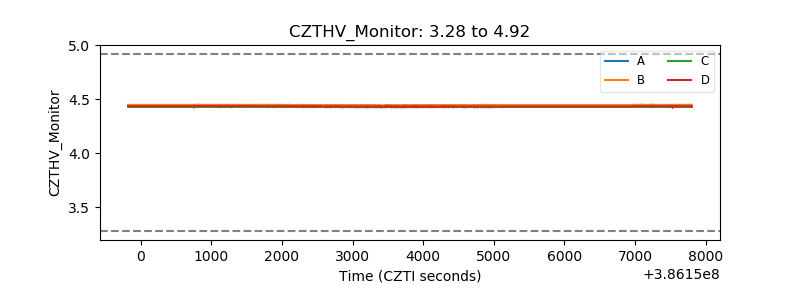 |
| D_VDD | 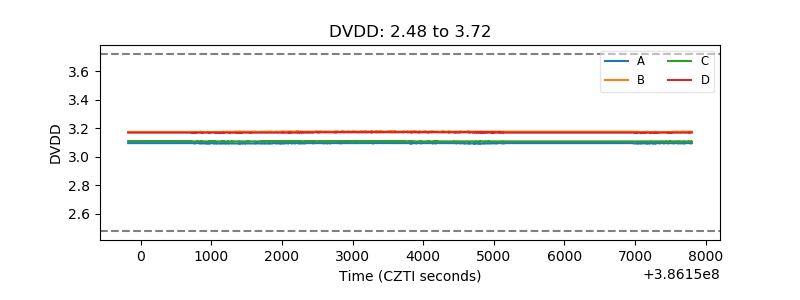 |
| Temperature 1 | 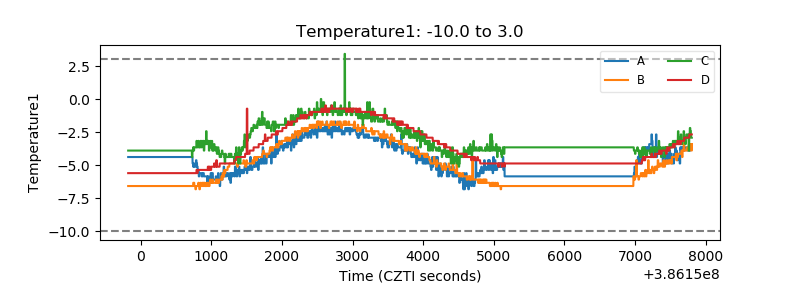 |
| Veto HV Monitor | 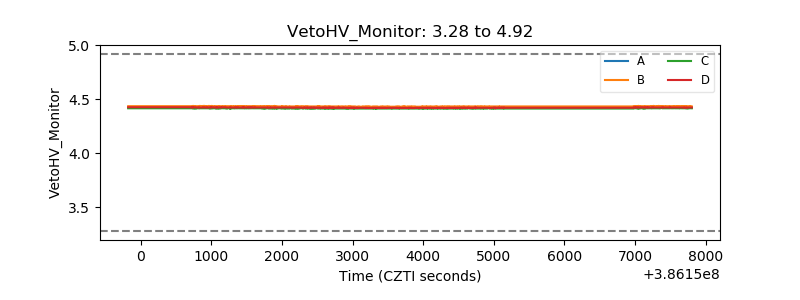 |
| Veto LLD | 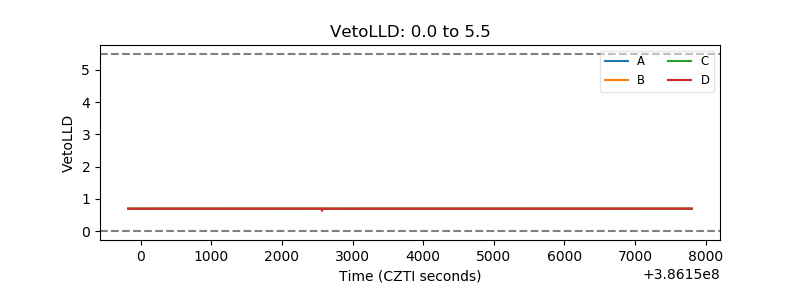 |
| Alpha Counter | 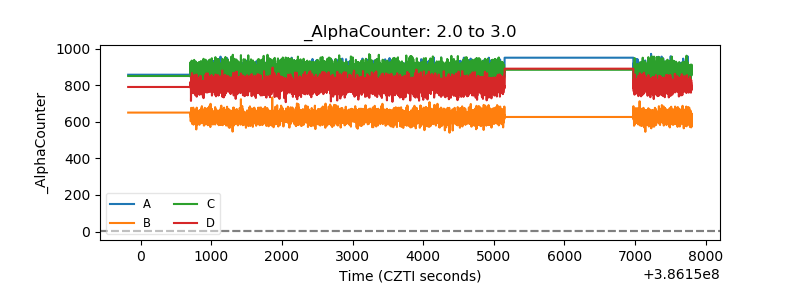 |
| _CPM_Rate | 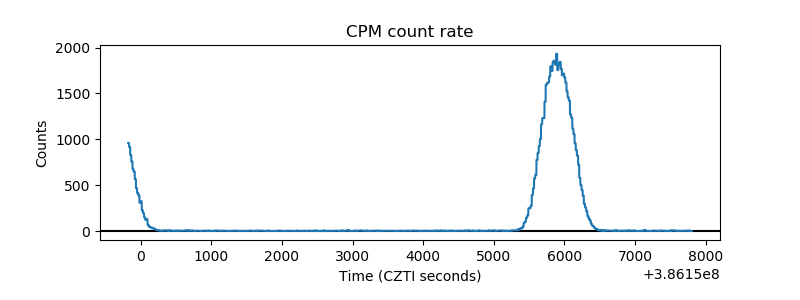 |
| CZT Counter | 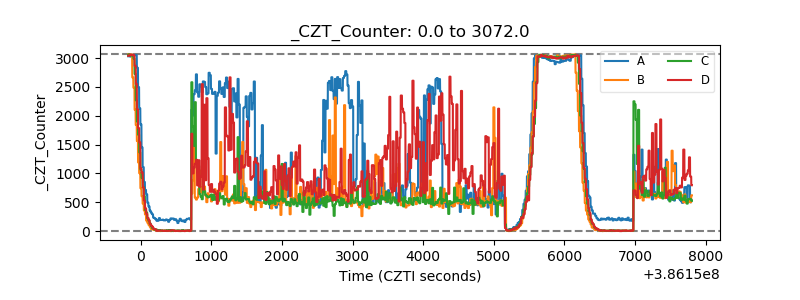 |
| +2.5 Volts monitor | 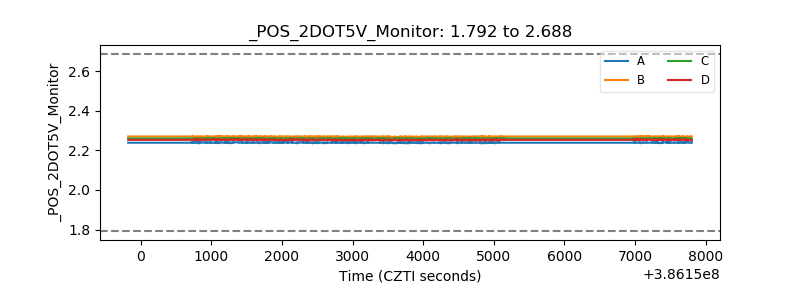 |
| +5 Volts monitor | 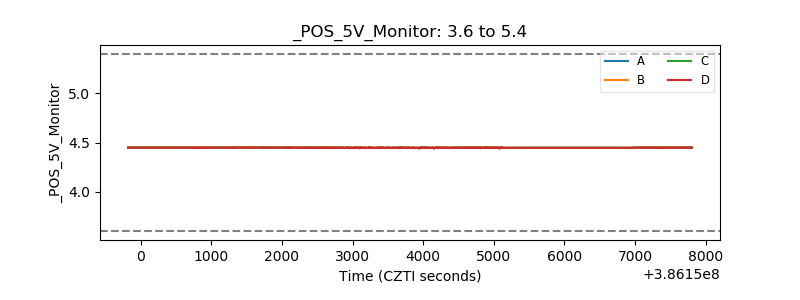 |
| _ROLL_ROT | 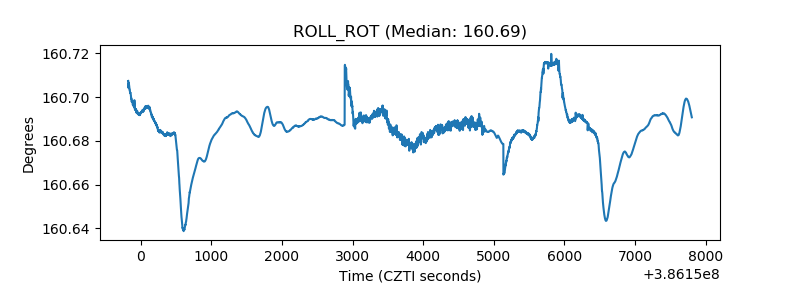 |
| _Roll_DEC | 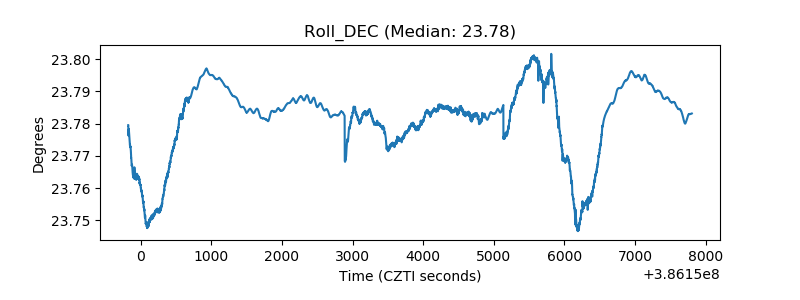 |
| _Roll_RA | 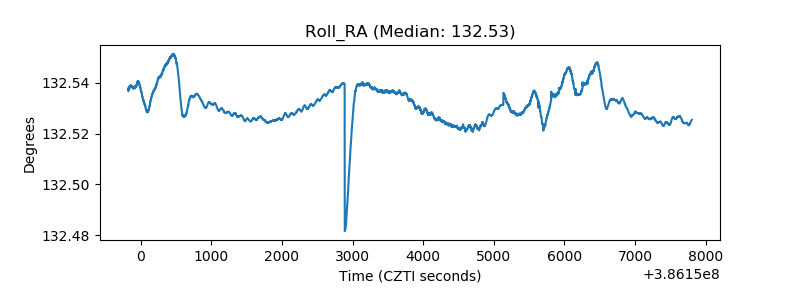 |
| Veto Counter | 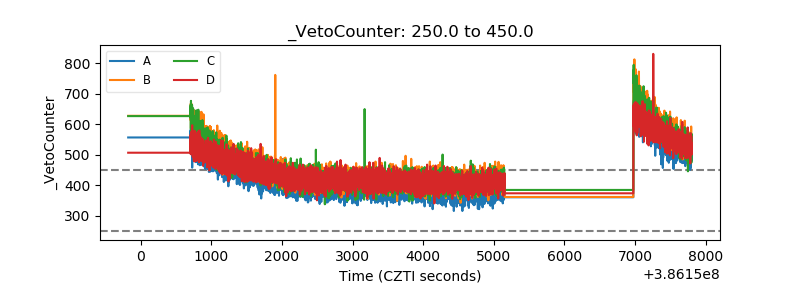 |