| Param | Original file | Final file |
|---|---|---|
| Filename | modeM0/AS1A11_047T09_9000005028_35123cztM0_level2.evt | modeM0/AS1A11_047T09_9000005028_35123cztM0_level2_quad_clean.evt |
| Size (bytes) | 657,938,880 | 64,293,120 |
| Size | 627.5 MB | 61.3 MB |
| Events in quadrant A | 6,317,681 | 333,268 |
| Events in quadrant B | 3,337,278 | 409,714 |
| Events in quadrant C | 3,272,888 | 409,420 |
| Events in quadrant D | 6,589,258 | 371,005 |
| Mode SS | |||
|---|---|---|---|
| Quadrant | BADHDUFLAG | Total packets | Discarded packets |
| A | 0 | 122 | 0 |
| B | 0 | 122 | 0 |
| C | 0 | 122 | 0 |
| D | 0 | 122 | 0 |
| Mode M9 | |||
|---|---|---|---|
| Quadrant | BADHDUFLAG | Total packets | Discarded packets |
| A | 0 | 24 | 0 |
| B | 0 | 24 | 0 |
| C | 0 | 24 | 0 |
| D | 0 | 25 | 0 |
| Mode M0 | |||
|---|---|---|---|
| Quadrant | BADHDUFLAG | Total packets | Discarded packets |
| A | 0 | 22805 | 3 |
| B | 0 | 13881 | 2 |
| C | 0 | 13282 | 2 |
| D | 0 | 23806 | 2 |
| Quadrant | Total seconds | Saturated seconds | Saturation percentage |
|---|---|---|---|
| A | 6054 | 1158 | 19.127849% |
| B | 6054 | 98 | 1.618764% |
| C | 6054 | 35 | 0.578130% |
| D | 6054 | 571 | 9.431781% |
Noise dominated data is calculated using 1-second bins in cleaned event files. If a bin has >2000 counts, and if more than 50% of those come from <1% of pixels, then it is considered to be noise-dominated and hence unusable.
| Quadrant | # 1 sec bins | Bins with >0 counts | Bins with >2000 counts | High rate bins dominated by noise | Noise dominated (total time) | Noise dominated (detector-on time) | Marked lightcurve |
|---|---|---|---|---|---|---|---|
| A | 7336 | 6055 | 863 | 863 | 11.76% | 14.25% | 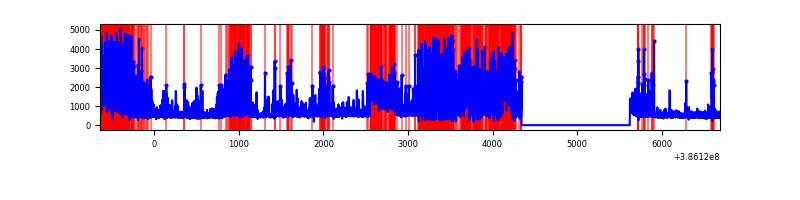 |
| B | 7336 | 6055 | 43 | 43 | 0.59% | 0.71% | 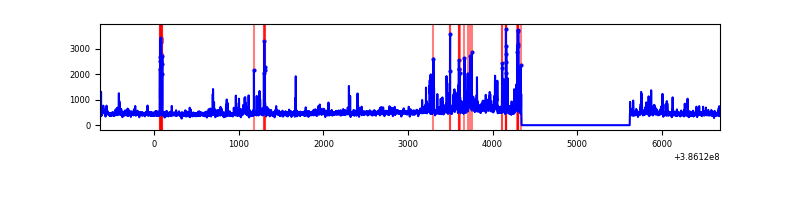 |
| C | 7336 | 6055 | 21 | 21 | 0.29% | 0.35% | 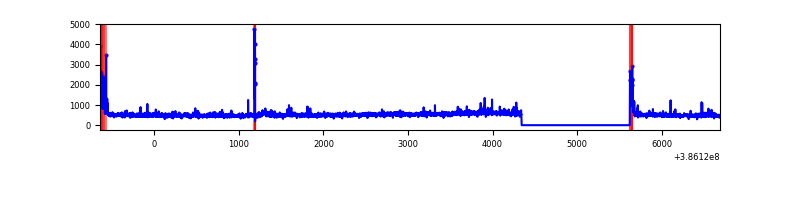 |
| D | 7336 | 6055 | 483 | 483 | 6.58% | 7.98% | 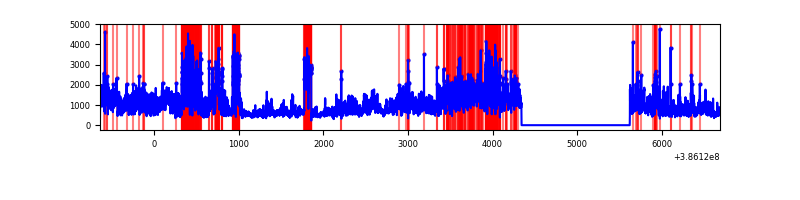 |
Top three noisy pixels from each quadrant. If the there are fewer than three noisy pixels in the level2.evt file, extra rows are filled as -1
| Pixel properties | Quadrant properties | ||||||
|---|---|---|---|---|---|---|---|
| Quadrant | DetID | PixID | Counts | Sigma | Mean | Median | Sigma |
| A | 15 | 169 | 3746737 | 28801.55 | 639 | 625 | 130.1 |
| A | 10 | 83 | 81029 | 618.18 | 639 | 625 | 130.1 |
| A | 13 | 6 | 14939 | 110.05 | 639 | 625 | 130.1 |
| B | 5 | 172 | 258310 | 1887.38 | 699 | 682 | 136.5 |
| B | 0 | 189 | 128649 | 937.48 | 699 | 682 | 136.5 |
| B | 5 | 255 | 75945 | 551.37 | 699 | 682 | 136.5 |
| C | 15 | 214 | 256684 | 1588.13 | 688 | 692 | 161.2 |
| C | 0 | 10 | 165763 | 1024.07 | 688 | 692 | 161.2 |
| C | 14 | 67 | 91161 | 561.25 | 688 | 692 | 161.2 |
| D | 8 | 195 | 2675679 | 16478.31 | 661 | 642 | 162.3 |
| D | 2 | 250 | 812289 | 4999.77 | 661 | 642 | 162.3 |
| D | 13 | 249 | 296570 | 1822.93 | 661 | 642 | 162.3 |
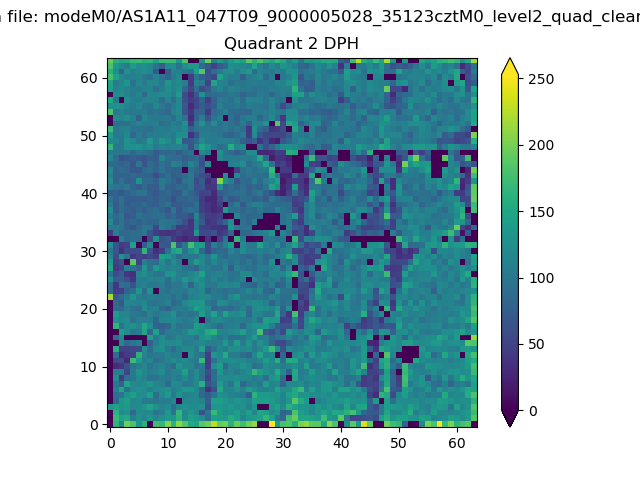
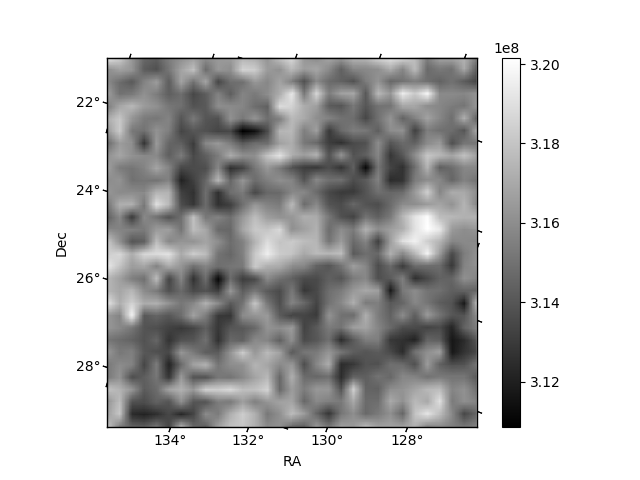
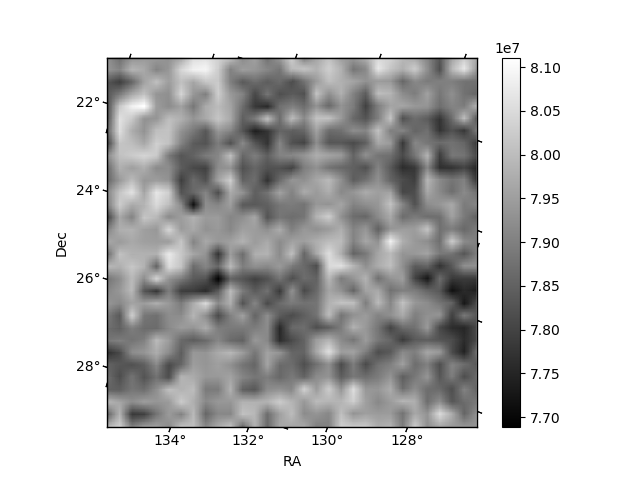
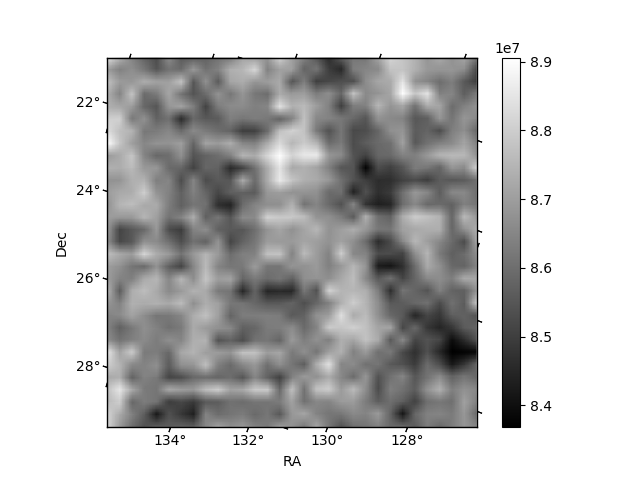
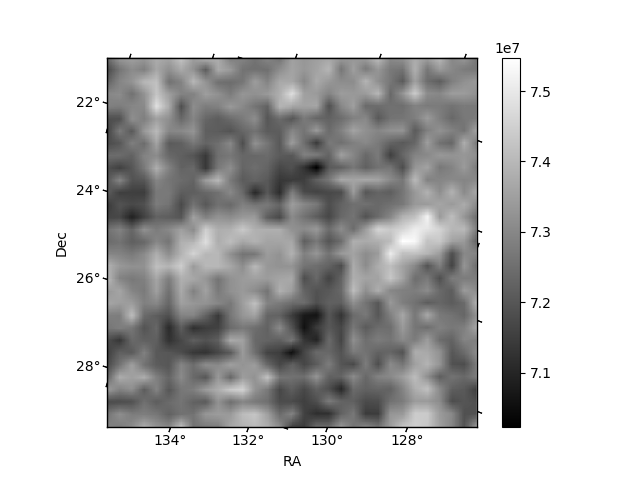
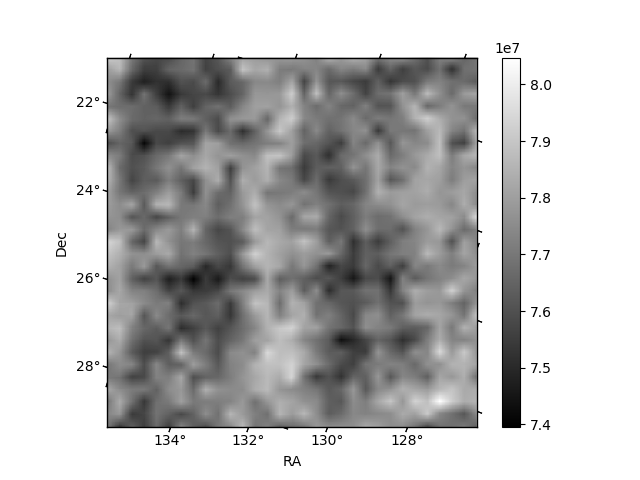
Histogram calculated using DETX and DETY for each event in the final _common_clean file
| Quadrant A | 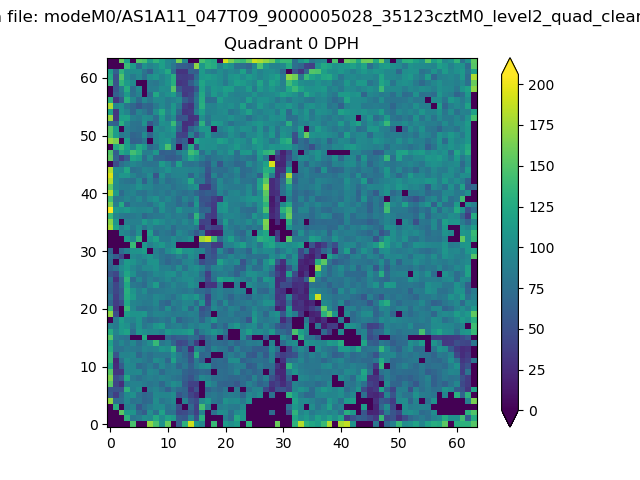 |
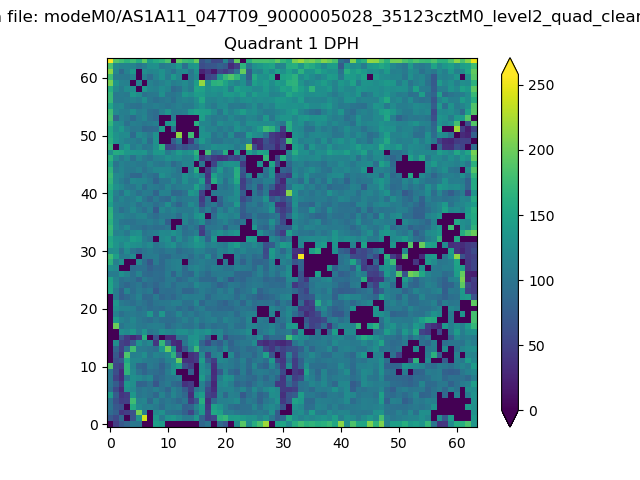 |
Quadrant B |
|---|---|---|---|
| Quadrant D | 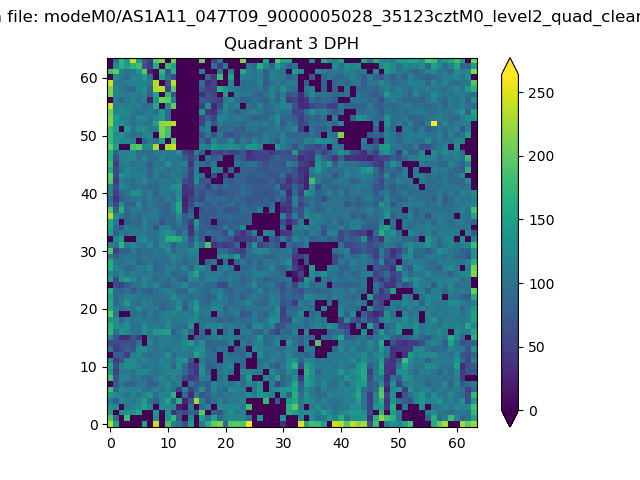 |
 |
Quadrant C |
| Plot type | Count rate plots | Images |
|---|---|---|
| Comparison with Poisson distribution Blue bars denote a histogram of data divided into 1 sec bins. Red curve is a Poisson curve with rate = median count rate of data. |
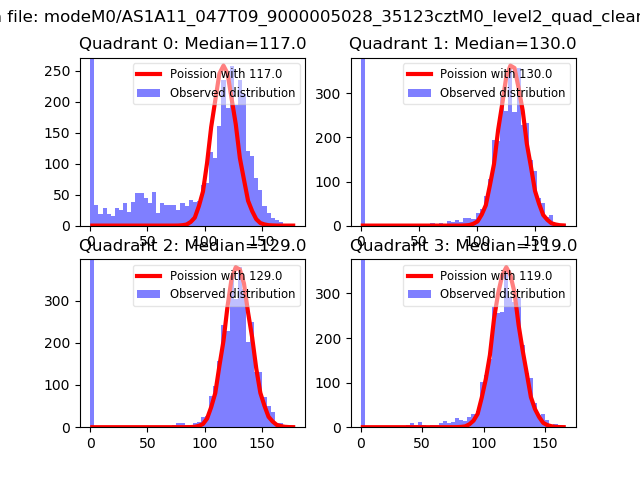 |
 |
| Quadrant-wise count rates Data is divided into 100 sec bins |
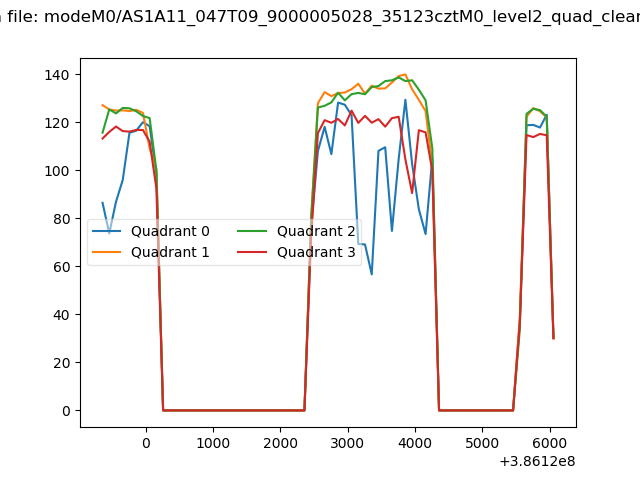 |
|
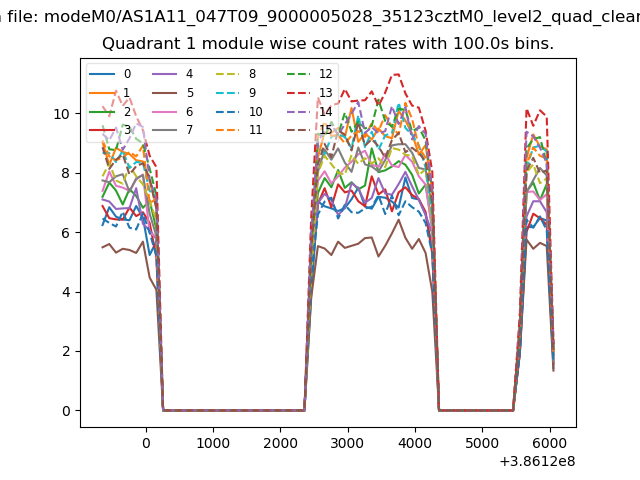
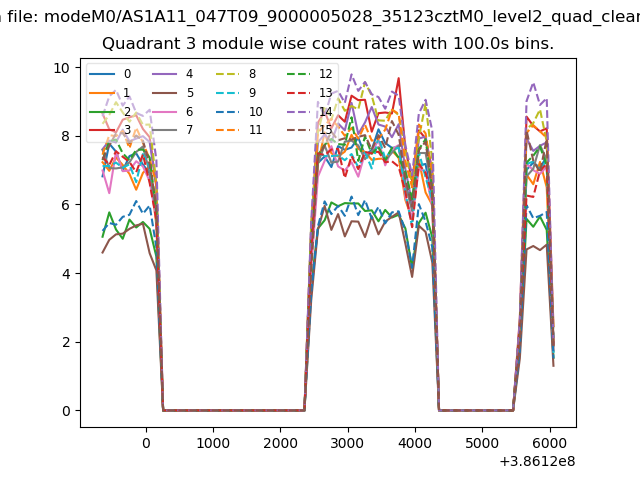
| Module-wise count rates for Quadrant A Data is divided into 100 sec bins |
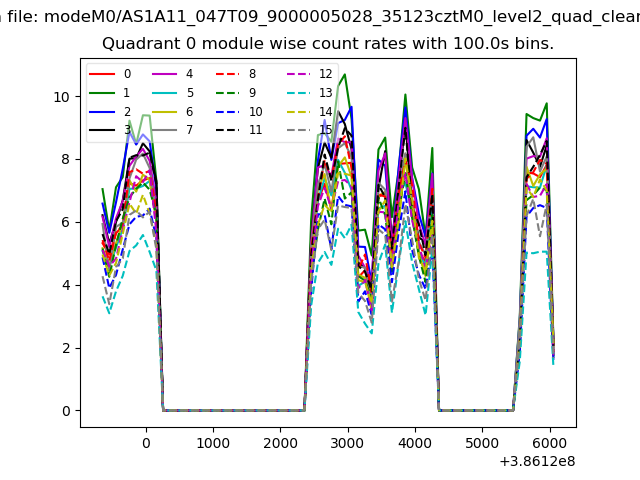 |
 |
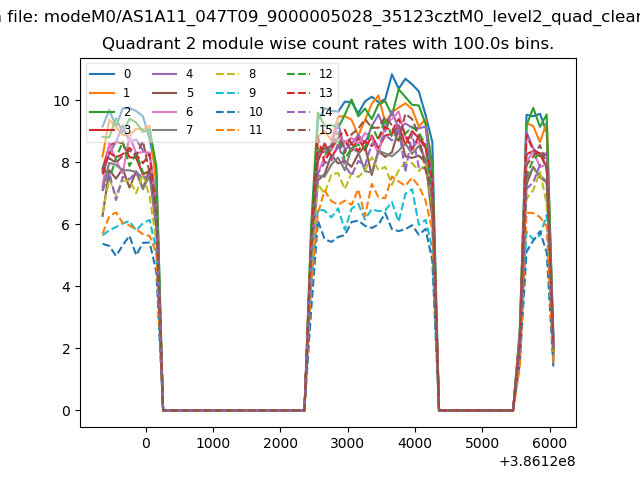
| Module-wise count rates for Quadrant B Data is divided into 100 sec bins |
 |
 |
| Module-wise count rates for Quadrant C Data is divided into 100 sec bins |
 |
 |
| Module-wise count rates for Quadrant D Data is divided into 100 sec bins |
 |
 |
| Parameter | Plot |
|---|---|
| CZT HV Monitor |  |
| D_VDD | 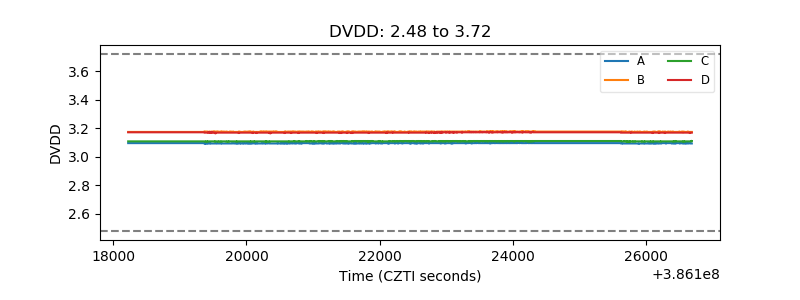 |
| Temperature 1 | 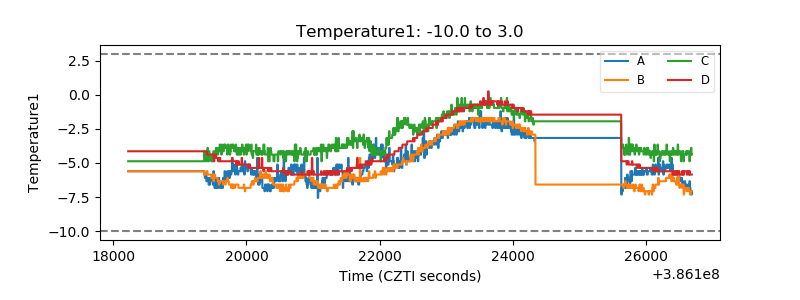 |
| Veto HV Monitor | 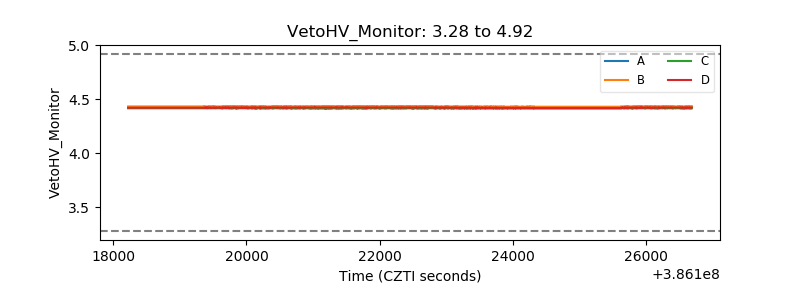 |
| Veto LLD | 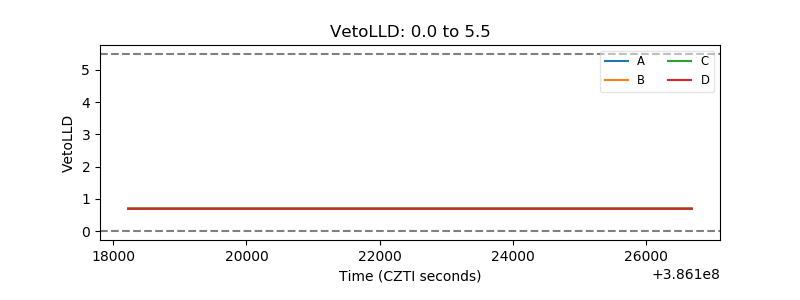 |
| Alpha Counter | 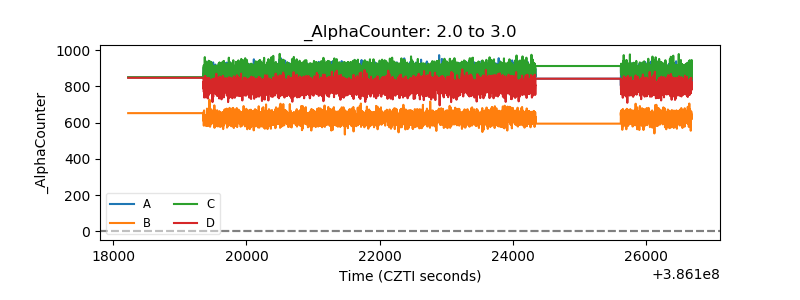 |
| _CPM_Rate | 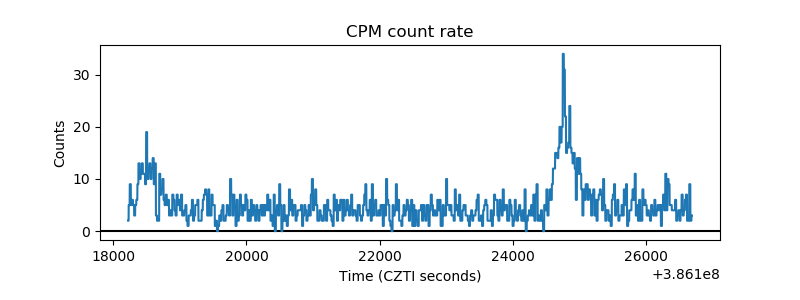 |
| CZT Counter | 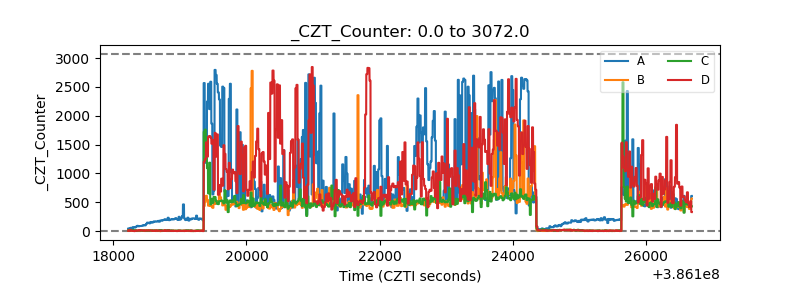 |
| +2.5 Volts monitor | 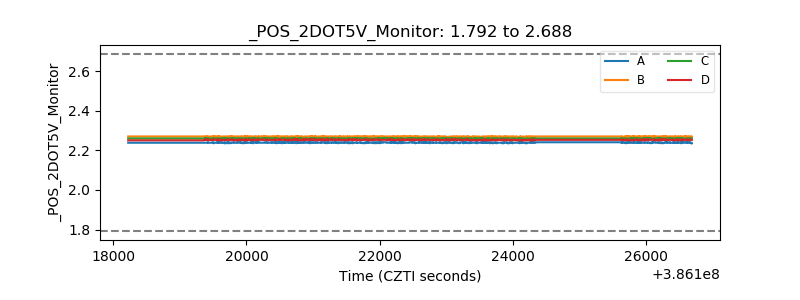 |
| +5 Volts monitor | 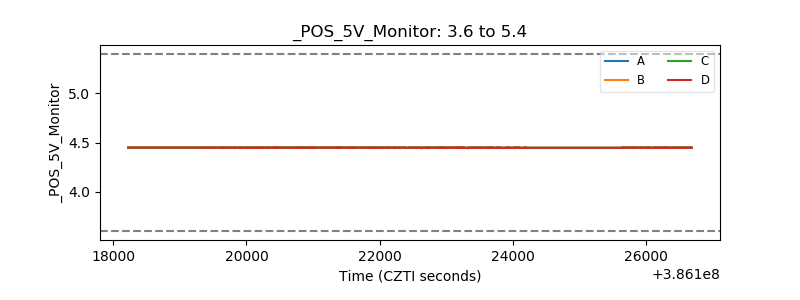 |
| _ROLL_ROT | 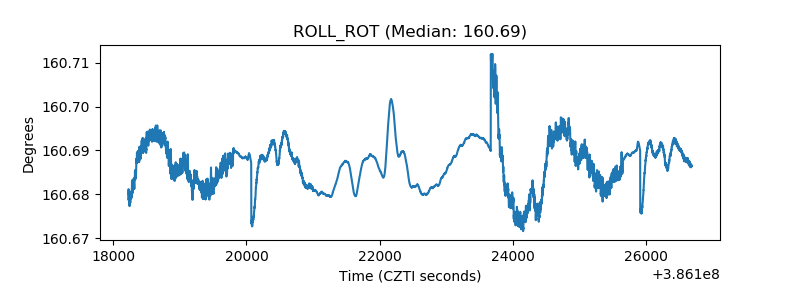 |
| _Roll_DEC | 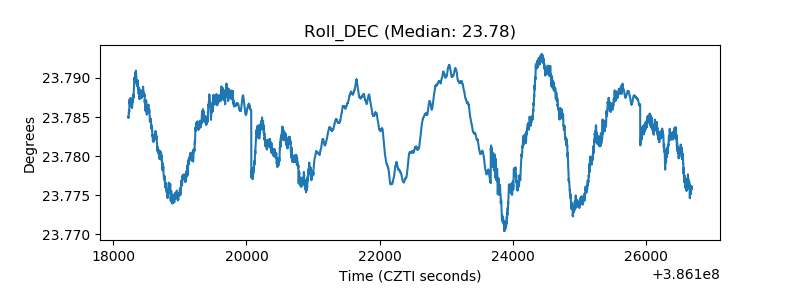 |
| _Roll_RA | 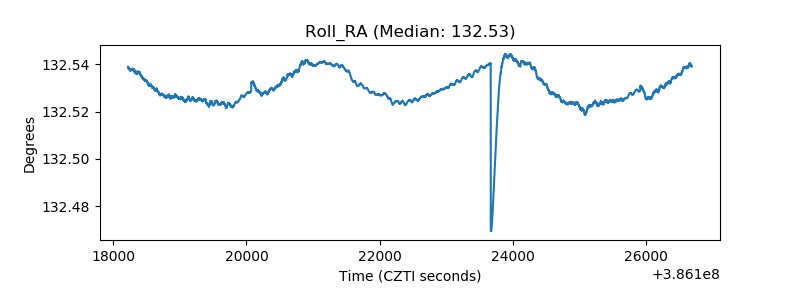 |
| Veto Counter | 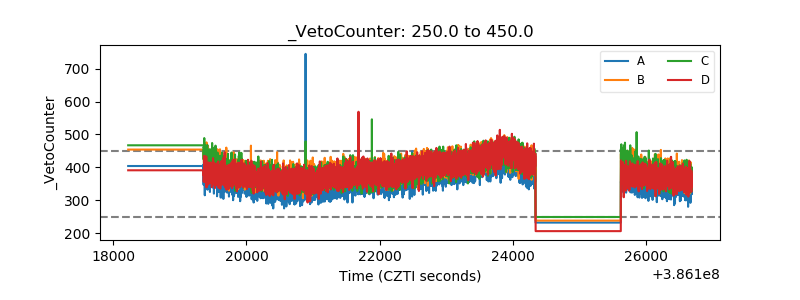 |