| Param | Original file | Final file |
|---|---|---|
| Filename | modeM0/AS1A11_047T09_9000005028cztM0_level2_bc.evt | modeM0/AS1A11_047T09_9000005028cztM0_level2_quad_clean.evt |
| Size (bytes) | 5,346,918,720 | 970,632,000 |
| Size | 5.0 GB | 925.7 MB |
| Events in quadrant A | 45,620,049 | 5,451,269 |
| Events in quadrant B | 24,877,601 | 6,453,587 |
| Events in quadrant C | 23,315,947 | 6,361,846 |
| Events in quadrant D | 62,707,643 | 5,658,010 |
| Mode SS | |||
|---|---|---|---|
| Quadrant | BADHDUFLAG | Total packets | Discarded packets |
| A | 0 | 1628 | 0 |
| B | 0 | 1628 | 0 |
| C | 0 | 1628 | 0 |
| D | 0 | 1628 | 0 |
| Mode M9 | |||
|---|---|---|---|
| Quadrant | BADHDUFLAG | Total packets | Discarded packets |
| A | 0 | 283 | 0 |
| B | 0 | 283 | 0 |
| C | 0 | 283 | 0 |
| D | 0 | 284 | 0 |
| Mode M0 | |||
|---|---|---|---|
| Quadrant | BADHDUFLAG | Total packets | Discarded packets |
| A | 0 | 315253 | 0 |
| B | 0 | 194511 | 0 |
| C | 0 | 178444 | 0 |
| D | 0 | 320522 | 0 |
| Quadrant | Total seconds | Saturated seconds | Saturation percentage |
|---|---|---|---|
| A | 79709 | 20441 | 25.644532% |
| B | 79709 | 2097 | 2.630820% |
| C | 79709 | 829 | 1.040033% |
| D | 79709 | 8249 | 10.348894% |
Noise dominated data is calculated using 1-second bins in cleaned event files. If a bin has >2000 counts, and if more than 50% of those come from <1% of pixels, then it is considered to be noise-dominated and hence unusable.
| Quadrant | # 1 sec bins | Bins with >0 counts | Bins with >2000 counts | High rate bins dominated by noise | Noise dominated (total time) | Noise dominated (detector-on time) | Marked lightcurve |
|---|---|---|---|---|---|---|---|
| A | 112587 | 79724 | 1756 | 1756 | 1.56% | 2.20% | 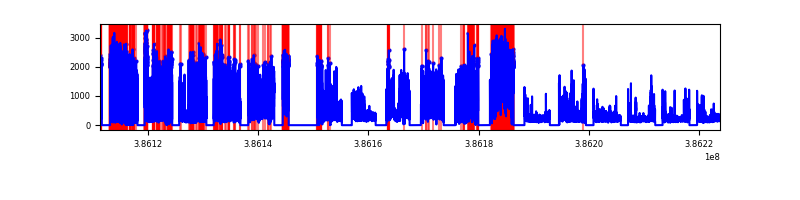 |
| B | 112587 | 79709 | 232 | 232 | 0.21% | 0.29% | 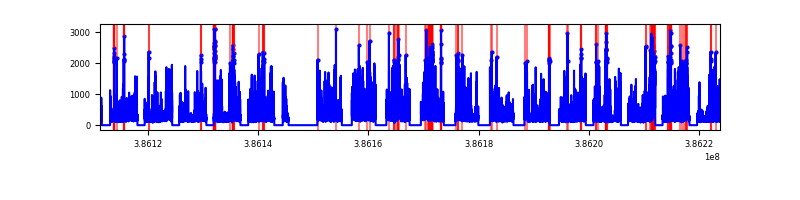 |
| C | 112587 | 79710 | 116 | 116 | 0.10% | 0.15% | 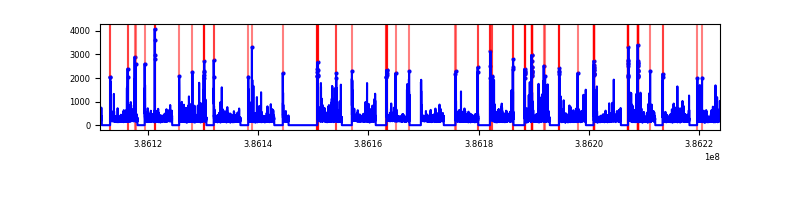 |
| D | 112587 | 79708 | 1484 | 1484 | 1.32% | 1.86% | 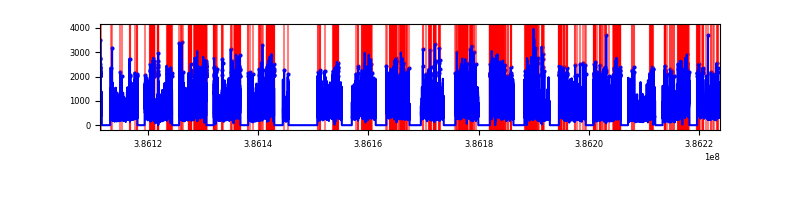 |
Top three noisy pixels from each quadrant. If the there are fewer than three noisy pixels in the level2.evt file, extra rows are filled as -1
| Pixel properties | Quadrant properties | ||||||
|---|---|---|---|---|---|---|---|
| Quadrant | DetID | PixID | Counts | Sigma | Mean | Median | Sigma |
| A | 15 | 169 | 30453763 | 38249.05 | 3615 | 3567 | 796.1 |
| A | 10 | 83 | 801828 | 1002.71 | 3615 | 3567 | 796.1 |
| A | 13 | 6 | 171852 | 211.39 | 3615 | 3567 | 796.1 |
| B | 5 | 172 | 4310342 | 5249.44 | 4190 | 4106 | 820.3 |
| B | 5 | 236 | 1236703 | 1502.58 | 4190 | 4106 | 820.3 |
| B | 0 | 190 | 858998 | 1042.14 | 4190 | 4106 | 820.3 |
| C | 15 | 214 | 3153399 | 3398.43 | 4095 | 4077 | 926.7 |
| C | 0 | 10 | 2099843 | 2261.54 | 4095 | 4077 | 926.7 |
| C | 14 | 67 | 915457 | 983.47 | 4095 | 4077 | 926.7 |
| D | 8 | 195 | 31039309 | 32273.79 | 3992 | 3866 | 961.6 |
| D | 2 | 250 | 3292460 | 3419.81 | 3992 | 3866 | 961.6 |
| D | 13 | 249 | 1760365 | 1826.58 | 3992 | 3866 | 961.6 |
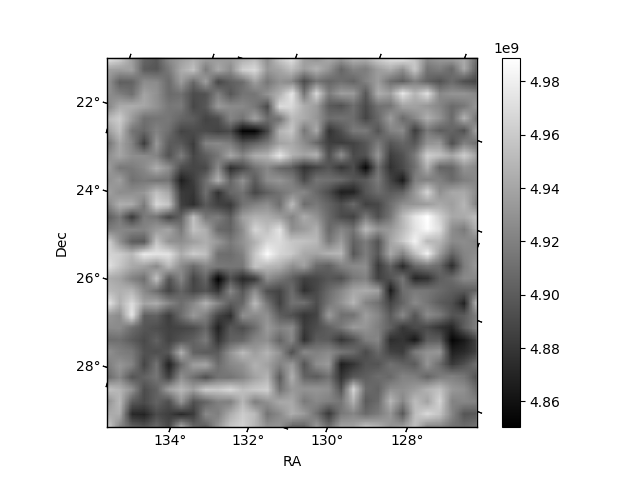
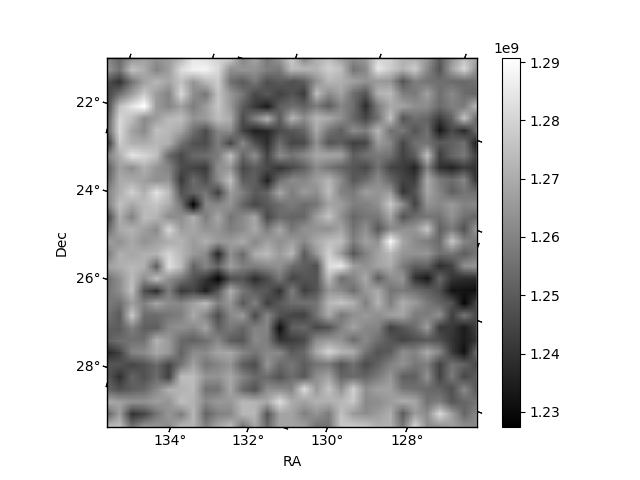
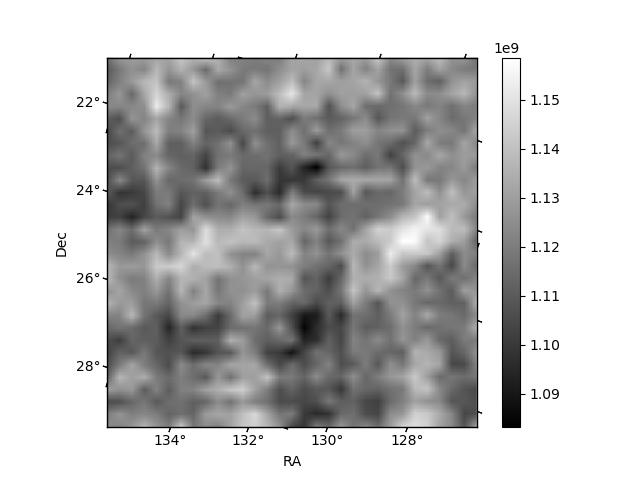
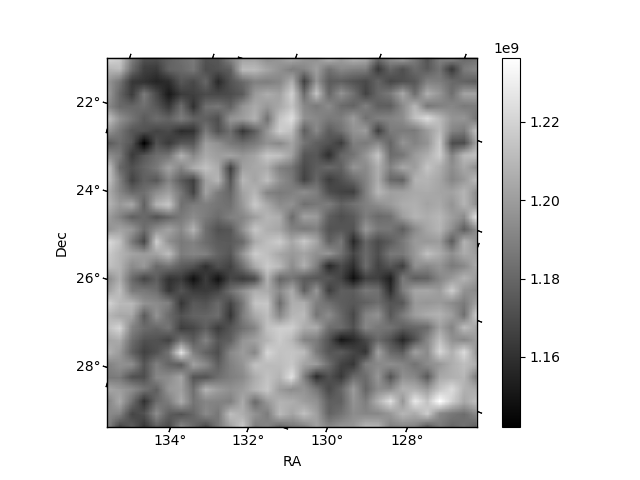
Histogram calculated using DETX and DETY for each event in the final _common_clean file
| Quadrant A | 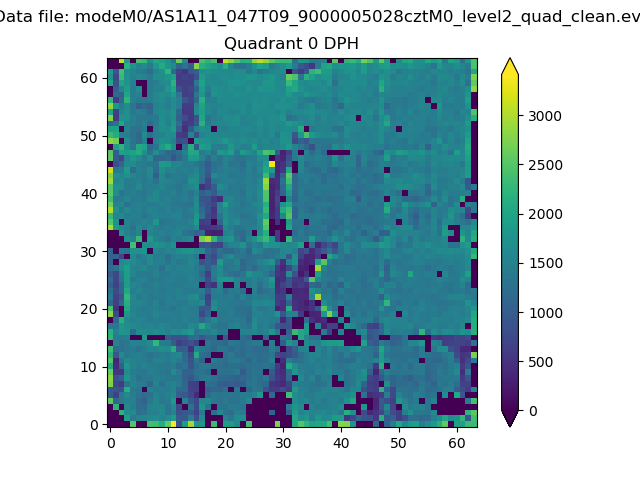 |
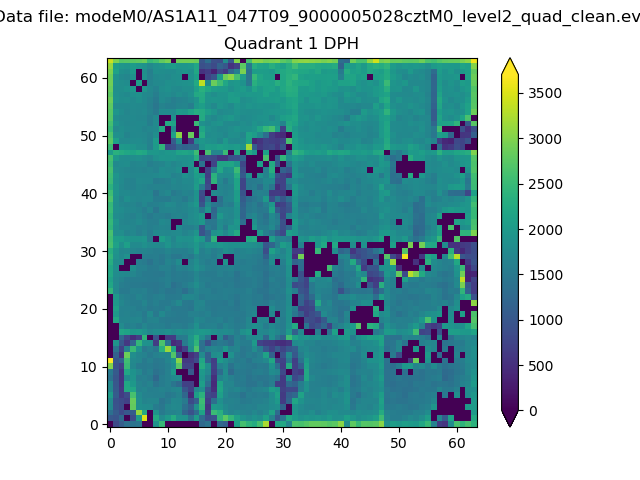 |
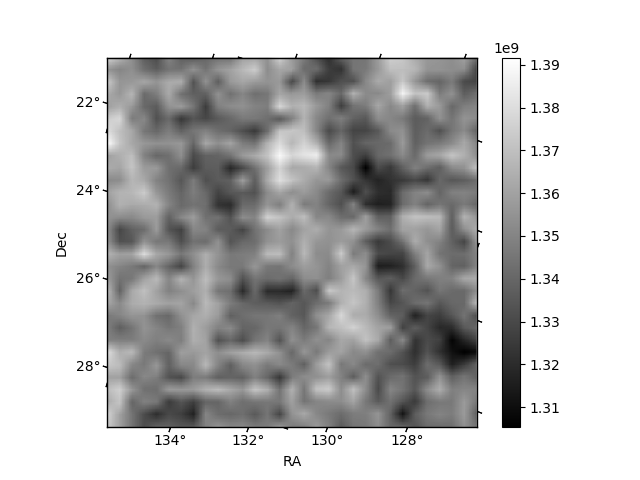
Quadrant B |
|---|---|---|---|
| Quadrant D | 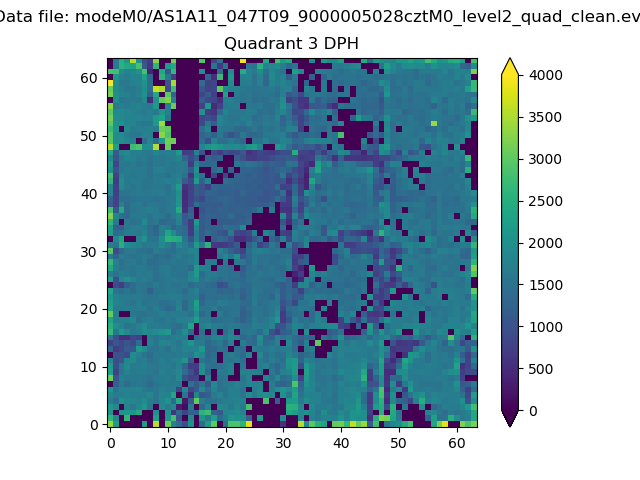 |
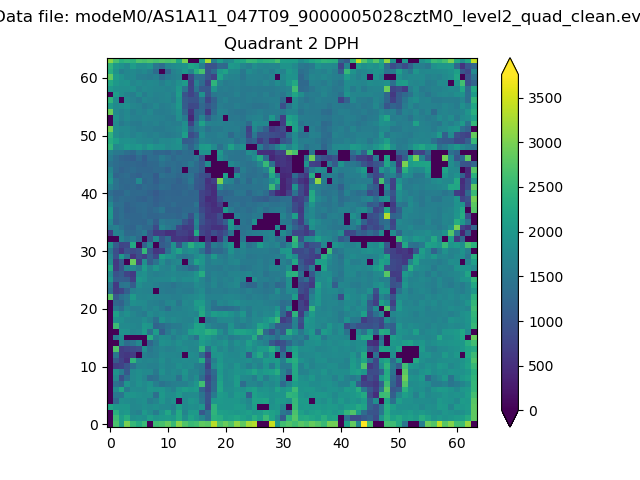 |
Quadrant C |
| Plot type | Count rate plots | Images |
|---|---|---|
| Comparison with Poisson distribution Blue bars denote a histogram of data divided into 1 sec bins. Red curve is a Poisson curve with rate = median count rate of data. |
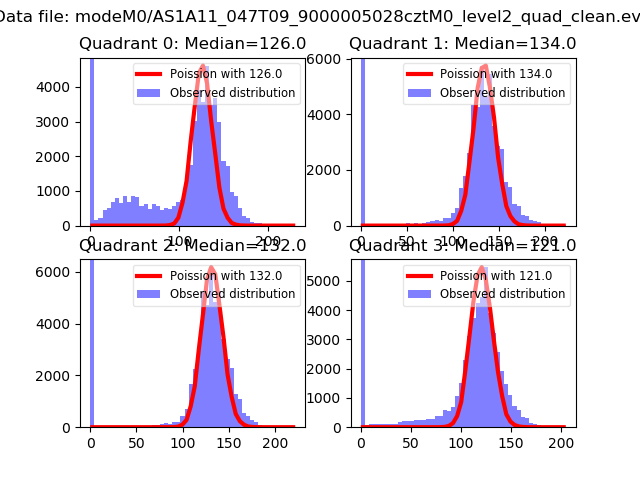 |
 |
| Quadrant-wise count rates Data is divided into 100 sec bins |
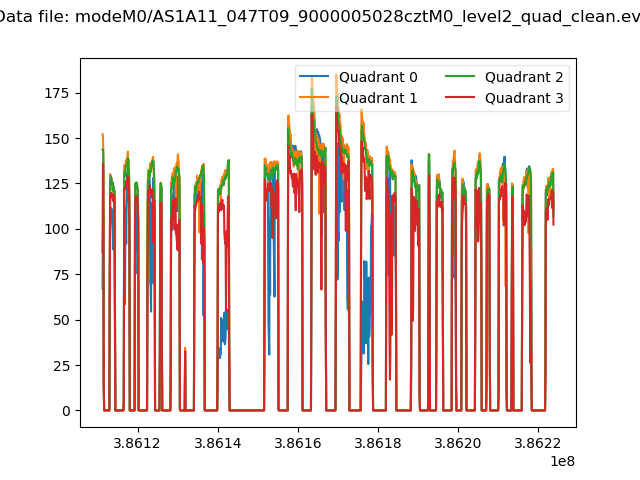 |
|
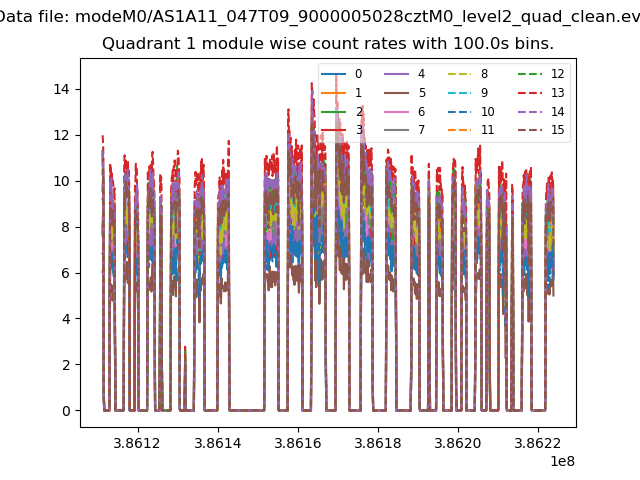
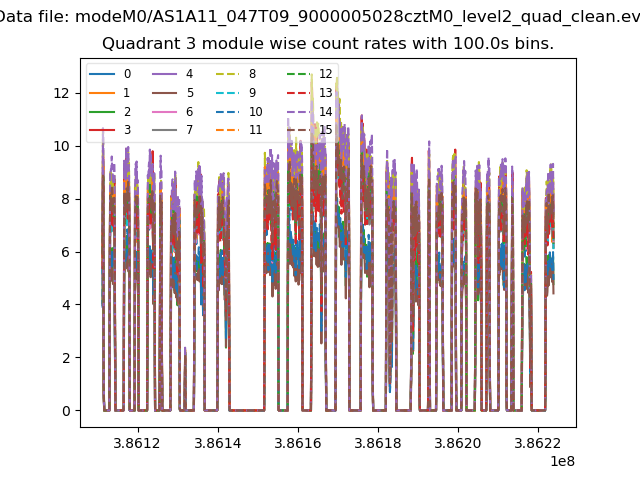
| Module-wise count rates for Quadrant A Data is divided into 100 sec bins |
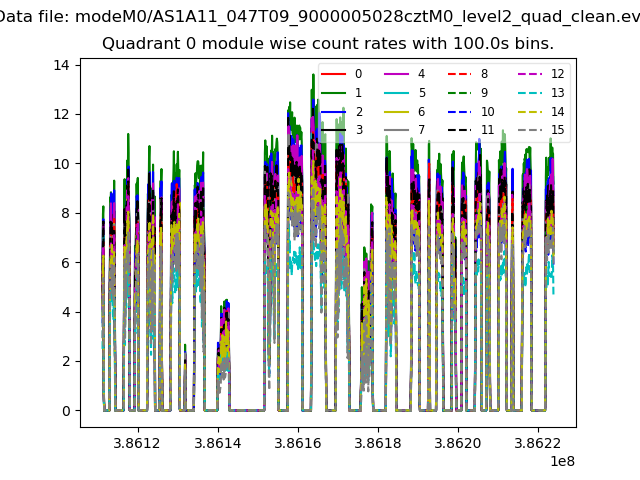 |
 |
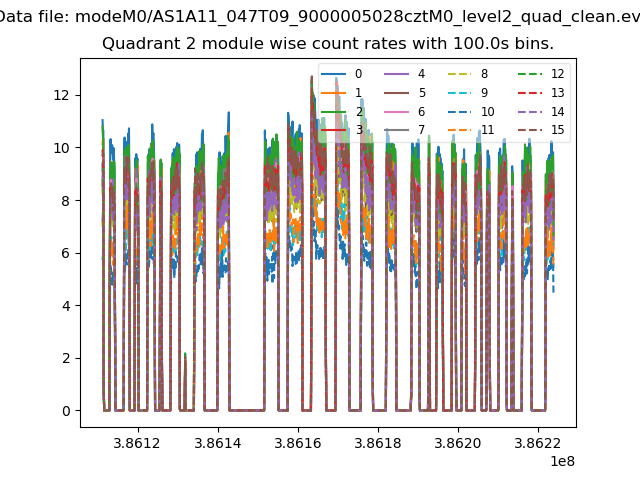
| Module-wise count rates for Quadrant B Data is divided into 100 sec bins |
 |
 |
| Module-wise count rates for Quadrant C Data is divided into 100 sec bins |
 |
 |
| Module-wise count rates for Quadrant D Data is divided into 100 sec bins |
 |
 |
| Parameter | Plot |
|---|---|
| CZT HV Monitor | 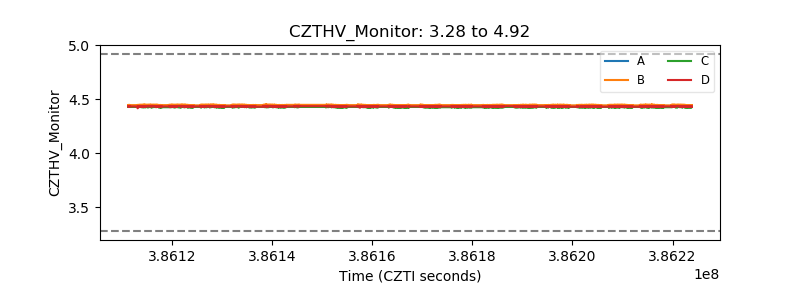 |
| D_VDD | 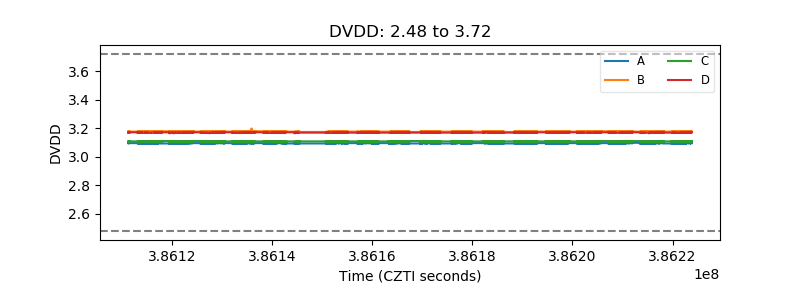 |
| Temperature 1 | 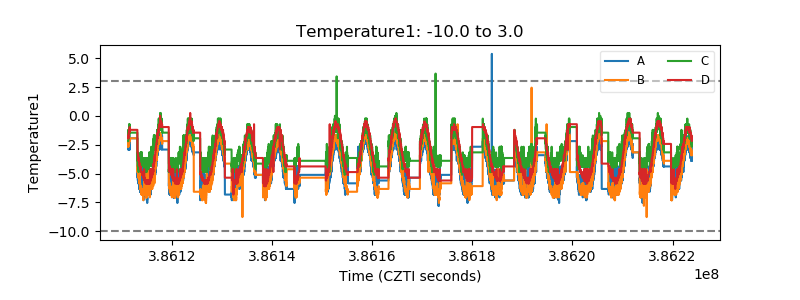 |
| Veto HV Monitor | 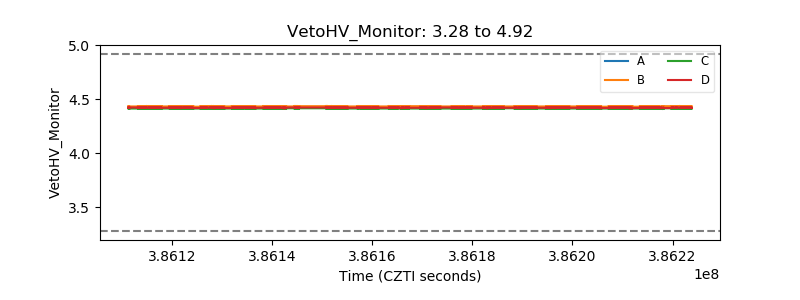 |
| Veto LLD | 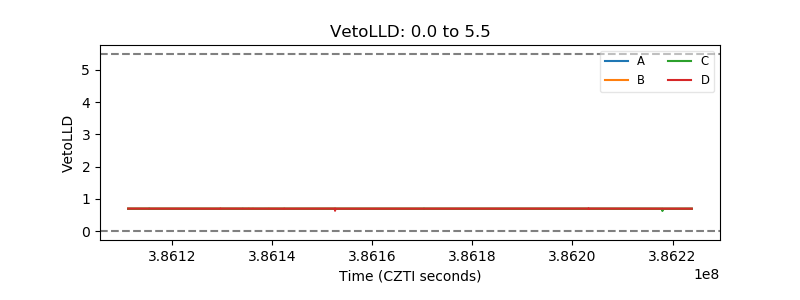 |
| Alpha Counter | 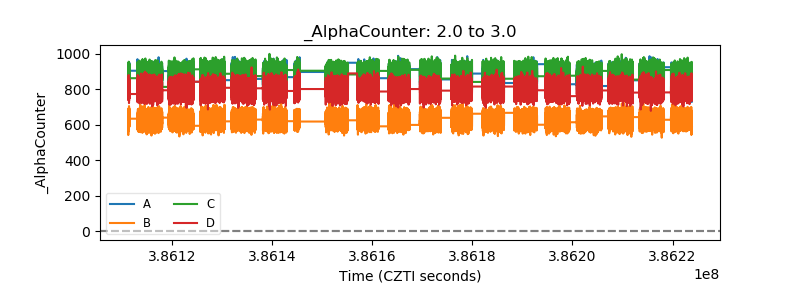 |
| _CPM_Rate | 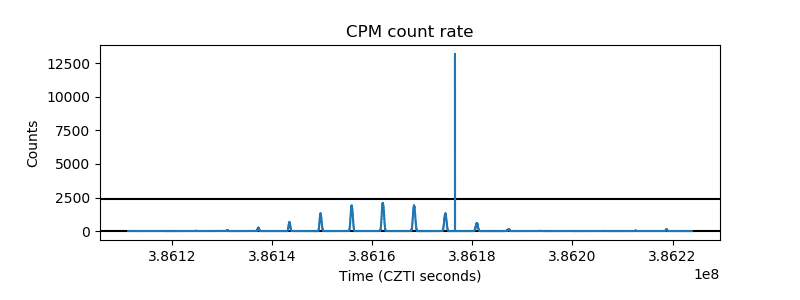 |
| CZT Counter | 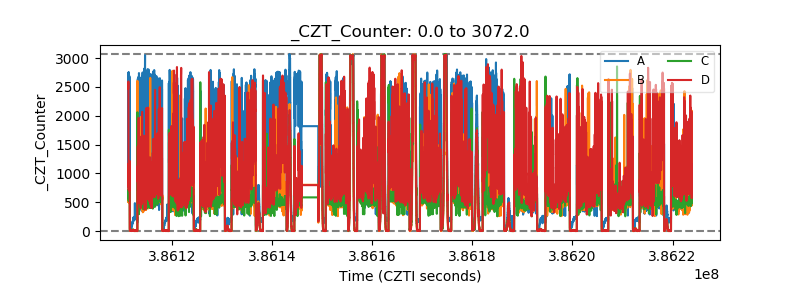 |
| +2.5 Volts monitor | 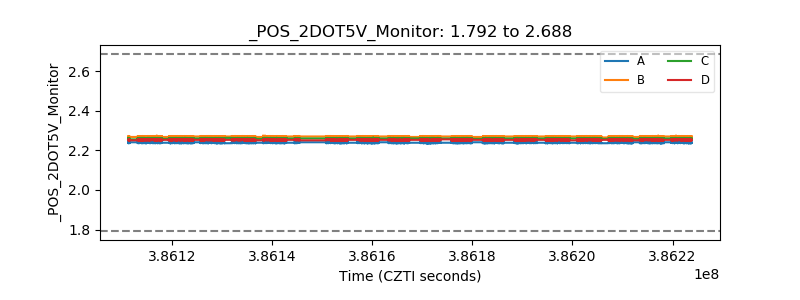 |
| +5 Volts monitor | 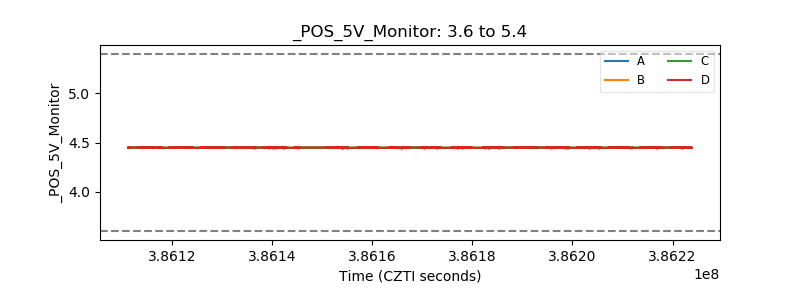 |
| _ROLL_ROT | 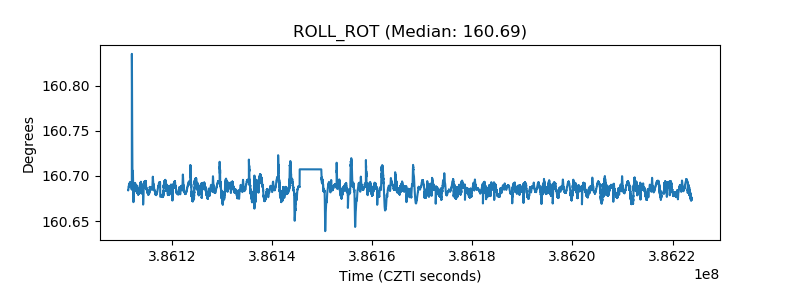 |
| _Roll_DEC | 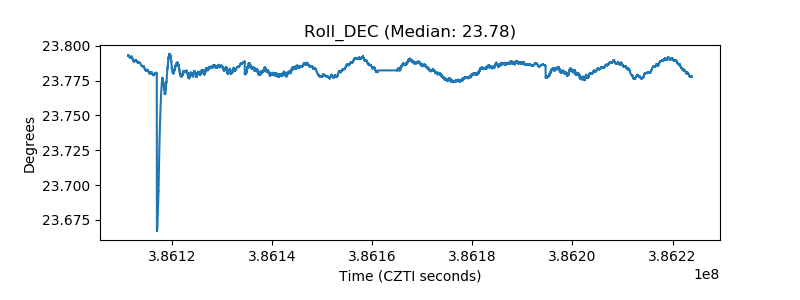 |
| _Roll_RA | 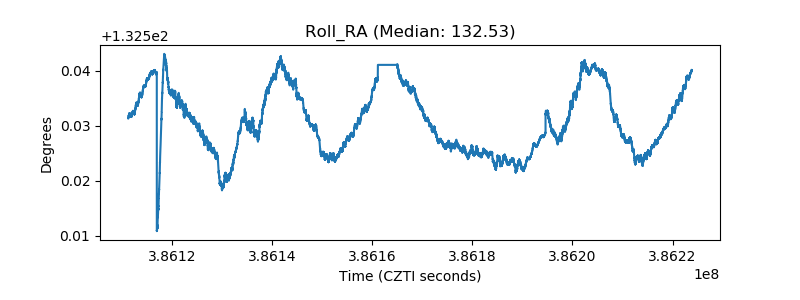 |
| Veto Counter | 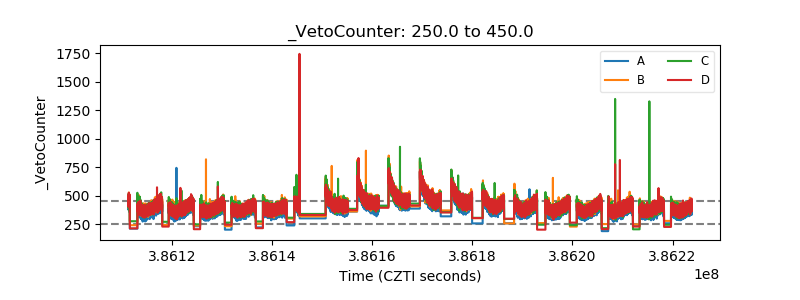 |