| Param | Original file | Final file |
|---|---|---|
| Filename | modeM0/AS1T05_015T01_9000005026_35101cztM0_level2.evt | modeM0/AS1T05_015T01_9000005026_35101cztM0_level2_quad_clean.evt |
| Size (bytes) | 592,470,720 | 54,210,240 |
| Size | 565.0 MB | 51.7 MB |
| Events in quadrant A | 2,899,936 | 325,577 |
| Events in quadrant B | 3,381,196 | 328,056 |
| Events in quadrant C | 3,384,205 | 315,872 |
| Events in quadrant D | 7,911,501 | 292,005 |
| Mode SS | |||
|---|---|---|---|
| Quadrant | BADHDUFLAG | Total packets | Discarded packets |
| A | 0 | 112 | 0 |
| B | 0 | 112 | 0 |
| C | 0 | 112 | 0 |
| D | 0 | 112 | 0 |
| Mode M9 | |||
|---|---|---|---|
| Quadrant | BADHDUFLAG | Total packets | Discarded packets |
| A | 0 | 22 | 0 |
| B | 0 | 22 | 0 |
| C | 0 | 22 | 0 |
| D | 0 | 23 | 0 |
| Mode M0 | |||
|---|---|---|---|
| Quadrant | BADHDUFLAG | Total packets | Discarded packets |
| A | 0 | 11904 | 3 |
| B | 0 | 13466 | 2 |
| C | 0 | 13279 | 2 |
| D | 0 | 27289 | 2 |
| Quadrant | Total seconds | Saturated seconds | Saturation percentage |
|---|---|---|---|
| A | 5417 | 8 | 0.147683% |
| B | 5417 | 71 | 1.310689% |
| C | 5417 | 173 | 3.193650% |
| D | 5417 | 864 | 15.949788% |
Noise dominated data is calculated using 1-second bins in cleaned event files. If a bin has >2000 counts, and if more than 50% of those come from <1% of pixels, then it is considered to be noise-dominated and hence unusable.
| Quadrant | # 1 sec bins | Bins with >0 counts | Bins with >2000 counts | High rate bins dominated by noise | Noise dominated (total time) | Noise dominated (detector-on time) | Marked lightcurve |
|---|---|---|---|---|---|---|---|
| A | 7358 | 5418 | 0 | 0 | 0.00% | 0.00% | 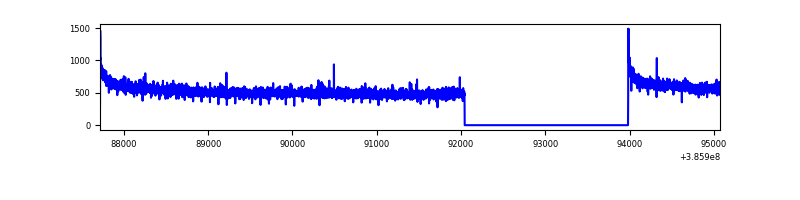 |
| B | 7358 | 5418 | 27 | 27 | 0.37% | 0.50% | 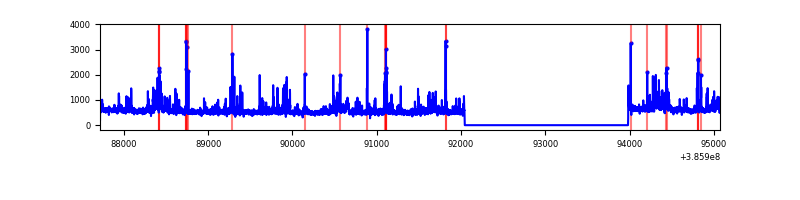 |
| C | 7358 | 5418 | 117 | 117 | 1.59% | 2.16% | 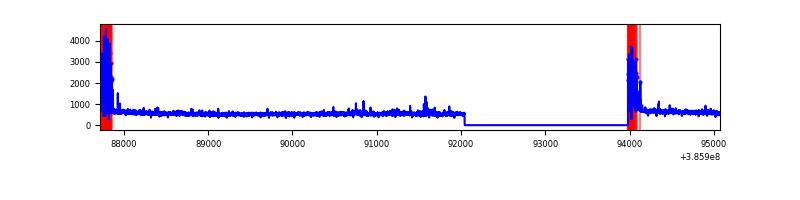 |
| D | 7358 | 5418 | 755 | 755 | 10.26% | 13.94% | 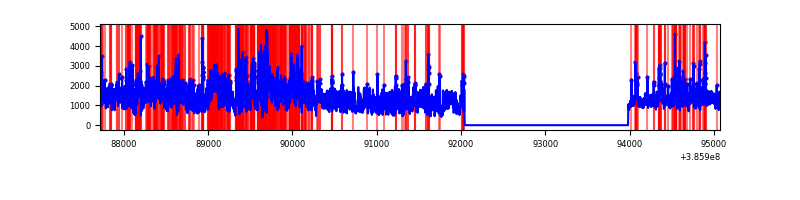 |
Top three noisy pixels from each quadrant. If the there are fewer than three noisy pixels in the level2.evt file, extra rows are filled as -1
| Pixel properties | Quadrant properties | ||||||
|---|---|---|---|---|---|---|---|
| Quadrant | DetID | PixID | Counts | Sigma | Mean | Median | Sigma |
| A | 10 | 83 | 82111 | 569.07 | 725 | 714 | 143.0 |
| A | 13 | 254 | 9659 | 62.54 | 725 | 714 | 143.0 |
| A | 13 | 6 | 8182 | 52.21 | 725 | 714 | 143.0 |
| B | 5 | 172 | 245501 | 1855.5 | 710 | 695 | 131.9 |
| B | 0 | 190 | 118448 | 892.5 | 710 | 695 | 131.9 |
| B | 5 | 255 | 69860 | 524.23 | 710 | 695 | 131.9 |
| C | 0 | 10 | 411353 | 2623.97 | 685 | 693 | 156.5 |
| C | 15 | 214 | 223686 | 1424.84 | 685 | 693 | 156.5 |
| C | 12 | 250 | 22684 | 140.51 | 685 | 693 | 156.5 |
| D | 8 | 195 | 3884860 | 23804.16 | 670 | 654 | 163.2 |
| D | 7 | 80 | 841117 | 5150.73 | 670 | 654 | 163.2 |
| D | 13 | 249 | 198521 | 1212.62 | 670 | 654 | 163.2 |
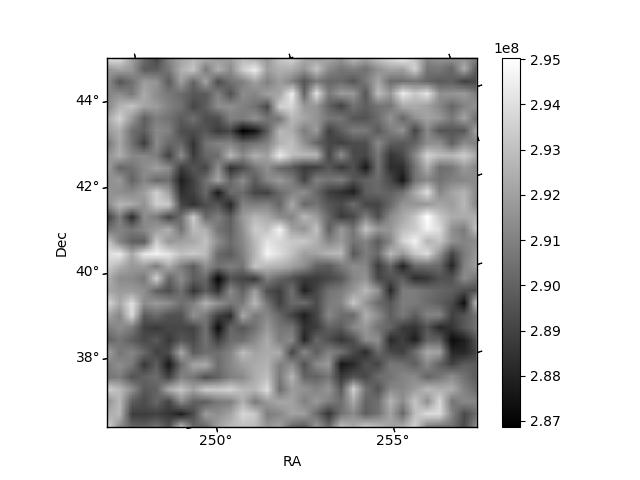
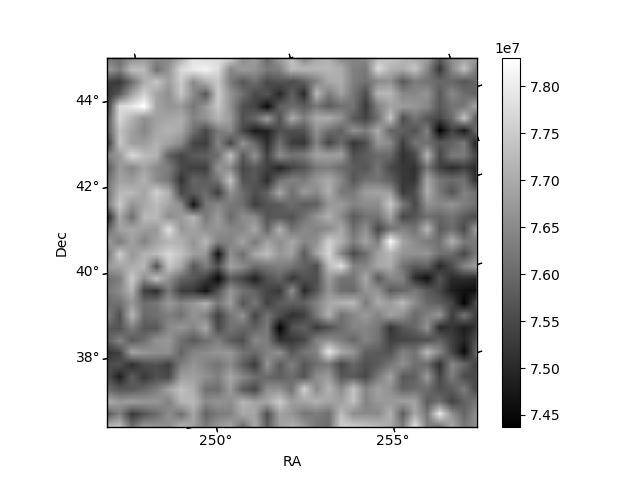
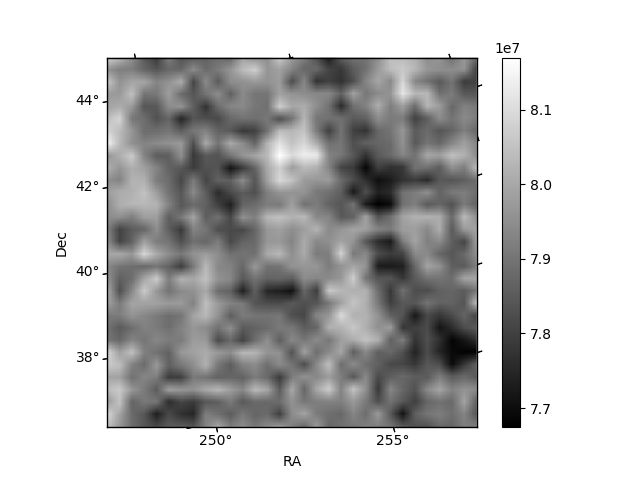
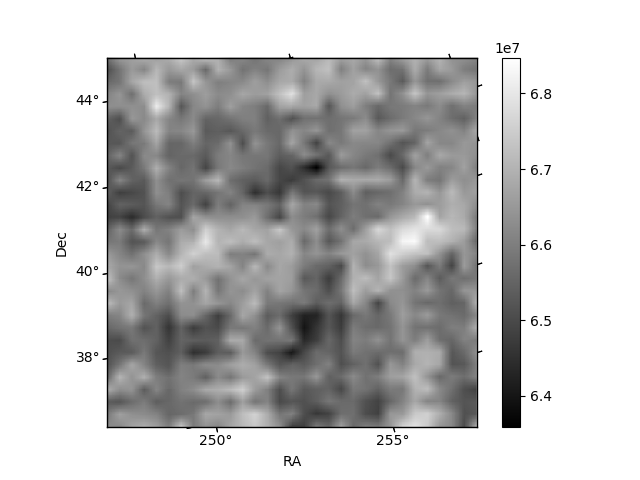
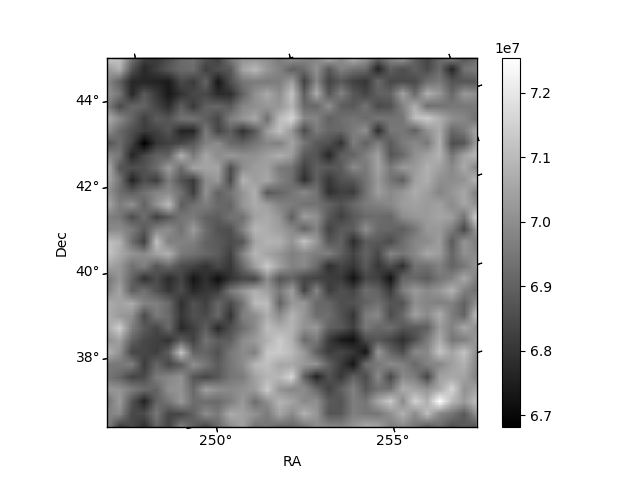
Histogram calculated using DETX and DETY for each event in the final _common_clean file
| Quadrant A | 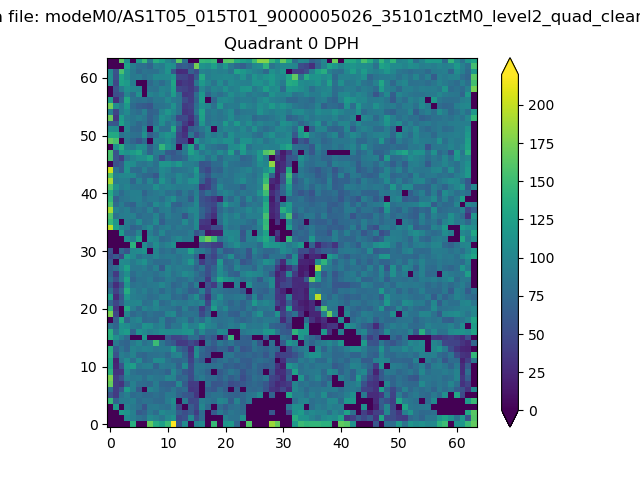 |
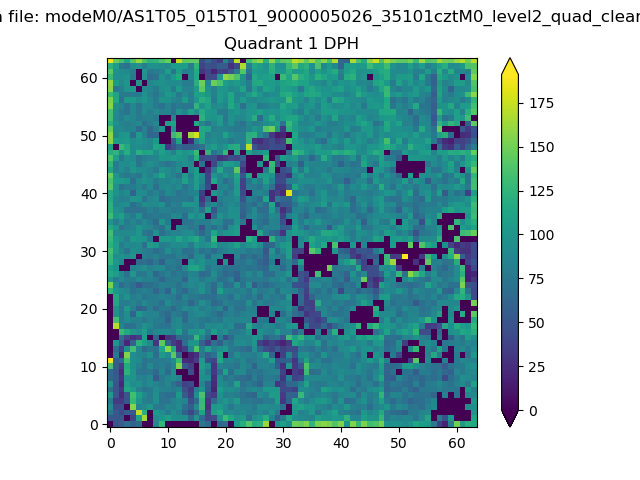 |
Quadrant B |
|---|---|---|---|
| Quadrant D | 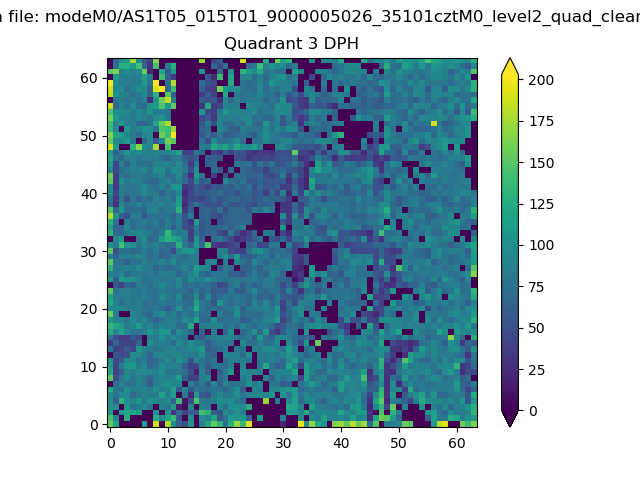 |
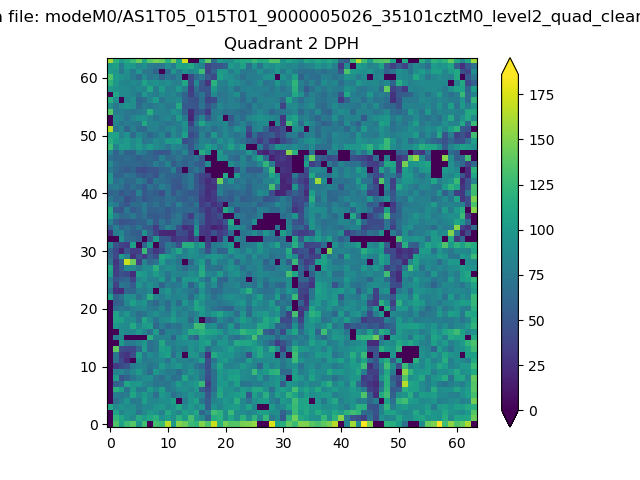 |
Quadrant C |
| Plot type | Count rate plots | Images |
|---|---|---|
| Comparison with Poisson distribution Blue bars denote a histogram of data divided into 1 sec bins. Red curve is a Poisson curve with rate = median count rate of data. |
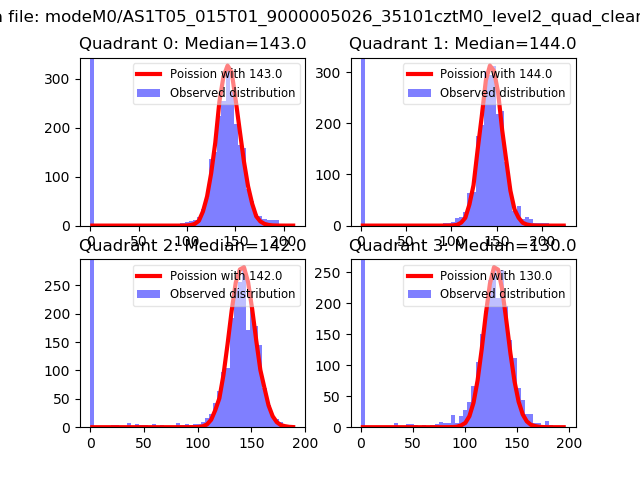 |
 |
| Quadrant-wise count rates Data is divided into 100 sec bins |
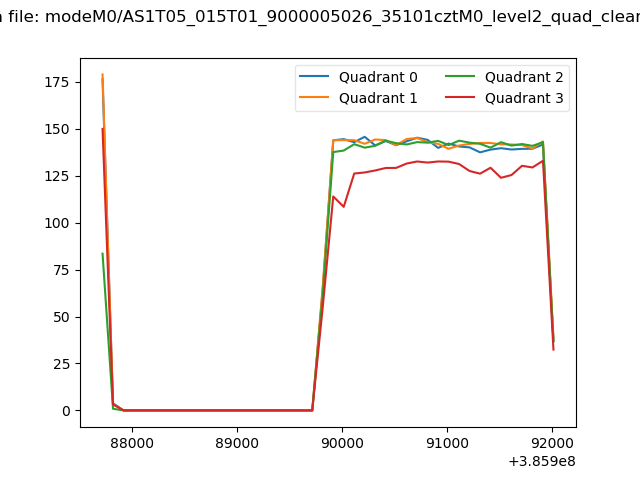 |
|
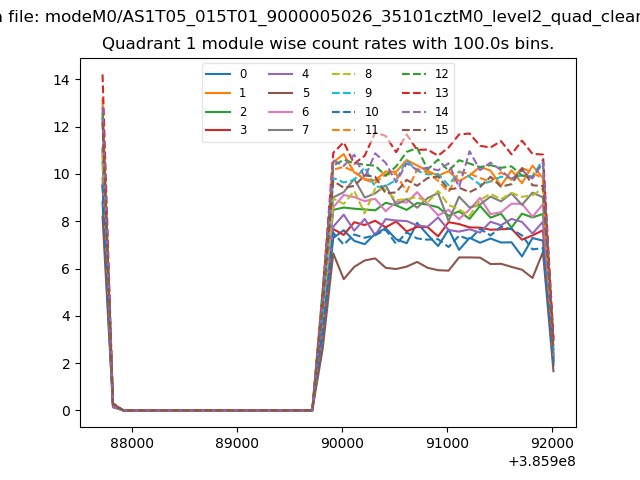
| Module-wise count rates for Quadrant A Data is divided into 100 sec bins |
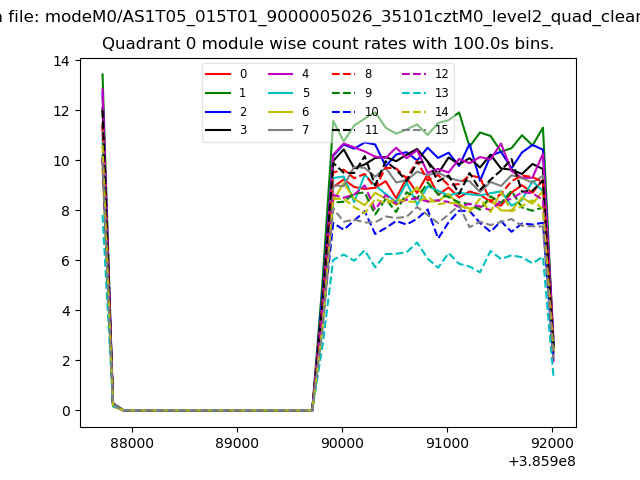 |
 |
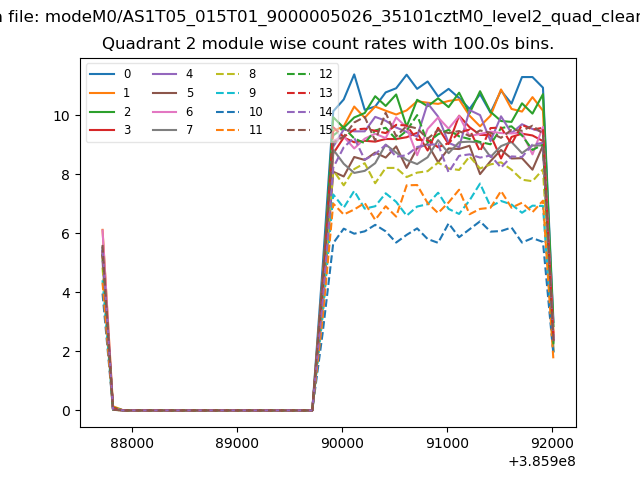
| Module-wise count rates for Quadrant B Data is divided into 100 sec bins |
 |
 |
| Module-wise count rates for Quadrant C Data is divided into 100 sec bins |
 |
 |
| Module-wise count rates for Quadrant D Data is divided into 100 sec bins |
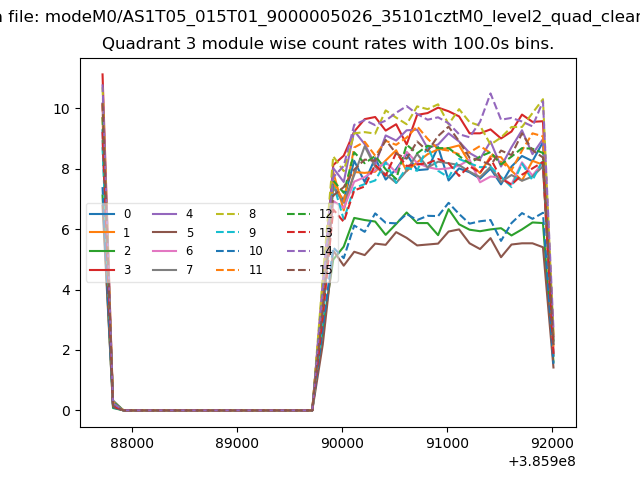 |
 |
| Parameter | Plot |
|---|---|
| CZT HV Monitor | 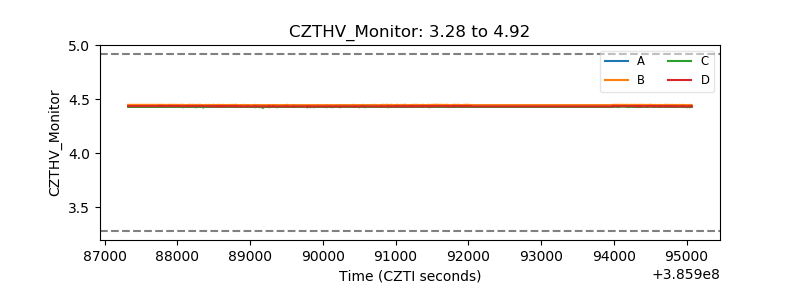 |
| D_VDD | 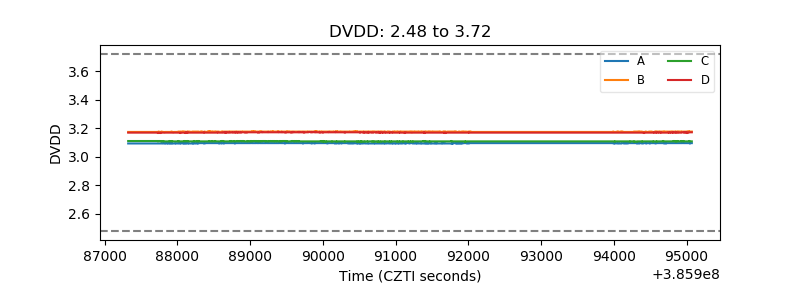 |
| Temperature 1 | 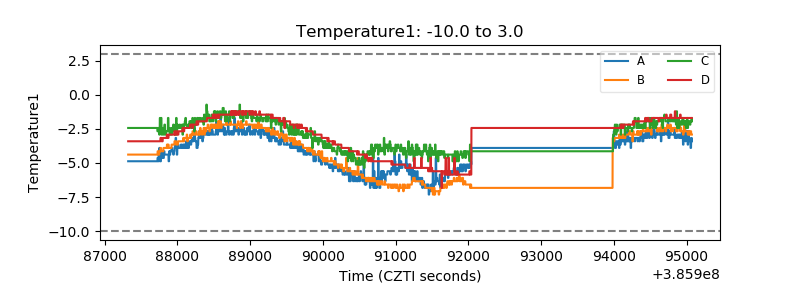 |
| Veto HV Monitor | 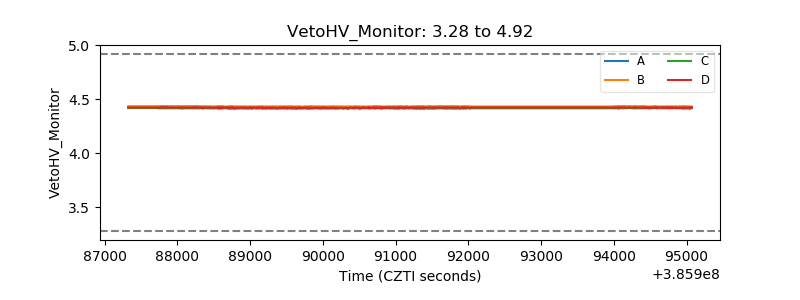 |
| Veto LLD | 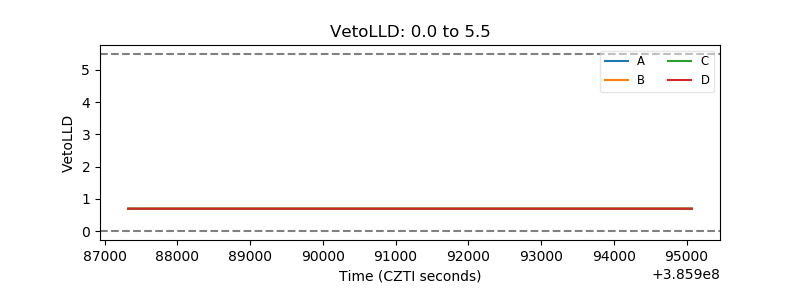 |
| Alpha Counter | 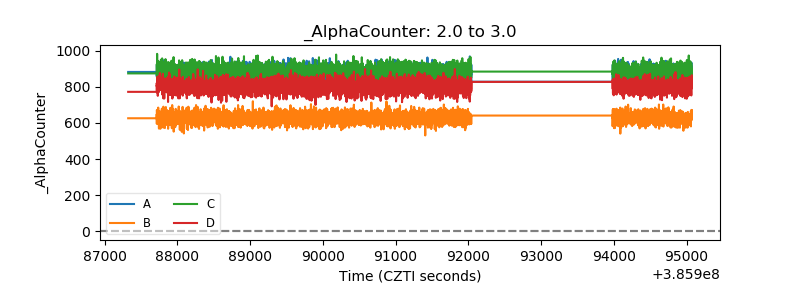 |
| _CPM_Rate | 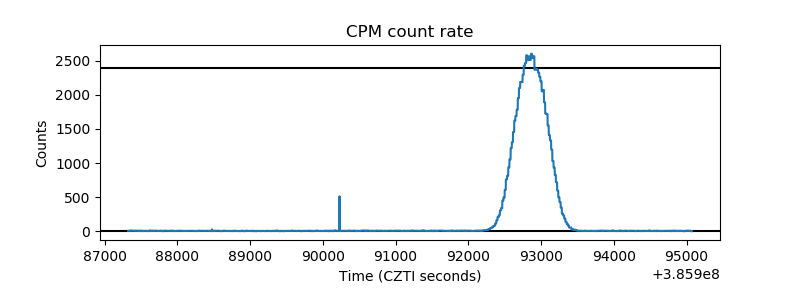 |
| CZT Counter | 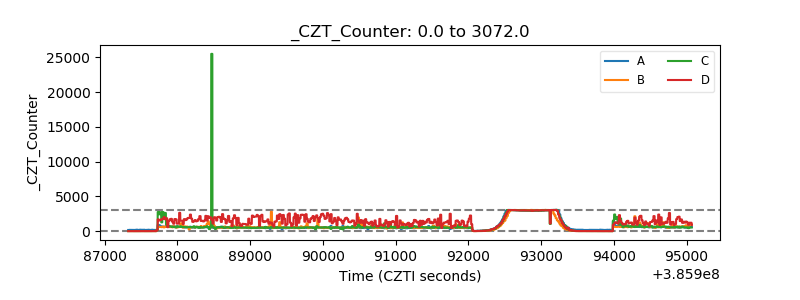 |
| +2.5 Volts monitor | 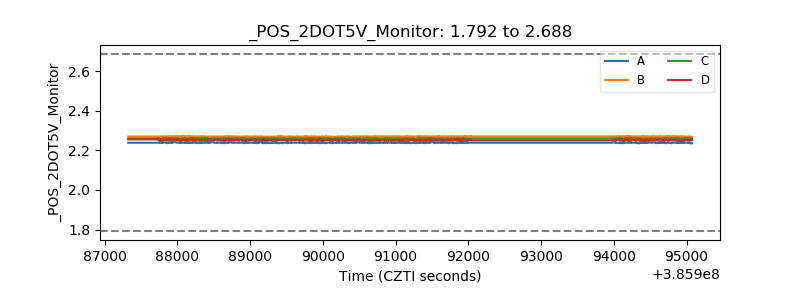 |
| +5 Volts monitor | 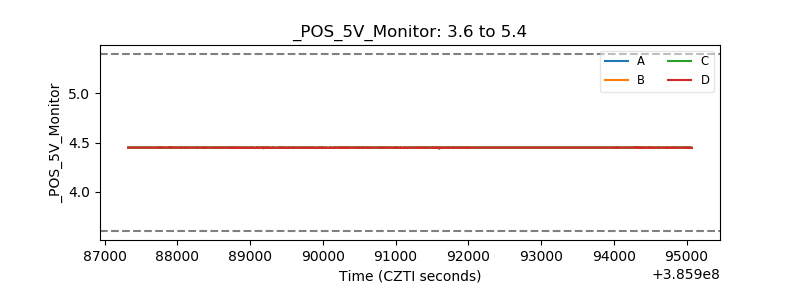 |
| _ROLL_ROT | 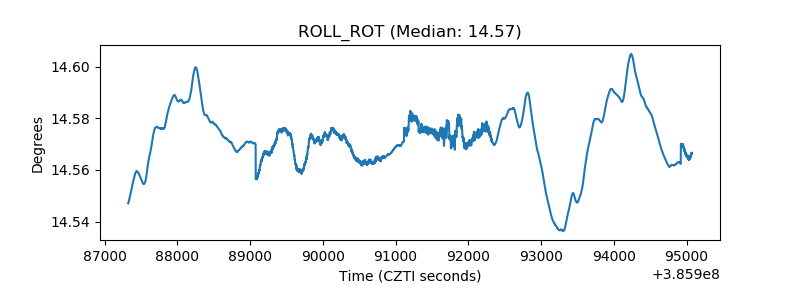 |
| _Roll_DEC | 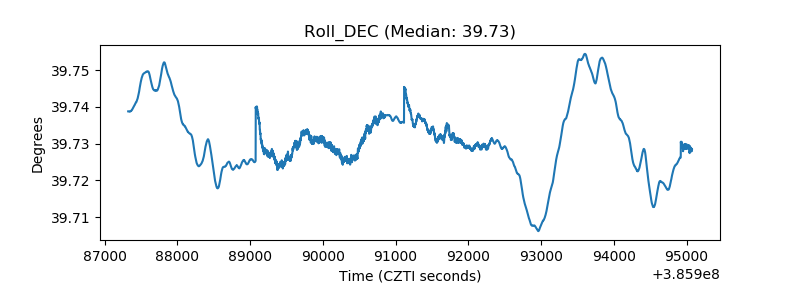 |
| _Roll_RA | 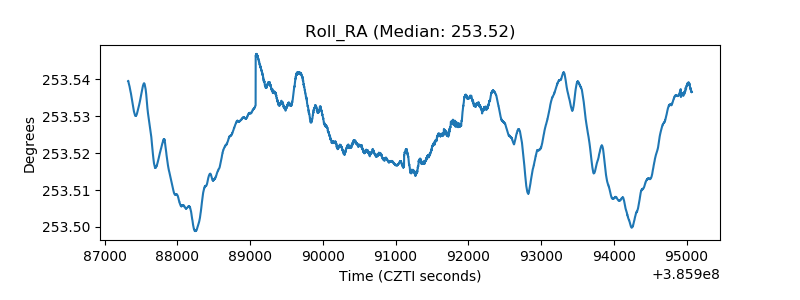 |
| Veto Counter | 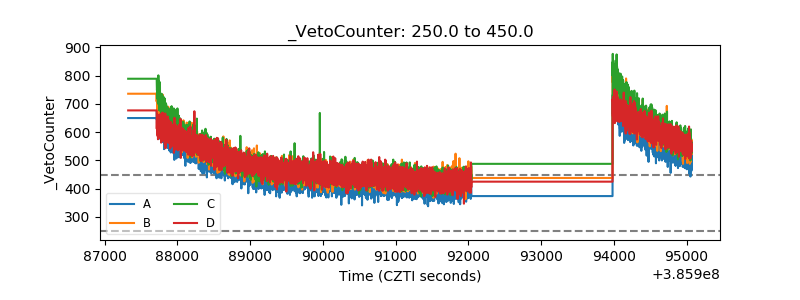 |