| Param | Original file | Final file |
|---|---|---|
| Filename | modeM0/AS1T05_015T01_9000005026_35087cztM0_level2.evt | modeM0/AS1T05_015T01_9000005026_35087cztM0_level2_quad_clean.evt |
| Size (bytes) | 493,583,040 | 57,623,040 |
| Size | 470.7 MB | 55.0 MB |
| Events in quadrant A | 2,875,998 | 349,948 |
| Events in quadrant B | 3,539,965 | 347,273 |
| Events in quadrant C | 3,487,894 | 348,261 |
| Events in quadrant D | 4,687,822 | 330,242 |
| Mode SS | |||
|---|---|---|---|
| Quadrant | BADHDUFLAG | Total packets | Discarded packets |
| A | 0 | 108 | 0 |
| B | 0 | 108 | 0 |
| C | 0 | 108 | 0 |
| D | 0 | 108 | 0 |
| Mode M9 | |||
|---|---|---|---|
| Quadrant | BADHDUFLAG | Total packets | Discarded packets |
| A | 0 | 25 | 0 |
| B | 0 | 25 | 0 |
| C | 0 | 25 | 0 |
| D | 0 | 26 | 0 |
| Mode M0 | |||
|---|---|---|---|
| Quadrant | BADHDUFLAG | Total packets | Discarded packets |
| A | 0 | 11819 | 3 |
| B | 0 | 13935 | 2 |
| C | 0 | 13654 | 2 |
| D | 0 | 17790 | 2 |
| Quadrant | Total seconds | Saturated seconds | Saturation percentage |
|---|---|---|---|
| A | 5262 | 11 | 0.209046% |
| B | 5262 | 116 | 2.204485% |
| C | 5262 | 206 | 3.914861% |
| D | 5262 | 179 | 3.401748% |
Noise dominated data is calculated using 1-second bins in cleaned event files. If a bin has >2000 counts, and if more than 50% of those come from <1% of pixels, then it is considered to be noise-dominated and hence unusable.
| Quadrant | # 1 sec bins | Bins with >0 counts | Bins with >2000 counts | High rate bins dominated by noise | Noise dominated (total time) | Noise dominated (detector-on time) | Marked lightcurve |
|---|---|---|---|---|---|---|---|
| A | 7264 | 5263 | 2 | 2 | 0.03% | 0.04% | 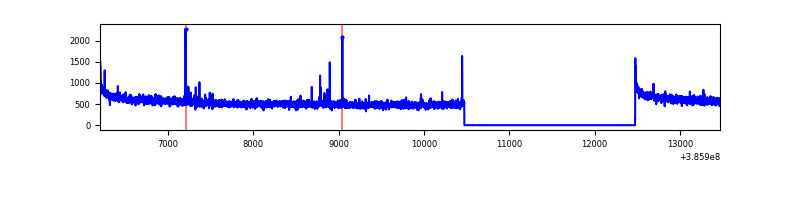 |
| B | 7264 | 5263 | 63 | 63 | 0.87% | 1.20% | 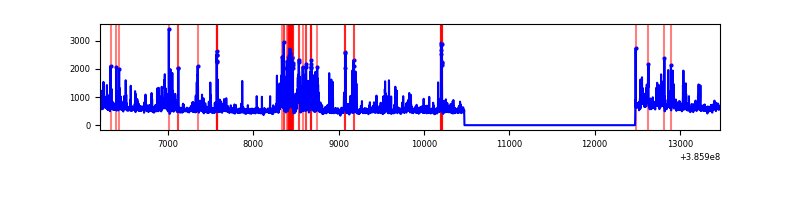 |
| C | 7264 | 5263 | 185 | 185 | 2.55% | 3.52% | 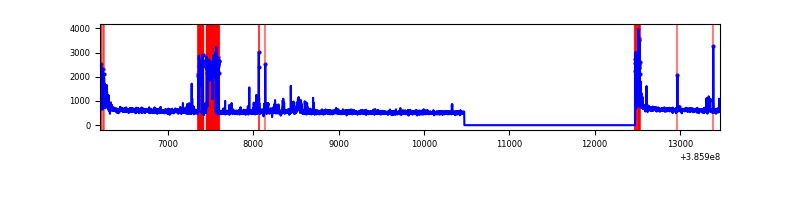 |
| D | 7264 | 5263 | 146 | 146 | 2.01% | 2.77% | 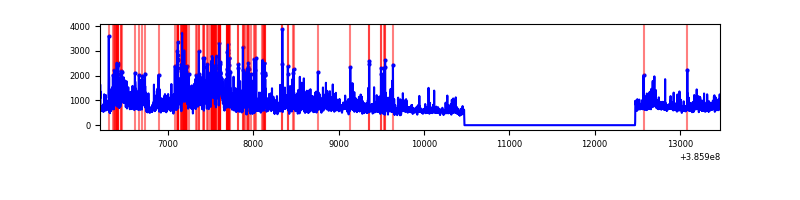 |
Top three noisy pixels from each quadrant. If the there are fewer than three noisy pixels in the level2.evt file, extra rows are filled as -1
| Pixel properties | Quadrant properties | ||||||
|---|---|---|---|---|---|---|---|
| Quadrant | DetID | PixID | Counts | Sigma | Mean | Median | Sigma |
| A | 10 | 83 | 82999 | 583.53 | 712 | 701 | 141.0 |
| A | 9 | 143 | 19006 | 129.79 | 712 | 701 | 141.0 |
| A | 13 | 6 | 12787 | 85.7 | 712 | 701 | 141.0 |
| B | 5 | 172 | 474771 | 3662.98 | 699 | 682 | 129.4 |
| B | 5 | 255 | 106028 | 813.94 | 699 | 682 | 129.4 |
| B | 4 | 232 | 96003 | 736.48 | 699 | 682 | 129.4 |
| C | 10 | 49 | 440786 | 2852.56 | 684 | 691 | 154.3 |
| C | 15 | 214 | 221695 | 1432.48 | 684 | 691 | 154.3 |
| C | 0 | 10 | 114670 | 738.78 | 684 | 691 | 154.3 |
| D | 8 | 195 | 1200228 | 7190.93 | 688 | 671 | 166.8 |
| D | 12 | 233 | 269165 | 1609.53 | 688 | 671 | 166.8 |
| D | 2 | 250 | 156058 | 931.49 | 688 | 671 | 166.8 |
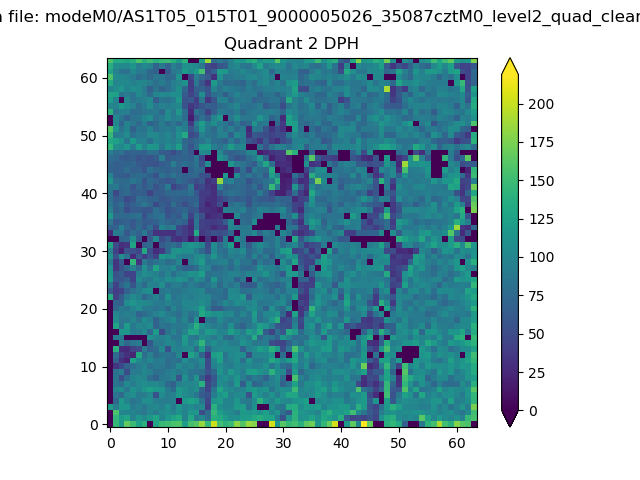
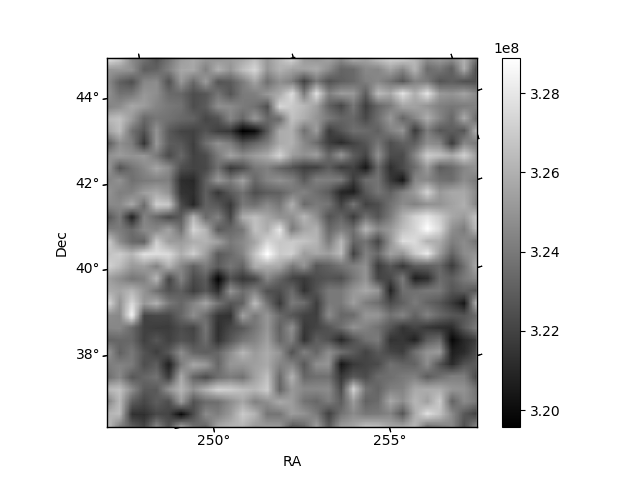
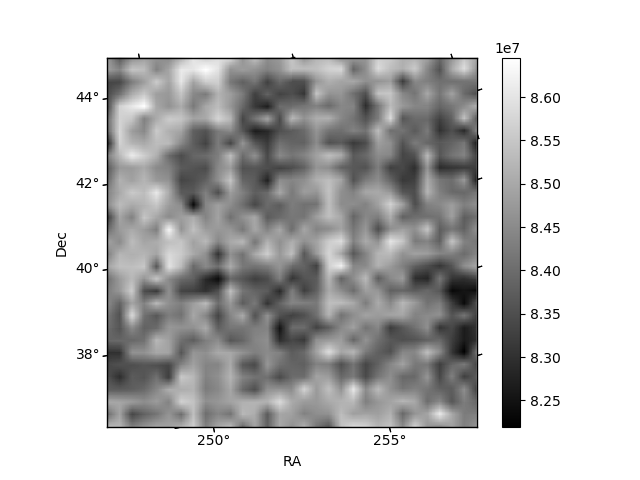
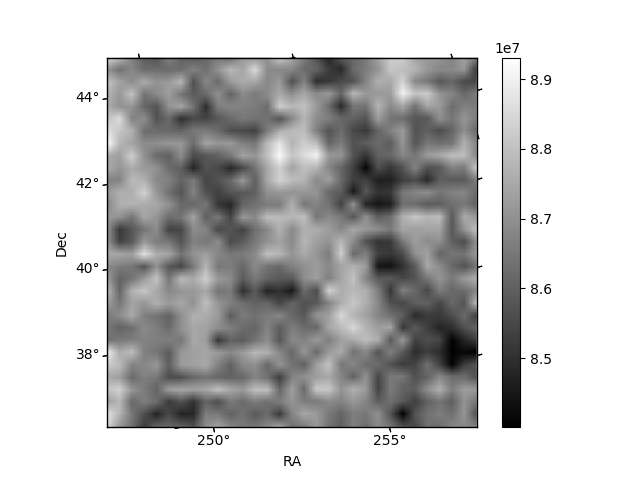
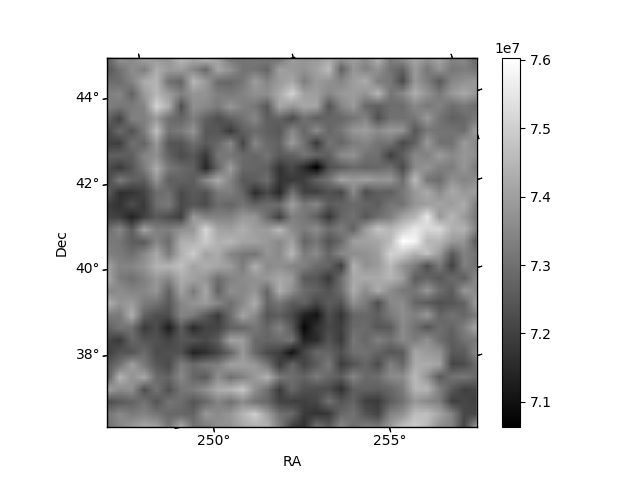
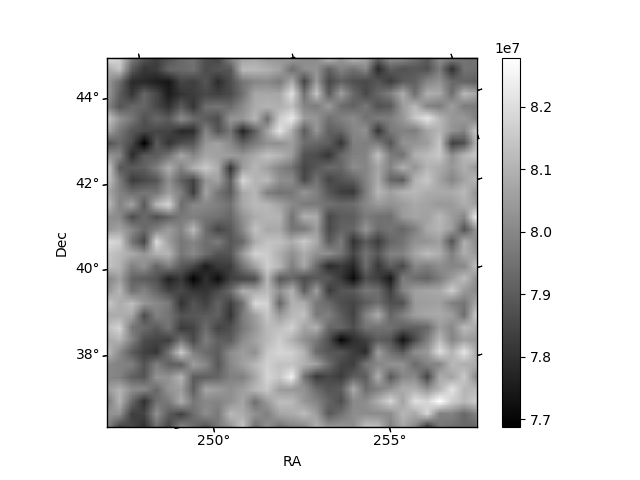
Histogram calculated using DETX and DETY for each event in the final _common_clean file
| Quadrant A | 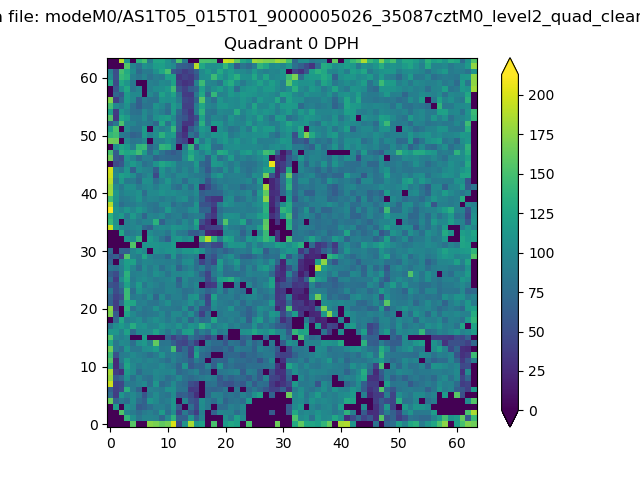 |
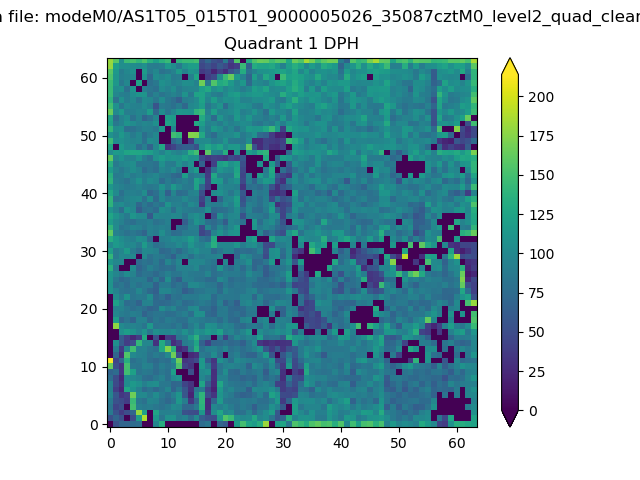 |
Quadrant B |
|---|---|---|---|
| Quadrant D | 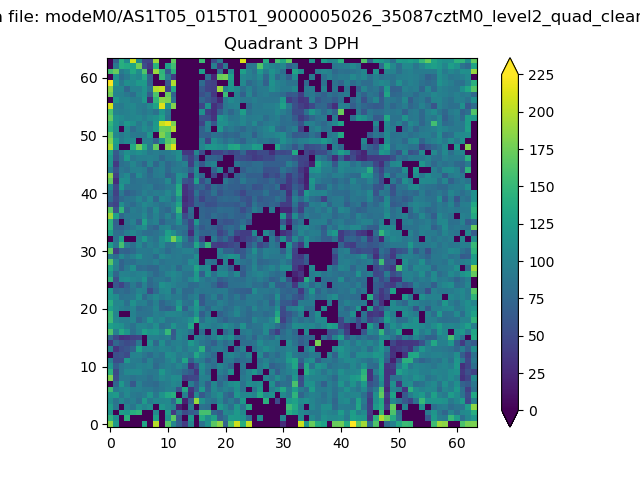 |
 |
Quadrant C |
| Plot type | Count rate plots | Images |
|---|---|---|
| Comparison with Poisson distribution Blue bars denote a histogram of data divided into 1 sec bins. Red curve is a Poisson curve with rate = median count rate of data. |
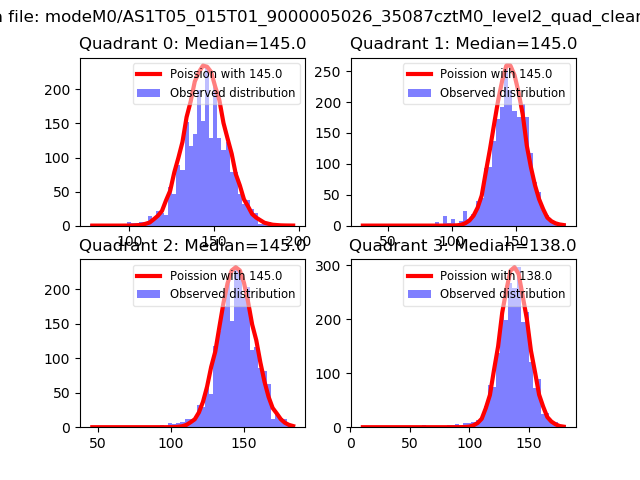 |
 |
| Quadrant-wise count rates Data is divided into 100 sec bins |
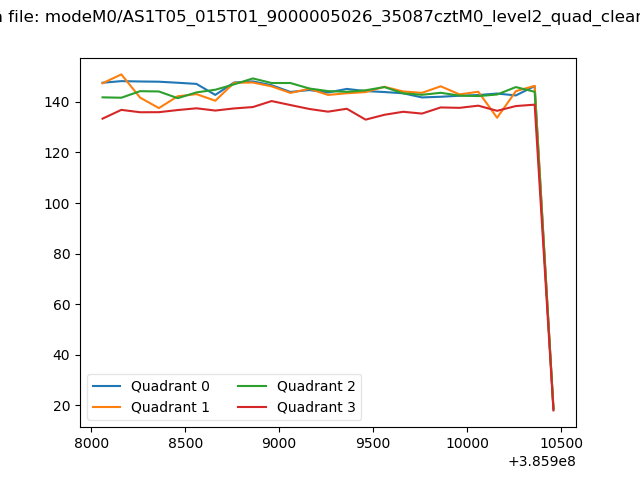 |
|
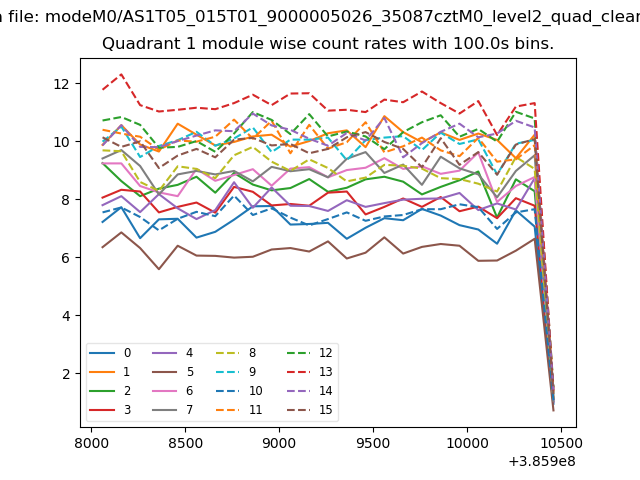
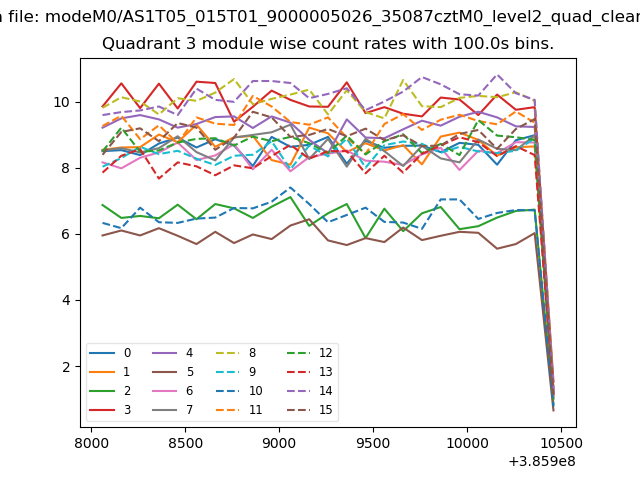
| Module-wise count rates for Quadrant A Data is divided into 100 sec bins |
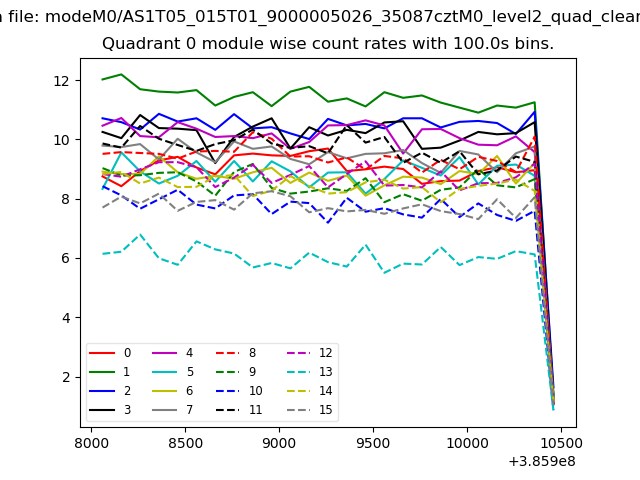 |
 |
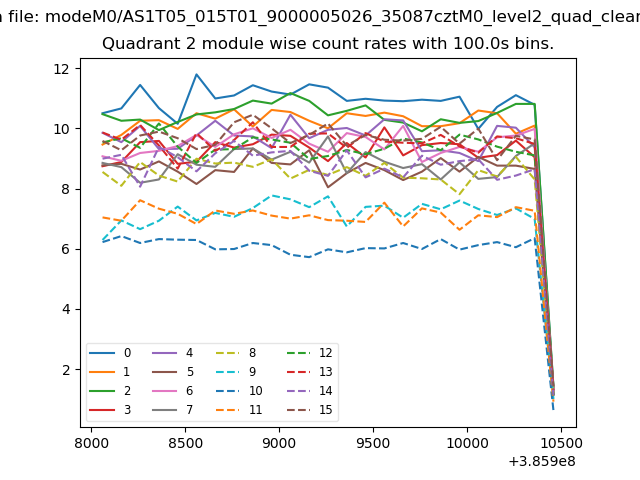
| Module-wise count rates for Quadrant B Data is divided into 100 sec bins |
 |
 |
| Module-wise count rates for Quadrant C Data is divided into 100 sec bins |
 |
 |
| Module-wise count rates for Quadrant D Data is divided into 100 sec bins |
 |
 |
| Parameter | Plot |
|---|---|
| CZT HV Monitor | 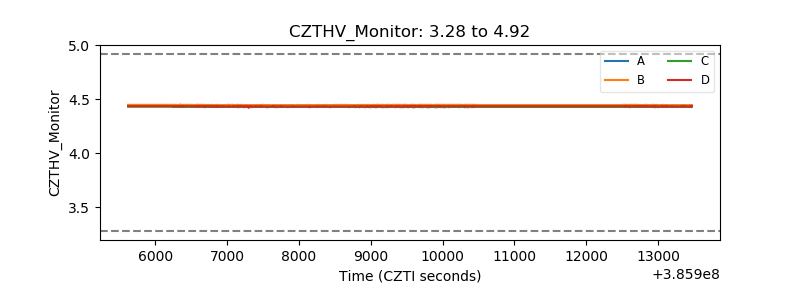 |
| D_VDD | 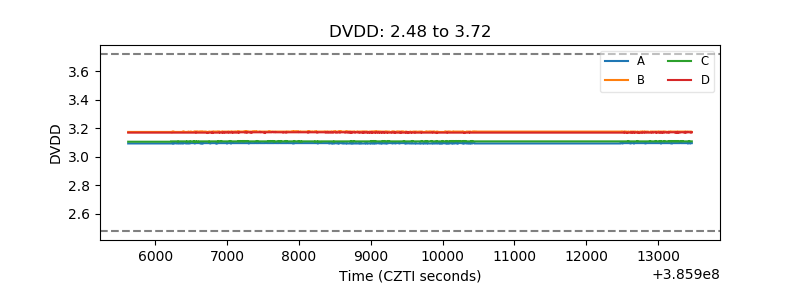 |
| Temperature 1 | 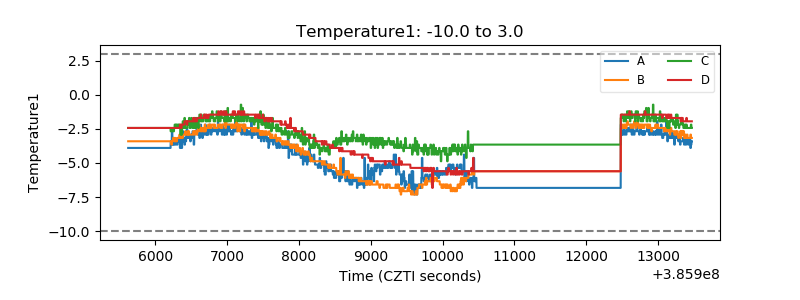 |
| Veto HV Monitor | 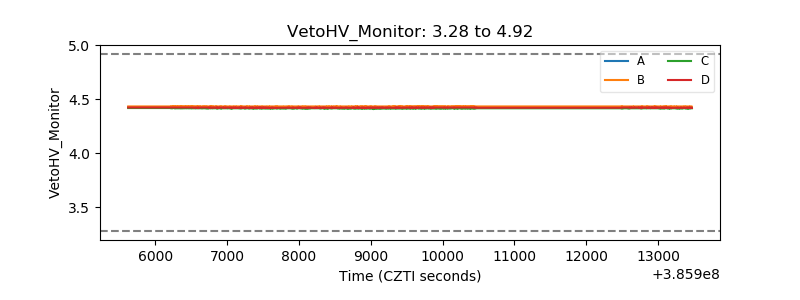 |
| Veto LLD | 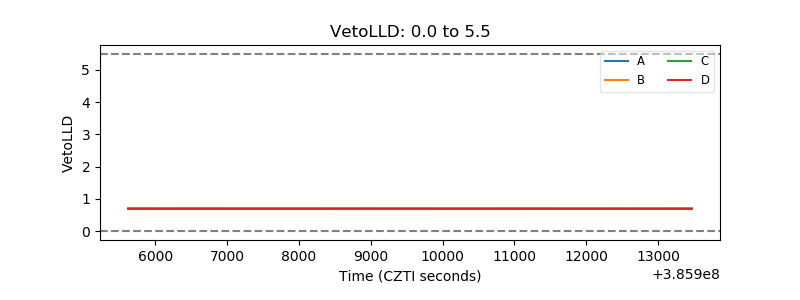 |
| Alpha Counter | 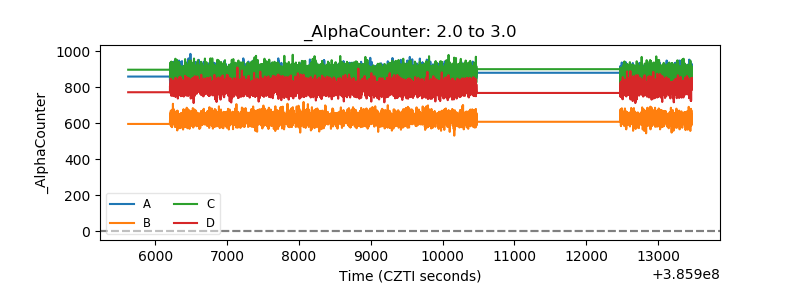 |
| _CPM_Rate | 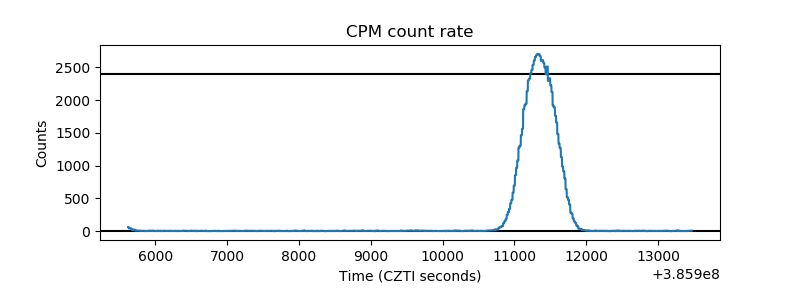 |
| CZT Counter | 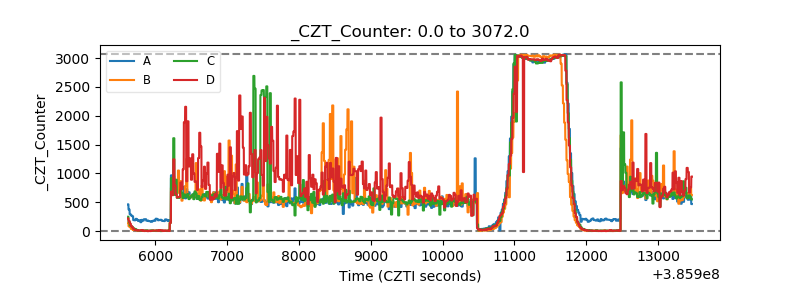 |
| +2.5 Volts monitor | 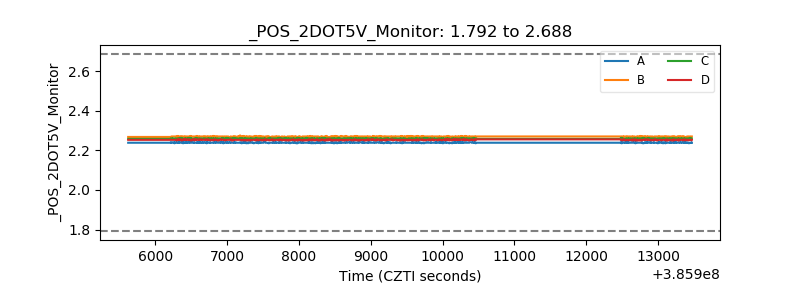 |
| +5 Volts monitor | 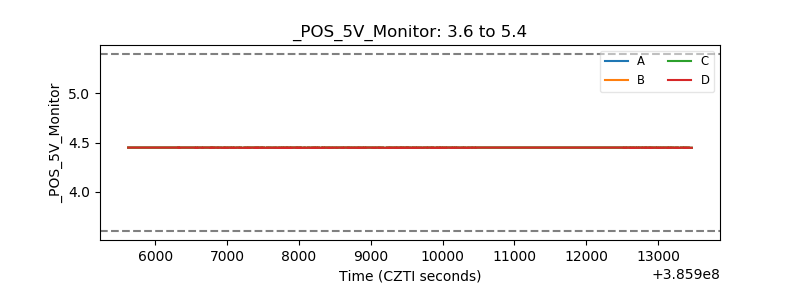 |
| _ROLL_ROT | 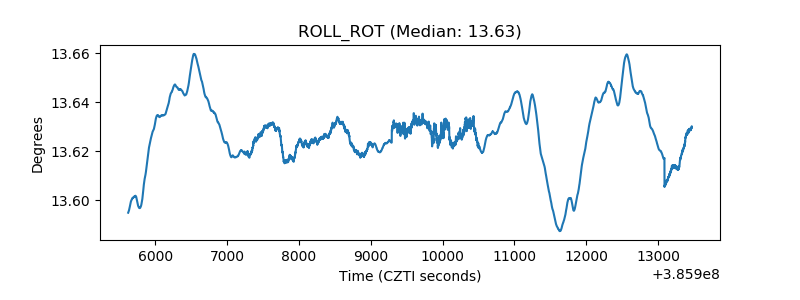 |
| _Roll_DEC | 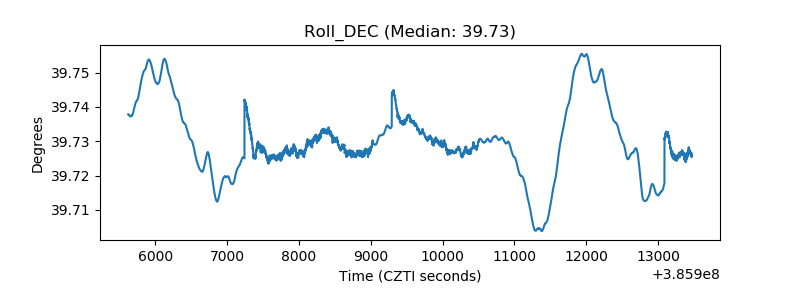 |
| _Roll_RA | 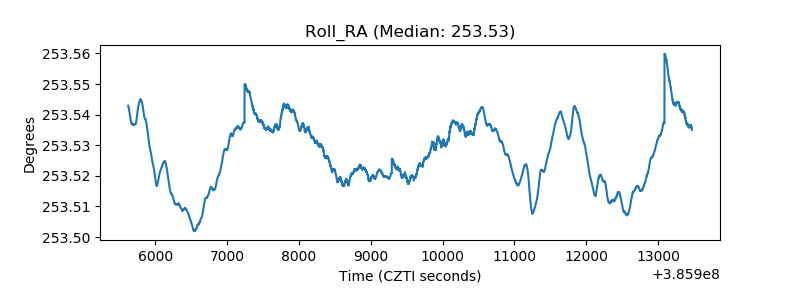 |
| Veto Counter | 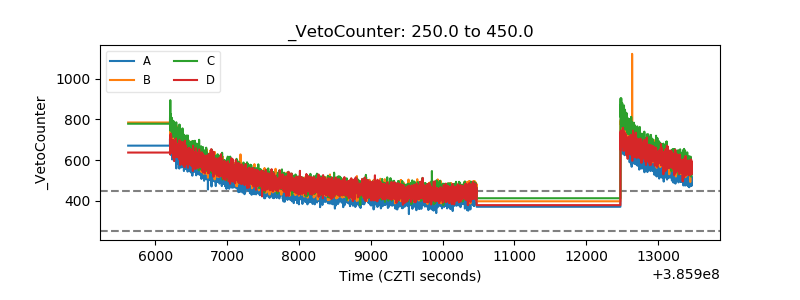 |