| Param | Original file | Final file |
|---|---|---|
| Filename | modeM0/AS1T05_015T01_9000005026_35077cztM0_level2.evt | modeM0/AS1T05_015T01_9000005026_35077cztM0_level2_quad_clean.evt |
| Size (bytes) | 459,158,400 | 87,140,160 |
| Size | 437.9 MB | 83.1 MB |
| Events in quadrant A | 2,499,354 | 568,239 |
| Events in quadrant B | 3,324,874 | 572,549 |
| Events in quadrant C | 2,741,999 | 579,368 |
| Events in quadrant D | 4,973,365 | 540,956 |
| Mode SS | |||
|---|---|---|---|
| Quadrant | BADHDUFLAG | Total packets | Discarded packets |
| A | 0 | 112 | 0 |
| B | 0 | 112 | 0 |
| C | 0 | 112 | 0 |
| D | 0 | 112 | 0 |
| Mode M9 | |||
|---|---|---|---|
| Quadrant | BADHDUFLAG | Total packets | Discarded packets |
| A | 0 | 24 | 0 |
| B | 0 | 24 | 0 |
| C | 0 | 24 | 0 |
| D | 0 | 25 | 0 |
| Mode M0 | |||
|---|---|---|---|
| Quadrant | BADHDUFLAG | Total packets | Discarded packets |
| A | 0 | 11022 | 3 |
| B | 0 | 13457 | 2 |
| C | 0 | 11316 | 2 |
| D | 0 | 18581 | 2 |
| Quadrant | Total seconds | Saturated seconds | Saturation percentage |
|---|---|---|---|
| A | 5388 | 6 | 0.111359% |
| B | 5388 | 150 | 2.783964% |
| C | 5388 | 22 | 0.408315% |
| D | 5388 | 187 | 3.470676% |
Noise dominated data is calculated using 1-second bins in cleaned event files. If a bin has >2000 counts, and if more than 50% of those come from <1% of pixels, then it is considered to be noise-dominated and hence unusable.
| Quadrant | # 1 sec bins | Bins with >0 counts | Bins with >2000 counts | High rate bins dominated by noise | Noise dominated (total time) | Noise dominated (detector-on time) | Marked lightcurve |
|---|---|---|---|---|---|---|---|
| A | 7119 | 5389 | 0 | 0 | 0.00% | 0.00% | 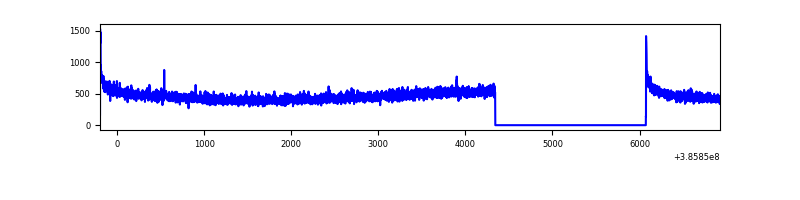 |
| B | 7119 | 5389 | 87 | 87 | 1.22% | 1.61% | 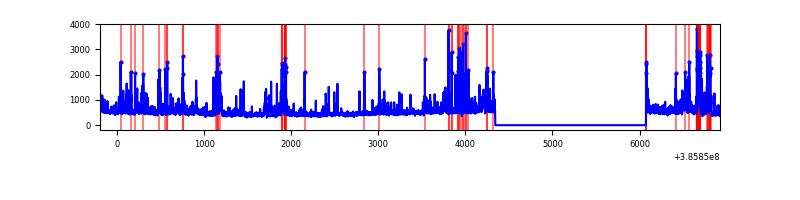 |
| C | 7119 | 5389 | 10 | 10 | 0.14% | 0.19% | 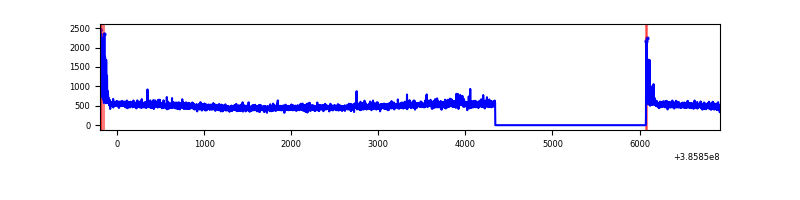 |
| D | 7119 | 5389 | 152 | 152 | 2.14% | 2.82% | 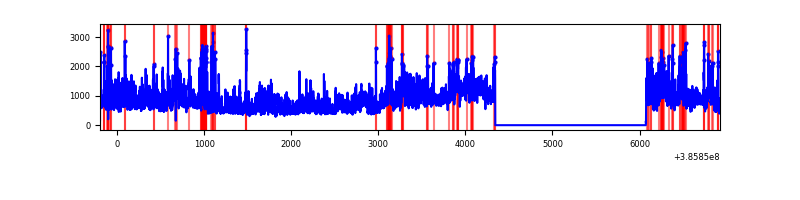 |
Top three noisy pixels from each quadrant. If the there are fewer than three noisy pixels in the level2.evt file, extra rows are filled as -1
| Pixel properties | Quadrant properties | ||||||
|---|---|---|---|---|---|---|---|
| Quadrant | DetID | PixID | Counts | Sigma | Mean | Median | Sigma |
| A | 10 | 83 | 78522 | 621.53 | 622 | 610 | 125.4 |
| A | 13 | 6 | 12137 | 91.95 | 622 | 610 | 125.4 |
| A | 13 | 254 | 8322 | 61.52 | 622 | 610 | 125.4 |
| B | 5 | 172 | 549798 | 4683.21 | 616 | 600 | 117.3 |
| B | 0 | 189 | 141763 | 1203.75 | 616 | 600 | 117.3 |
| B | 0 | 190 | 89423 | 757.43 | 616 | 600 | 117.3 |
| C | 15 | 214 | 225828 | 1578.89 | 613 | 618 | 142.6 |
| C | 0 | 10 | 81671 | 568.24 | 613 | 618 | 142.6 |
| C | 14 | 67 | 43707 | 302.09 | 613 | 618 | 142.6 |
| D | 8 | 195 | 2017691 | 13861.49 | 601 | 585 | 145.5 |
| D | 13 | 249 | 350077 | 2401.7 | 601 | 585 | 145.5 |
| D | 2 | 250 | 114440 | 782.41 | 601 | 585 | 145.5 |
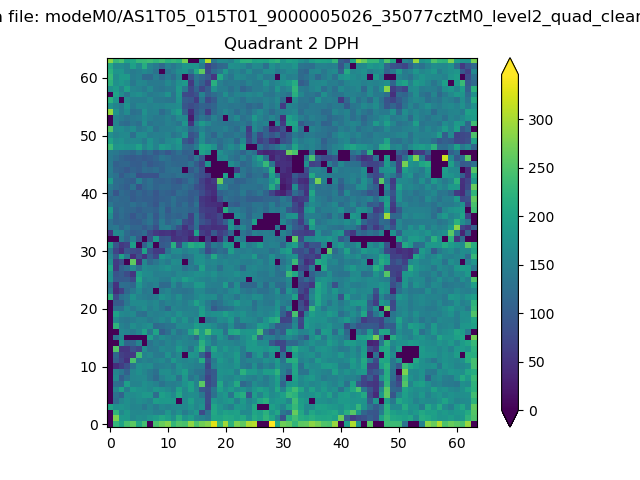
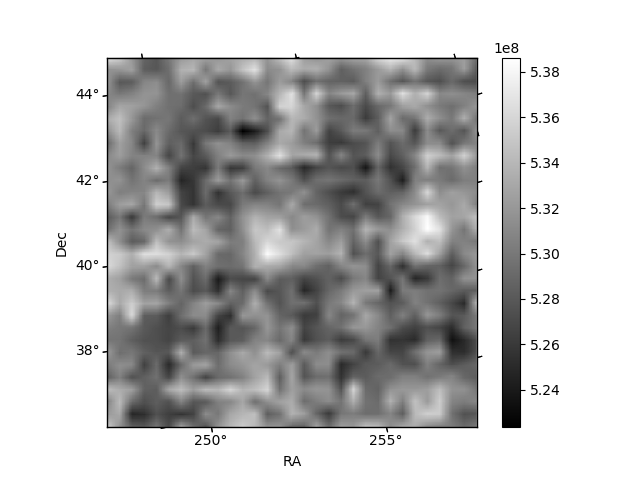
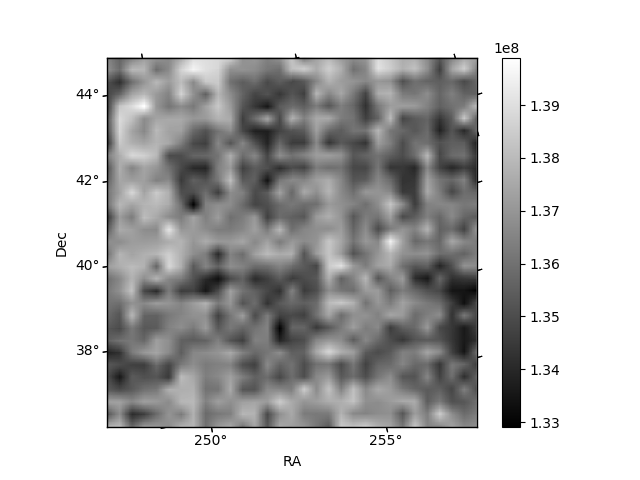
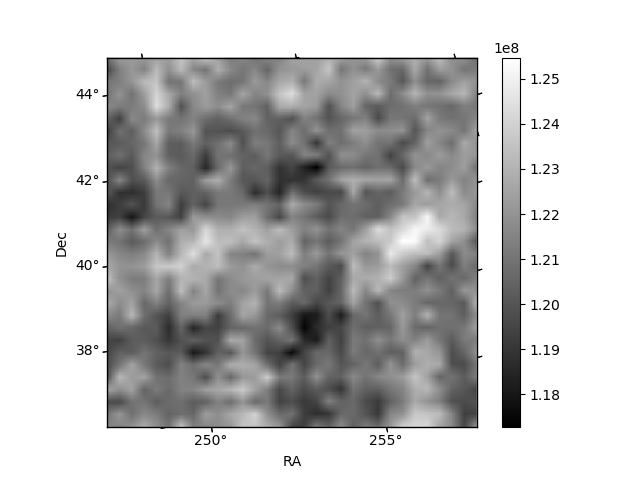
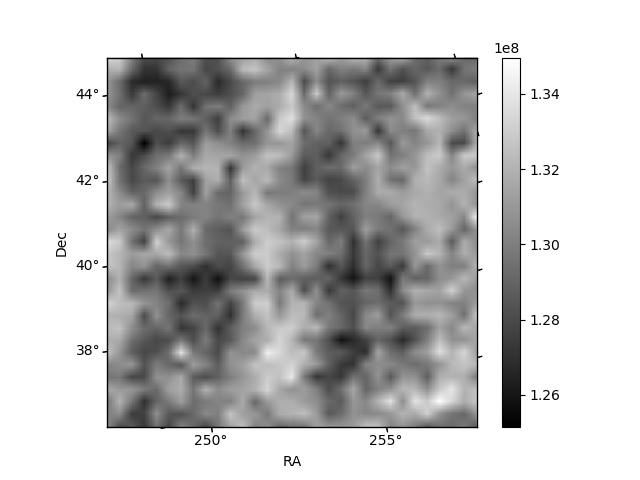
Histogram calculated using DETX and DETY for each event in the final _common_clean file
| Quadrant A | 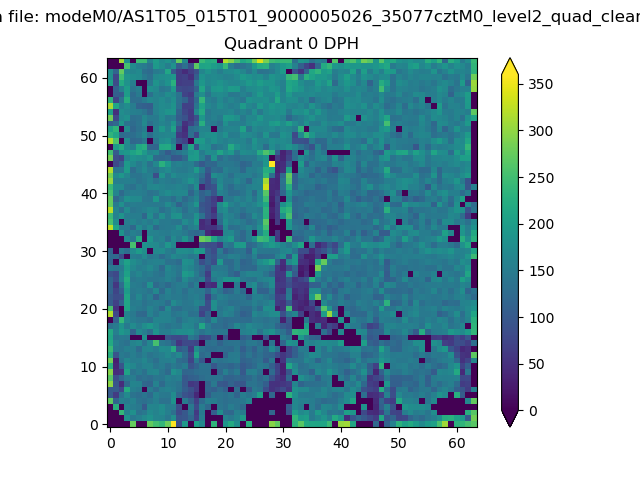 |
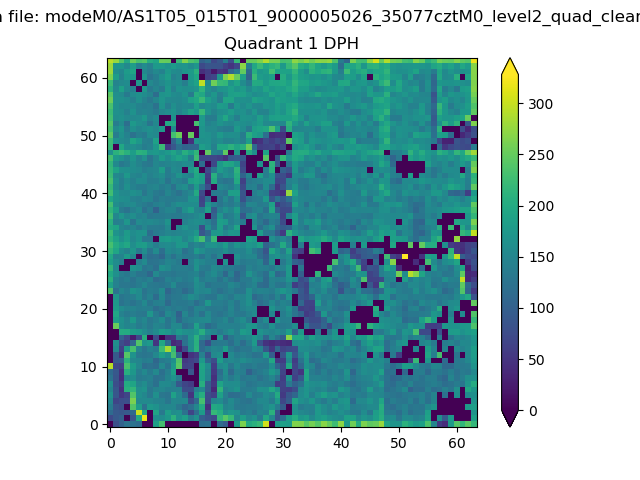 |
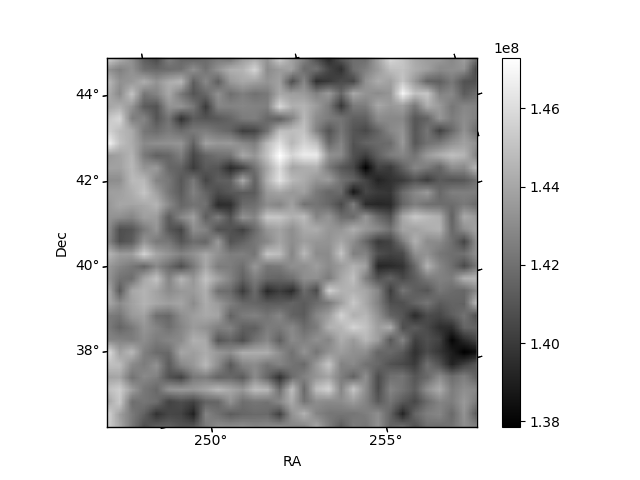
Quadrant B |
|---|---|---|---|
| Quadrant D | 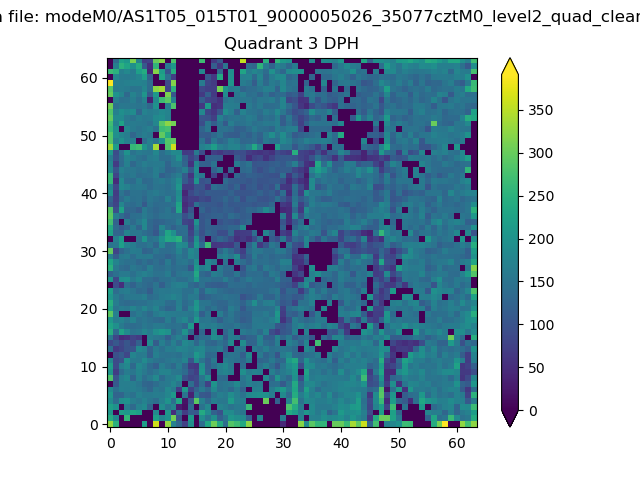 |
 |
Quadrant C |
| Plot type | Count rate plots | Images |
|---|---|---|
| Comparison with Poisson distribution Blue bars denote a histogram of data divided into 1 sec bins. Red curve is a Poisson curve with rate = median count rate of data. |
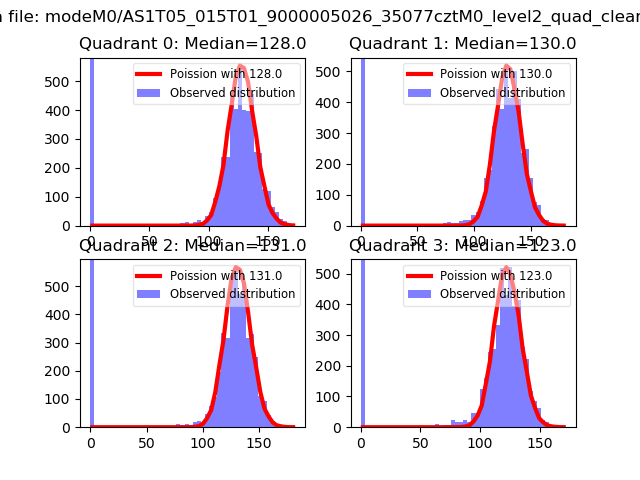 |
 |
| Quadrant-wise count rates Data is divided into 100 sec bins |
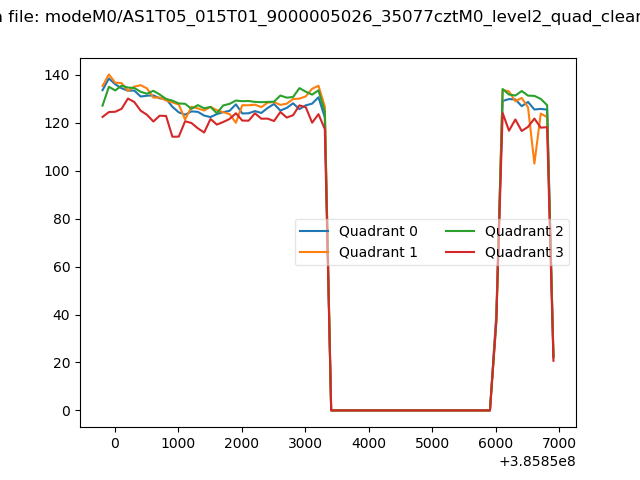 |
|
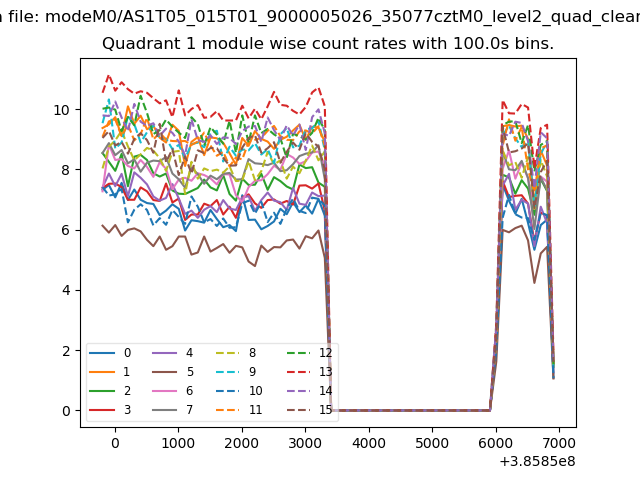
| Module-wise count rates for Quadrant A Data is divided into 100 sec bins |
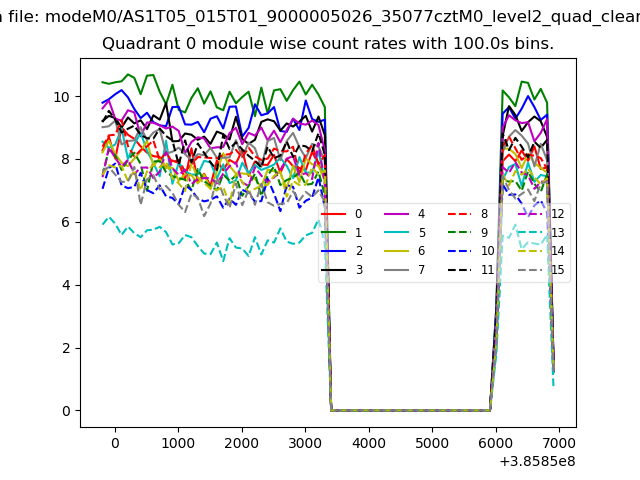 |
 |
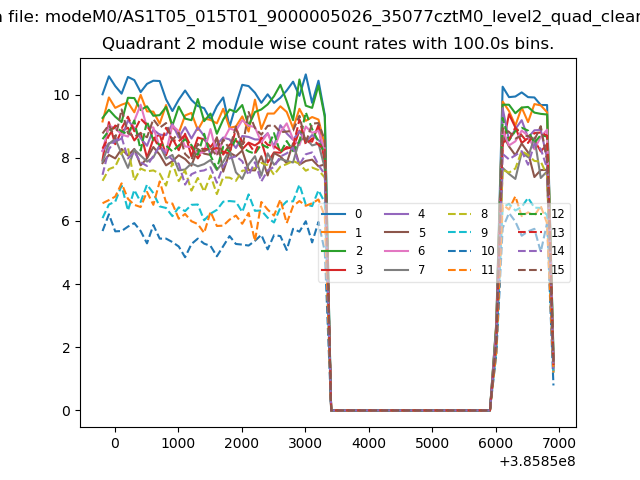
| Module-wise count rates for Quadrant B Data is divided into 100 sec bins |
 |
 |
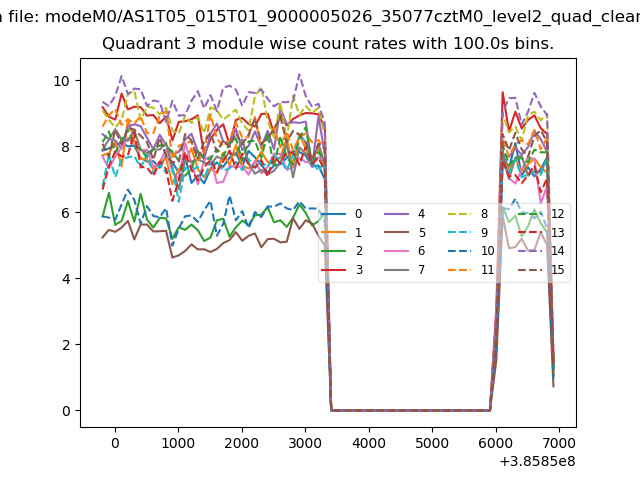
| Module-wise count rates for Quadrant C Data is divided into 100 sec bins |
 |
 |
| Module-wise count rates for Quadrant D Data is divided into 100 sec bins |
 |
 |
| Parameter | Plot |
|---|---|
| CZT HV Monitor | 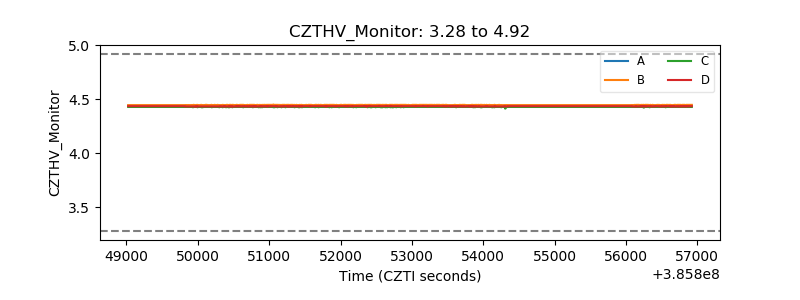 |
| D_VDD | 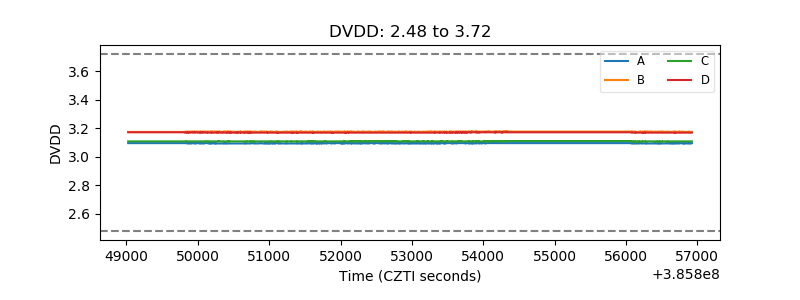 |
| Temperature 1 | 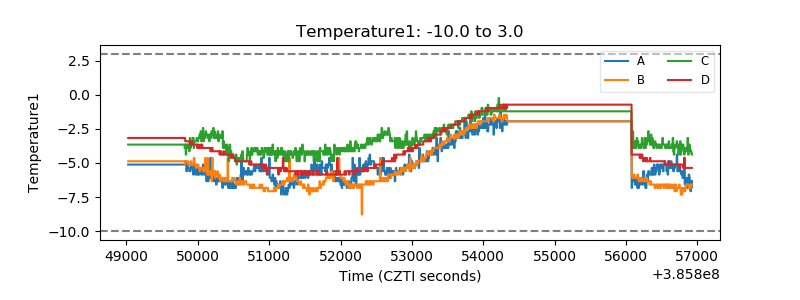 |
| Veto HV Monitor | 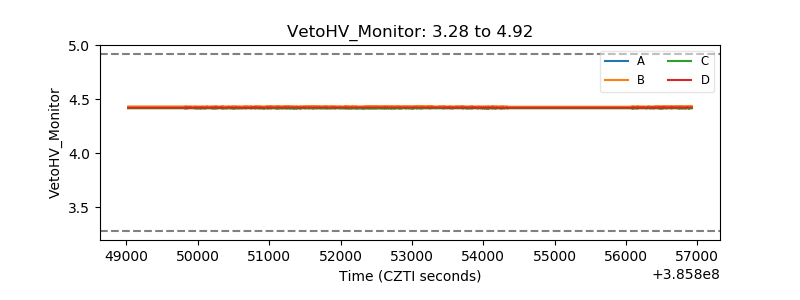 |
| Veto LLD | 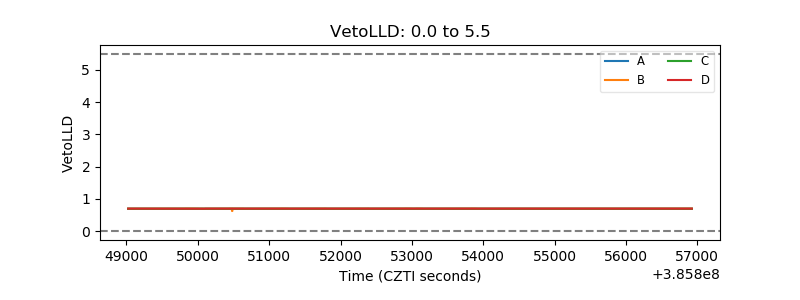 |
| Alpha Counter | 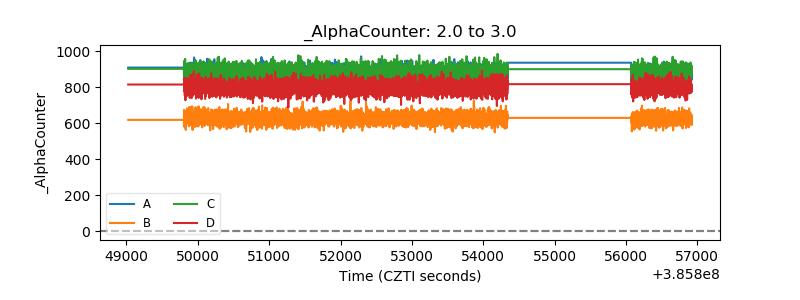 |
| _CPM_Rate | 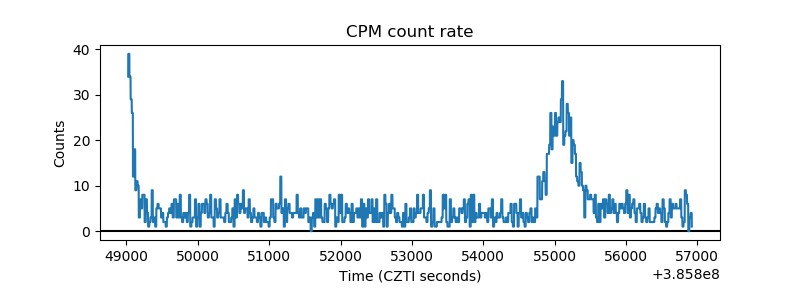 |
| CZT Counter | 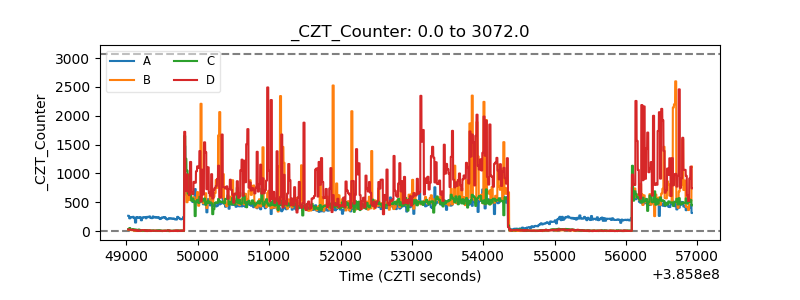 |
| +2.5 Volts monitor | 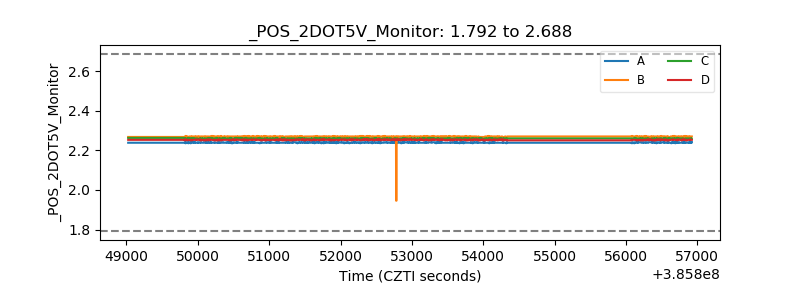 |
| +5 Volts monitor | 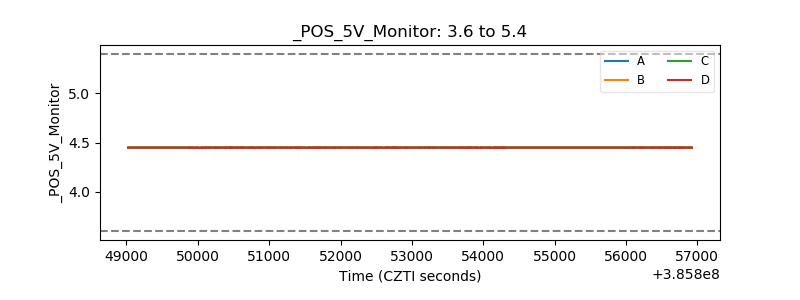 |
| _ROLL_ROT | 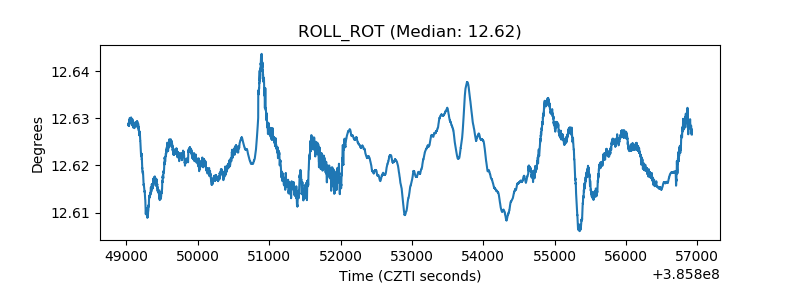 |
| _Roll_DEC | 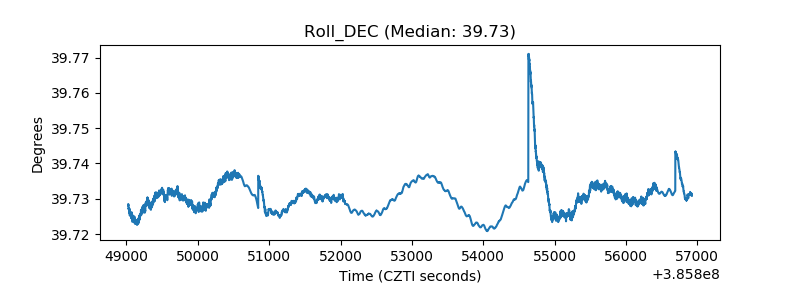 |
| _Roll_RA | 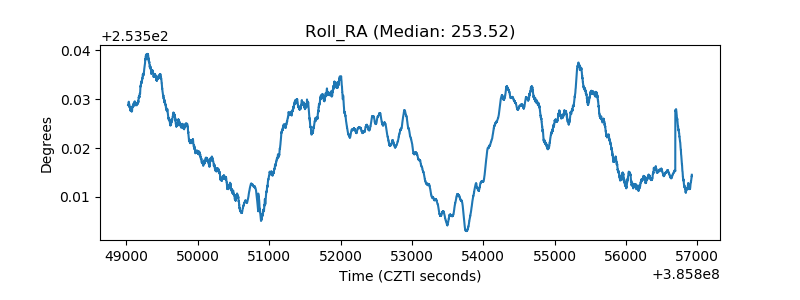 |
| Veto Counter | 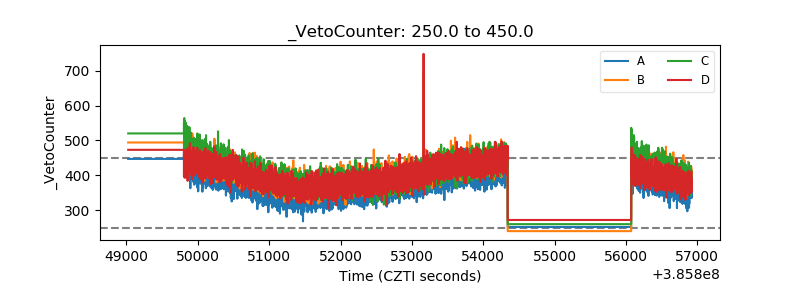 |