| Param | Original file | Final file |
|---|---|---|
| Filename | modeM0/AS1T05_015T01_9000005026_35073cztM0_level2.evt | modeM0/AS1T05_015T01_9000005026_35073cztM0_level2_quad_clean.evt |
| Size (bytes) | 1,156,933,440 | 161,375,040 |
| Size | 1.1 GB | 153.9 MB |
| Events in quadrant A | 6,933,191 | 1,003,699 |
| Events in quadrant B | 8,531,565 | 1,008,069 |
| Events in quadrant C | 7,677,846 | 1,003,571 |
| Events in quadrant D | 10,984,738 | 938,984 |
| Mode SS | |||
|---|---|---|---|
| Quadrant | BADHDUFLAG | Total packets | Discarded packets |
| A | 0 | 276 | 0 |
| B | 0 | 276 | 0 |
| C | 0 | 276 | 0 |
| D | 0 | 276 | 0 |
| Mode M9 | |||
|---|---|---|---|
| Quadrant | BADHDUFLAG | Total packets | Discarded packets |
| A | 0 | 58 | 0 |
| B | 0 | 58 | 0 |
| C | 0 | 58 | 0 |
| D | 0 | 58 | 0 |
| Mode M0 | |||
|---|---|---|---|
| Quadrant | BADHDUFLAG | Total packets | Discarded packets |
| A | 0 | 28839 | 4 |
| B | 0 | 33714 | 3 |
| C | 0 | 30653 | 3 |
| D | 0 | 42106 | 10 |
| Quadrant | Total seconds | Saturated seconds | Saturation percentage |
|---|---|---|---|
| A | 13508 | 28 | 0.207285% |
| B | 13508 | 311 | 2.302339% |
| C | 13508 | 106 | 0.784720% |
| D | 13507 | 490 | 3.627749% |
Noise dominated data is calculated using 1-second bins in cleaned event files. If a bin has >2000 counts, and if more than 50% of those come from <1% of pixels, then it is considered to be noise-dominated and hence unusable.
| Quadrant | # 1 sec bins | Bins with >0 counts | Bins with >2000 counts | High rate bins dominated by noise | Noise dominated (total time) | Noise dominated (detector-on time) | Marked lightcurve |
|---|---|---|---|---|---|---|---|
| A | 19338 | 13511 | 7 | 7 | 0.04% | 0.05% | 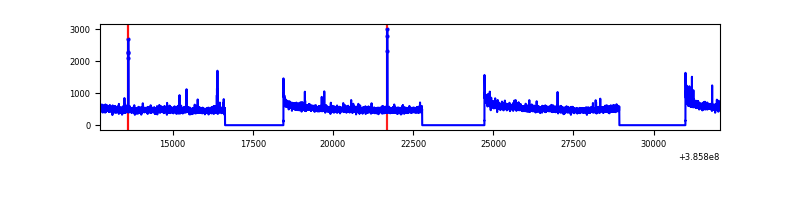 |
| B | 19338 | 13511 | 167 | 167 | 0.86% | 1.24% | 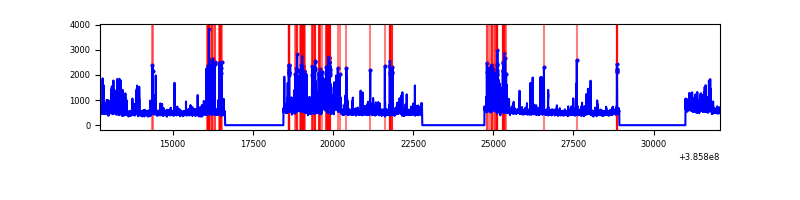 |
| C | 19338 | 13511 | 91 | 91 | 0.47% | 0.67% | 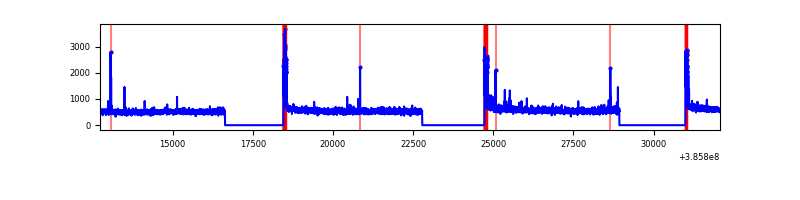 |
| D | 19338 | 13511 | 380 | 380 | 1.97% | 2.81% | 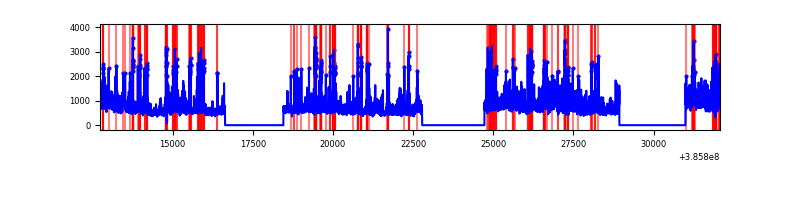 |
Top three noisy pixels from each quadrant. If the there are fewer than three noisy pixels in the level2.evt file, extra rows are filled as -1
| Pixel properties | Quadrant properties | ||||||
|---|---|---|---|---|---|---|---|
| Quadrant | DetID | PixID | Counts | Sigma | Mean | Median | Sigma |
| A | 10 | 83 | 149751 | 430.91 | 1739 | 1712 | 343.5 |
| A | 13 | 6 | 25358 | 68.83 | 1739 | 1712 | 343.5 |
| A | 13 | 254 | 23721 | 64.06 | 1739 | 1712 | 343.5 |
| B | 5 | 172 | 1280525 | 4013.34 | 1712 | 1672 | 318.7 |
| B | 0 | 189 | 203520 | 633.45 | 1712 | 1672 | 318.7 |
| B | 4 | 232 | 106257 | 328.21 | 1712 | 1672 | 318.7 |
| C | 15 | 214 | 556262 | 1444.37 | 1690 | 1708 | 383.9 |
| C | 0 | 10 | 308331 | 798.62 | 1690 | 1708 | 383.9 |
| C | 14 | 67 | 157879 | 406.76 | 1690 | 1708 | 383.9 |
| D | 8 | 195 | 2433358 | 6109.07 | 1673 | 1633 | 398.1 |
| D | 13 | 249 | 585751 | 1467.44 | 1673 | 1633 | 398.1 |
| D | 2 | 250 | 379612 | 949.57 | 1673 | 1633 | 398.1 |
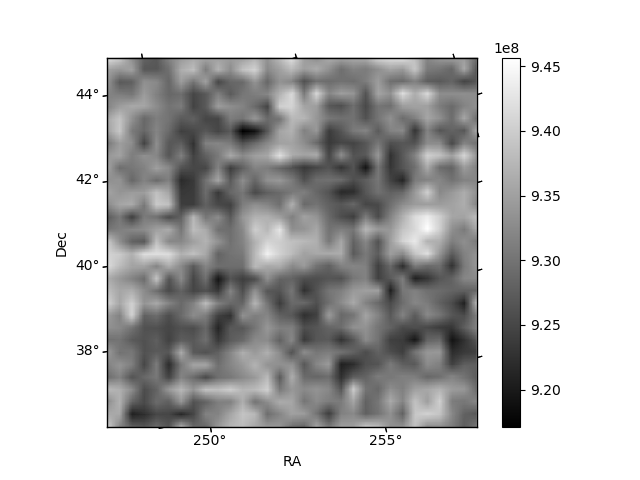
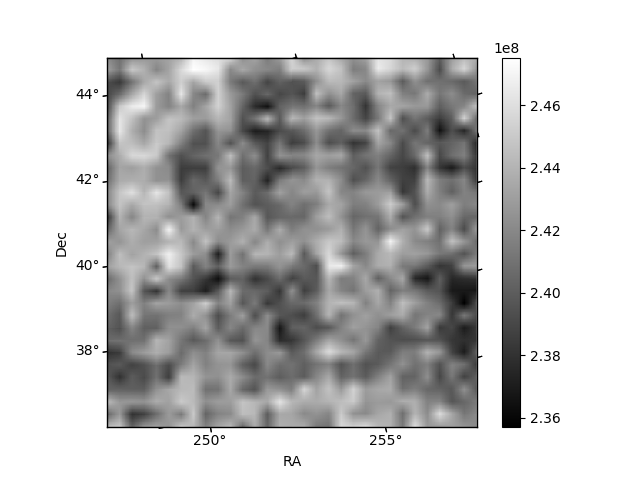
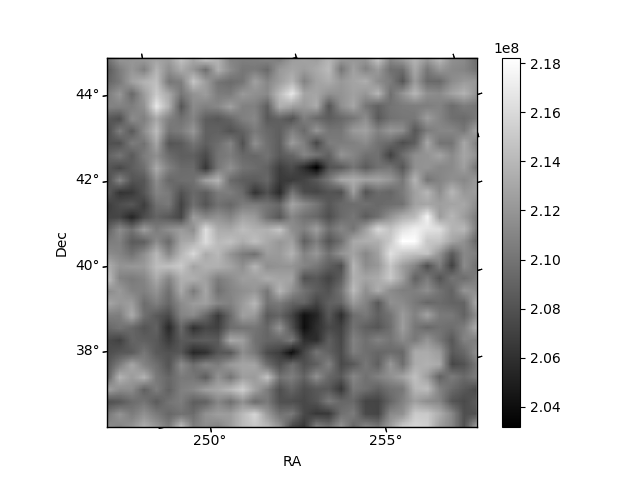
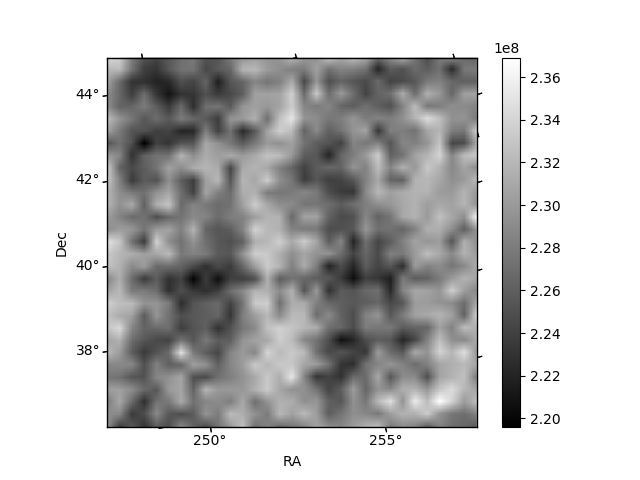
Histogram calculated using DETX and DETY for each event in the final _common_clean file
| Quadrant A | 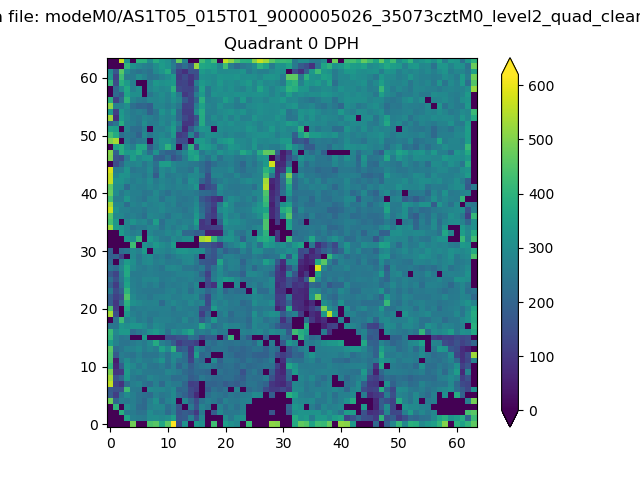 |
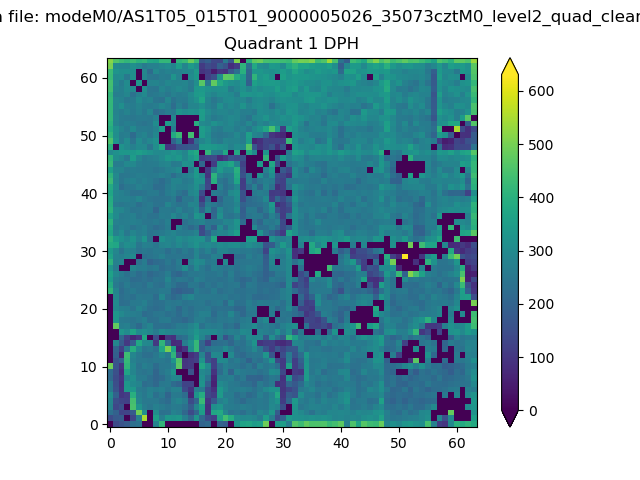 |
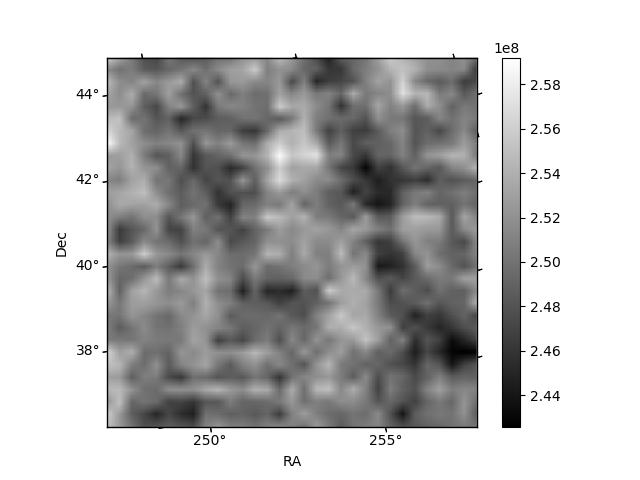
Quadrant B |
|---|---|---|---|
| Quadrant D | 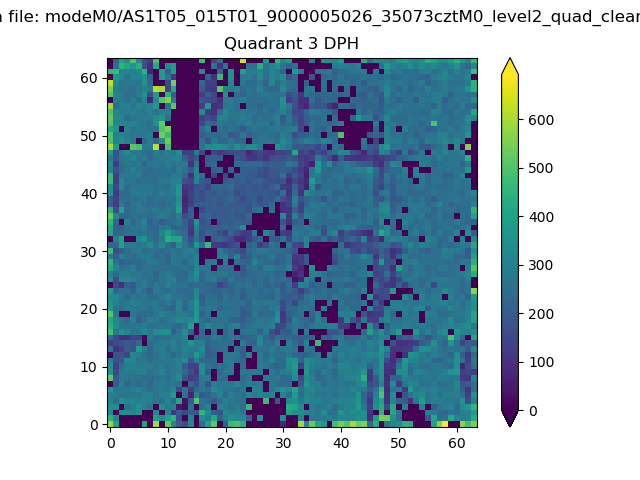 |
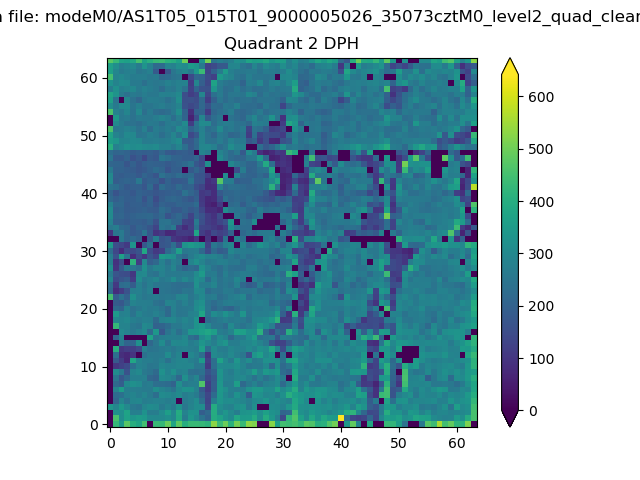 |
Quadrant C |
| Plot type | Count rate plots | Images |
|---|---|---|
| Comparison with Poisson distribution Blue bars denote a histogram of data divided into 1 sec bins. Red curve is a Poisson curve with rate = median count rate of data. |
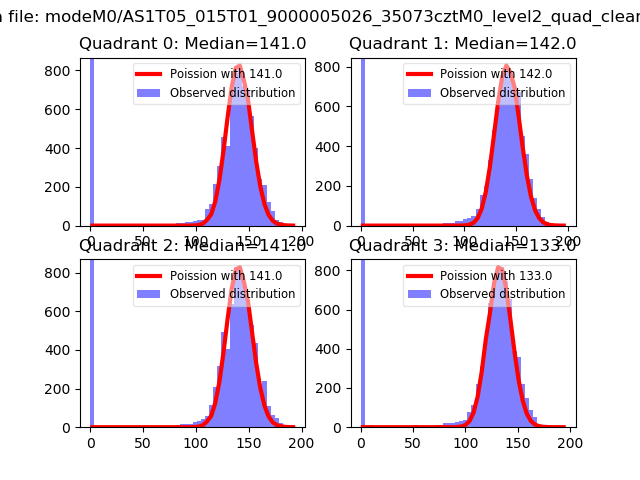 |
 |
| Quadrant-wise count rates Data is divided into 100 sec bins |
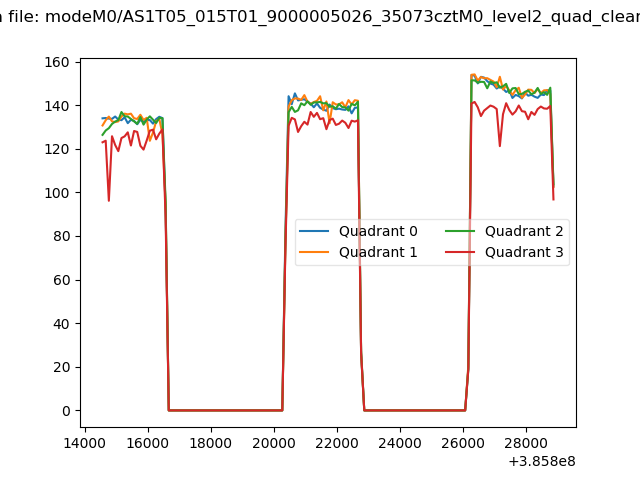 |
|
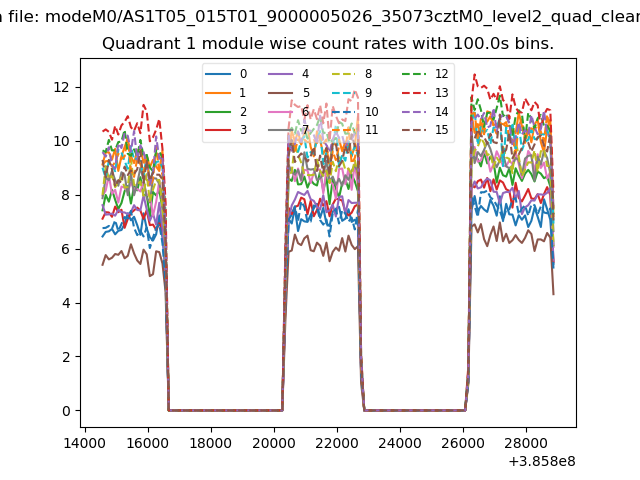
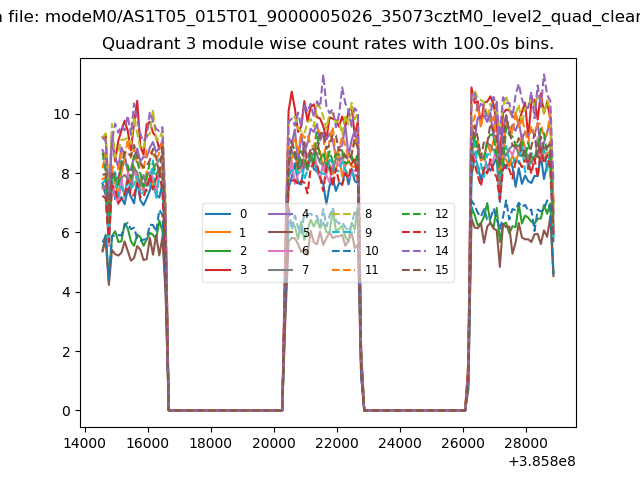
| Module-wise count rates for Quadrant A Data is divided into 100 sec bins |
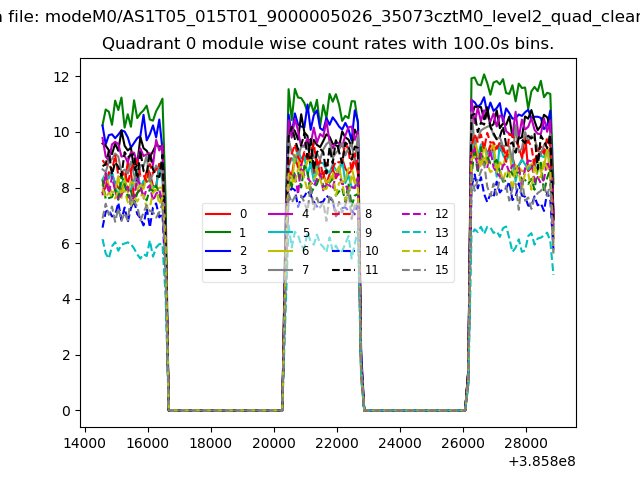 |
 |
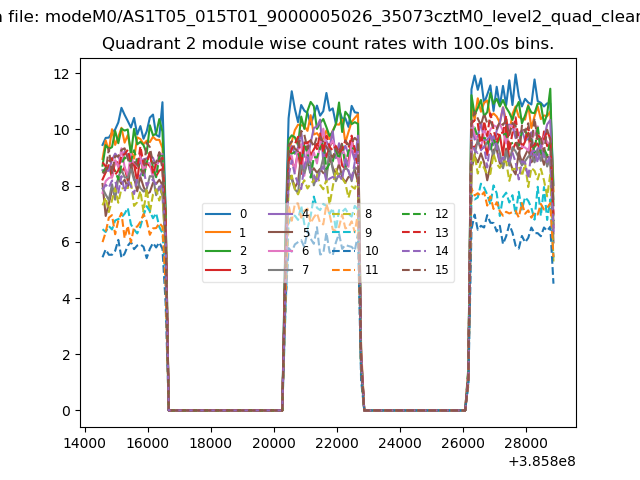
| Module-wise count rates for Quadrant B Data is divided into 100 sec bins |
 |
 |
| Module-wise count rates for Quadrant C Data is divided into 100 sec bins |
 |
 |
| Module-wise count rates for Quadrant D Data is divided into 100 sec bins |
 |
 |
| Parameter | Plot |
|---|---|
| CZT HV Monitor | 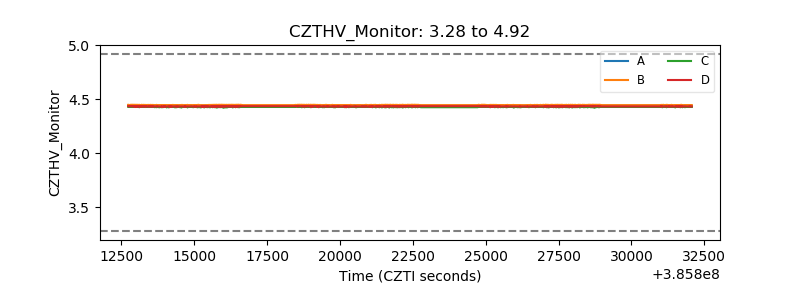 |
| D_VDD | 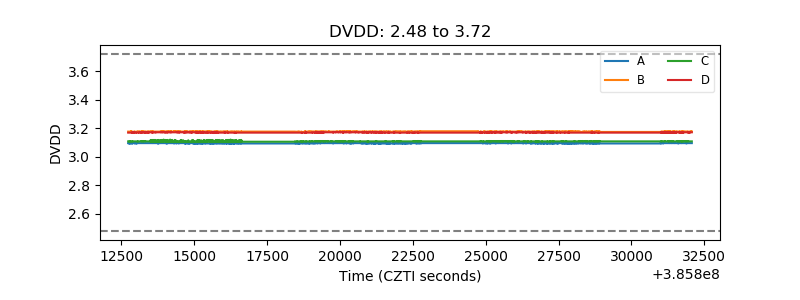 |
| Temperature 1 | 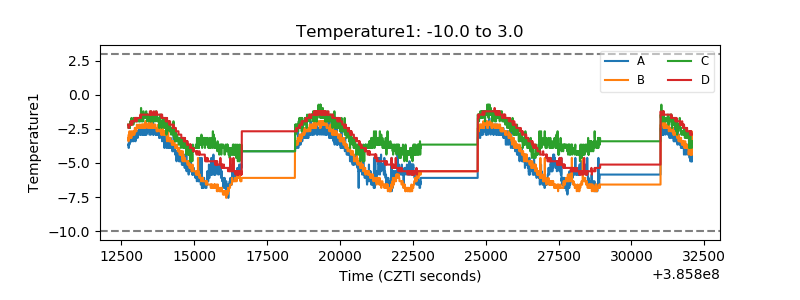 |
| Veto HV Monitor | 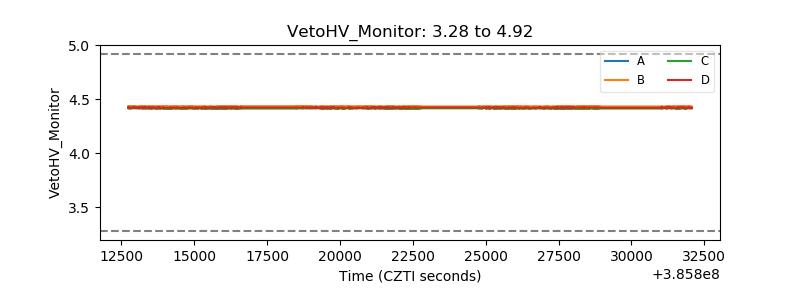 |
| Veto LLD | 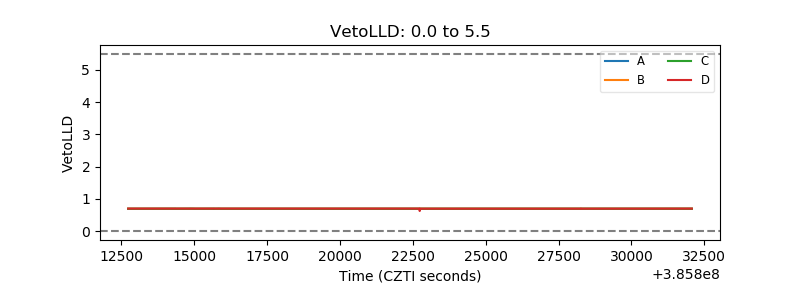 |
| Alpha Counter | 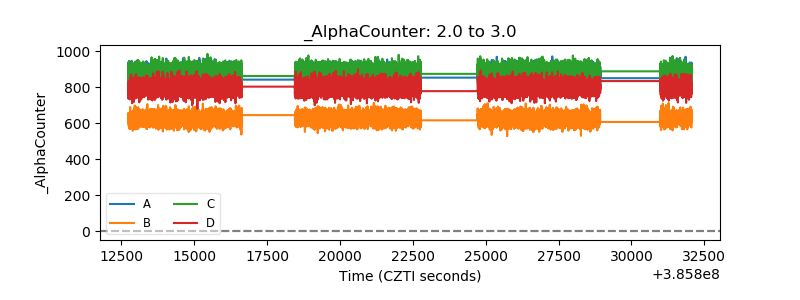 |
| _CPM_Rate | 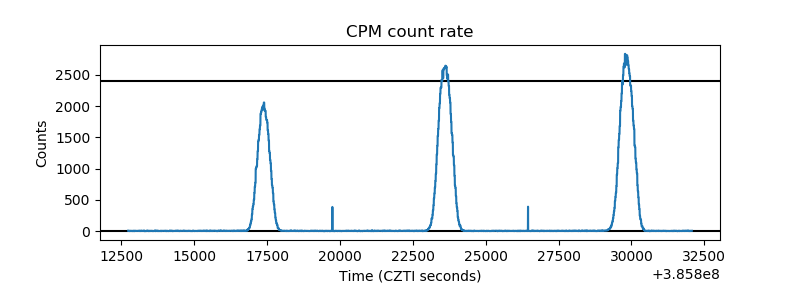 |
| CZT Counter | 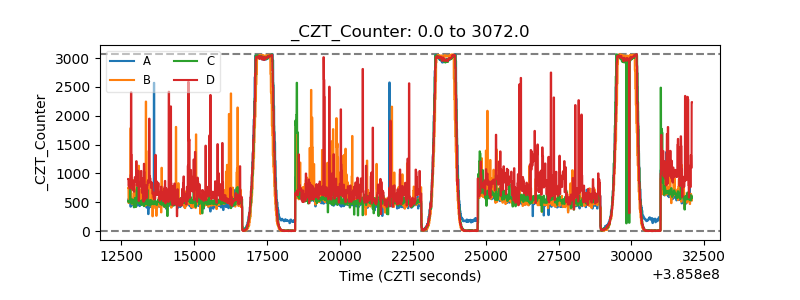 |
| +2.5 Volts monitor | 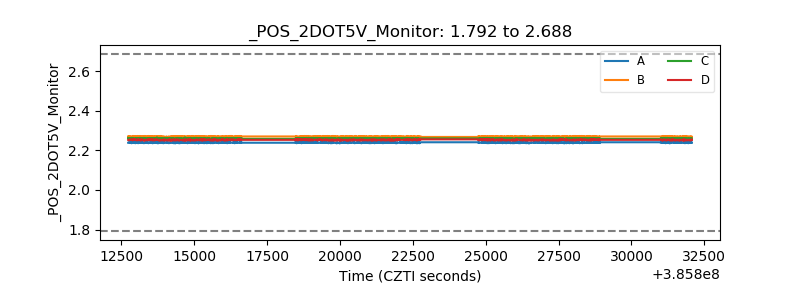 |
| +5 Volts monitor | 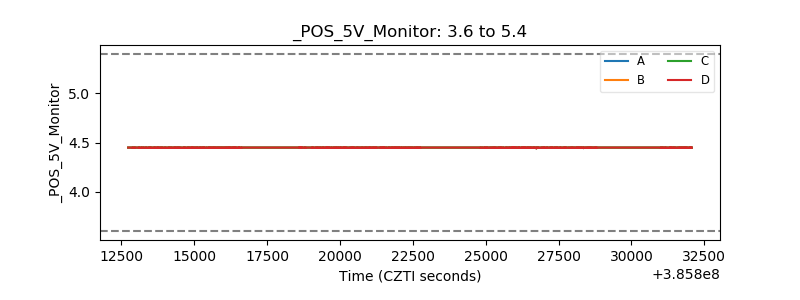 |
| _ROLL_ROT | 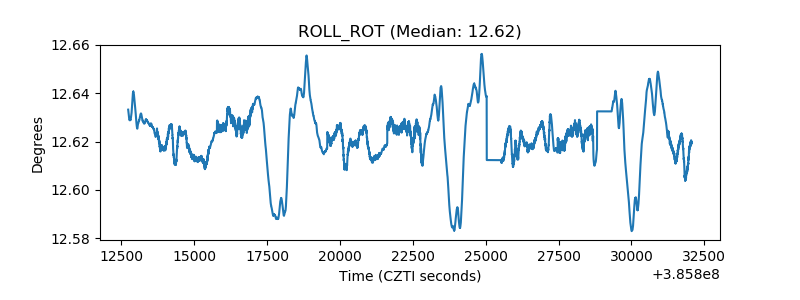 |
| _Roll_DEC | 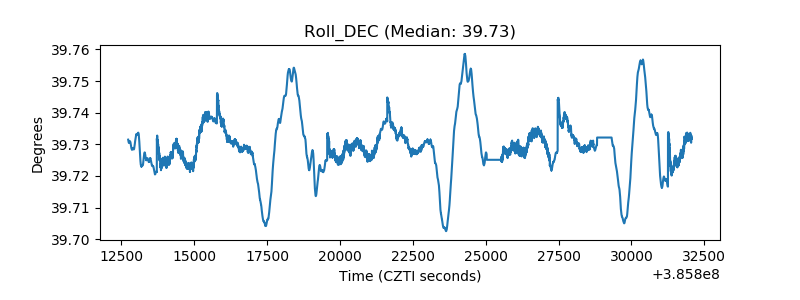 |
| _Roll_RA | 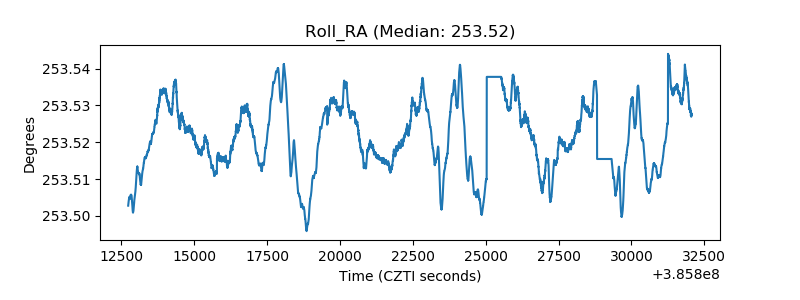 |
| Veto Counter | 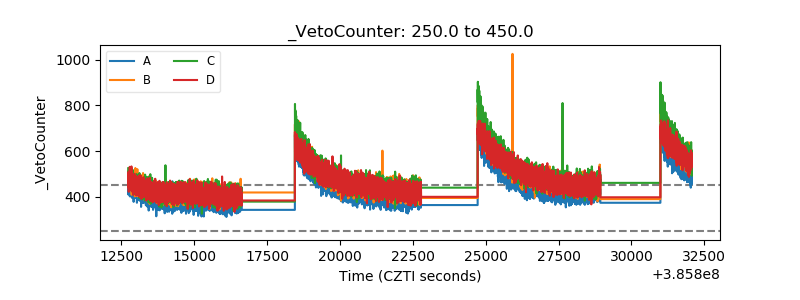 |